2220
MR Protocol Optimization for Treatment Planning Simulation of Ocular Melanoma Proton Therapy1Radiology and Imaging Sciences, Emory Healthcare, Atlanta, GA, United States, 2Radiation Oncology, Emory Healthcare, Atlanta, GA, United States, 3Radiation Oncology, Emory University, Atlanta, GA, United States
Synopsis
An MR treatment planning simulation protocol for proton therapy in patients with ocular melanoma was optimized using a 70-mm loop coil.
Purpose
Ocular melanoma is the most common primary type of intraocular cancer1. While smaller tumors are typically eligible for brachytherapy, larger tumors are often enucleated or treated with proton beam therapy2. Precise tumor delineation is important for accurate planning and delivery of proton therapy to ensure appropriate tumor coverage and critical structure sparing3. While ultrasound is conventionally used for intraocular measurements, MRI has recently been explored as a potential value addition to the treatment planning simulation4-5. This work seeks to optimize the MR simulation protocol to fully integrate treatment planning of ocular melanoma into image-guided a proton therapy workflow.Methods
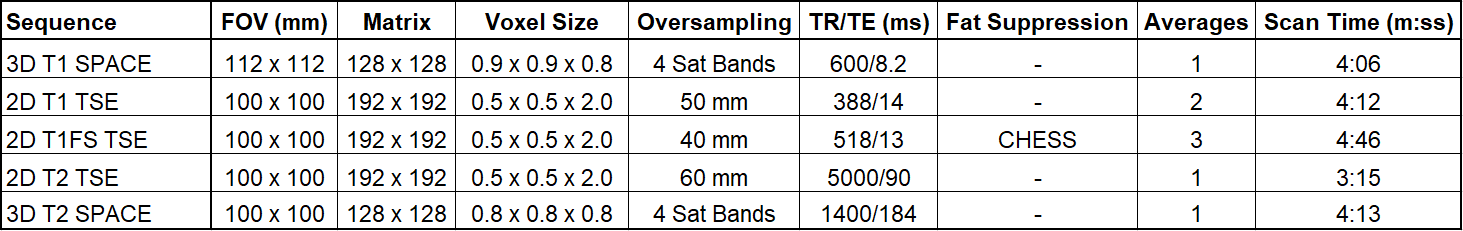
All imaging was performed on a clinical 1.5T magnet (MAGNETOM Aera, Siemens Medical Solutions USA, Inc., Malvern, PA) using either a 20-channel head/neck coil or a 70-mm loop coil for signal reception. A comparison of coil SNR was performed by acquiring an axial T1 TSE image of a 5300 mL water phantom with either the head coil (single element or sum-of-squares combination of all elements) or the loop coil using the same parameters: TR/TE = 500/20 ms, 250x250 mm FOV, 256x256 Matrix, 5-mm slice thickness, 2 min scan time. Under an IRB waiver, three normal volunteers were recruited to undergo MR imaging of the eye for sequence development with the loop coil. An iterative process of sequence development was then performed on several 2D and 3D gradient echo and spin echo sequences, maximizing spatial resolution, minimizing artifacts, and maintaining an SNR of at least 2.5 for 2D sequences and 25 for 3D sequences. Then, under IRB approval, patients with ocular melanoma were recruited to partake in a treatment planning study after their initial consultation and simulation CT, using the MR protocol as outlined in Figure 1. The use of contrast was not approved, so the MR protocol was performed without contrast.Results and Discussion
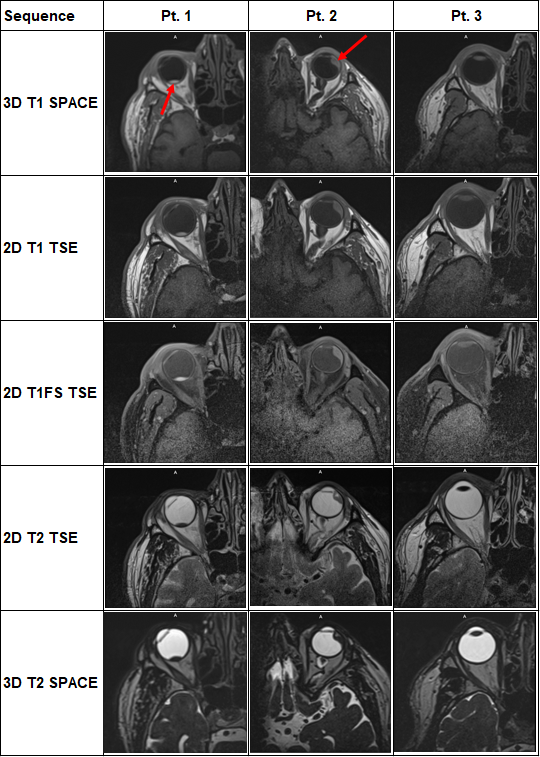
In the phantom experiment, higher SNR was measured with the 70-mm loop coil (735) compared to the 20-channel head coil using either a single element (136) or a sum-of-squares combination of all elements (53), due to its smaller size and closer proximity to the phantom. Volunteer scanning confirmed that the increased SNR from the loop coil allowed for higher-resolution imaging than the head coil, a benefit that outweighed the inability to perform parallel imaging due to the use of a single element and channel. Spin echo sequences (2D TSE and 3D SPACE) demonstrated fewer susceptibility artifacts around the orbits and sinuses than 2D GRE or 3D GRE sequences like CISS and MPRAGE. In addition to the importance of clear patient instructions and head immobility to reduce motion artifacts, the use of oversampling on 2D sequences and saturation bands on 3D sequences was found to be critical to avoid aliasing. Figure 2 displays representative images from each of the three patients with ocular melanoma. The tumors were well delineated in Patients 1 and 2 (red arrows) as positive contrast on T1-weighted images and negative contrast on T2-weighted images. However, Patient 3 had a very thin tumor (less than 1 mm) near the cornea, which was not well visualized on MR due to volume averaging. A scan plane perpendicular to the long-axis of the tumor was chosen, which for all three patient was an axial orientation, but depending on the location of the tumor in the globe of the eye could be more sagittal in orientation. All patients remained still and held their eyes closed, which helped reduce motion artifacts.Conclusion
This study showed the development process of an optimized MR treatment planning simulation protocol for proton therapy in patients with ocular melanoma. The use of a 70-mm loop coil allows for high-resolution imaging of tumors greater than 1-mm thick at 1.5T with scan times less than 5 minutes per sequence. A combination of 2-mm thick 2D TSE sequences with higher in-plane resolution for delineation of tumor origin and extension and isotropic 3D SPACE sequences with higher through-plane resolution for accurate 3D measurements is needed in the treatment planning process. In the future, gaze-fixation with the patient looking through the loop coil at a fixed point in space may be needed for some treatment plans.Acknowledgements
No acknowledgement found.References
1. Daftari Ik, Aghaian E, O'Brien JM, Dillon W, Phillips TL. 3D MRI-based tumor delineation of ocular melanoma and its comparison with conventional techniques. Med Phys. 2005;32(11):3355-3362. doi:10.1118/1.2068927
2. Marnitz S, Cordini D, Bendl R, et al. Proton therapy of uveal melanomas: intercomparison of MRI-based and conventional treatment planning. Strahlenther Onkol. 2006;182(7):395-399. doi:10.1007/s00066-006-1512-1
3. Nguyen HG, Sznitman R, Maeder P, et al. Personalized Anatomic Eye Model From T1-Weighted Volume Interpolated Gradient Echo Magnetic Resonance Imaging of Patients With Uveal Melanoma. Int J Radiat Oncol Biol Phys. 2018;102(4):813-820. doi:10.1016/j.ijrobp.2018.05.004
4. Ferreira TA, Grech Fonk L, Jaarsma-Coes MG, van Haren GGR, Marinkovic M, Beenakker JM. MRI of Uveal Melanoma. Cancers (Basel). 2019;11(3):377. Published 2019 Mar 17. doi:10.3390/cancers11030377
5. Via R, Hennings F, Pica A, et al. Potential and pitfalls of 1.5T MRI imaging for target volume definition in ocular proton therapy. Radiother Oncol. 2021;154:53-59. doi:10.1016/j.radonc.2020.08.023
Figures