2218
Estimation and visualization of geometric fidelity using geometric offset maps for improved guidance in H&N radiation therapy1Department of Radiation Physics, Institute of Clinical Sciences, University of Gothenburg, Gothenburg, Sweden, 2Department of Medical Physics and Biomedical Engineering, Sahlgrenska University Hospital, Gothenburg, Sweden, 3Department of Oncology and Radiotherapy, Institute of Clinical Sciences, University of Gothenburg, Gothenburg, Sweden
Synopsis
In an MRI-only workflow, high geometric fidelity of the MRI data is required. Head and neck (H&N) cancer patients, however, frequently have implants, e.g., dental restorations, causing distortions of the MRI data. Geometric offset maps were computed using B0-map calculated from the Dixon-sequence included in the standard clinical protocol. Even though the implants included in this pre-study did not contribute with a significant geometric offset in the delineated target volume, visualization of the geometric offset maps as such bring additional important information when delineating structures in an MRI-only H&N workflow and could thereby become a promising tool in clinical practice.
Introduction
The role of MRI in radiation therapy (RT) has increased during the past decades, and MRI data are now frequently used as a complement to CT data for guidance when delineating tumor and organs at risk (OARs). The combined CT/MRI treatment planning process is, however, not unproblematic due to a mandatory registration between the two imaging modalities that will introduce systematic uncertainties. An alternative to CT based RT is the so-called MRI-only RT, where the MRI data is the only image data used in all steps of the treatment workflow1.A requirement for proper implementation of an MRI-only workflow is high geometric fidelity in the MRI data. Common implants in the head and neck (H&N) region are dental restorations causing streak artifacts in the CT data and signal loss/-pileups in the MRI data. As the visibility in both the MRI and CT are affected, difficulties could occur when delineating the tumor and/or OARs.
MRI sequences for reduction of metal artefacts are available, and the severity of the geometric distortions can be reduced by careful sequence optimization. However, since these measurements are population-based solutions, it might not guarantee a sufficient MR image quality for radiation therapy purposes. An individual assessment of the system, and patient specific geometric distortions can be obtained by calculation of a field distortion map (B0-maps), which can be used for visual guidance and geometric correction of the MRI data.
In this project, we suggest using pixel-wise geometric offset maps derived from B0-maps to visualize the severity of magnetic field distortions caused by implants in the H&N region, and to estimate the impact these objects have on delineation of tumors in MRI only H&N treatment planning.
Methods
In this pre-study, MRI phase and magnitude data (T1 weighted DixonVibe) from 3 patients included in an MRI-only study for generation of synthetic CT data were analyzed2. One of the patients did not have any high magnetic susceptibility objects present in the H&N region; the second patient had dental restorations; and the third patient had a surgical implant located in the planning target volume (PTV).As the Dixon sequence is based on two echoes, the known phase and echo time difference can be used to calculate B0-maps after unwrapping of the periodic phases. The Hermitian product of the complex data and magnitude data was used to calculate a complex wrapped B0-map3,4. This was further unwrapped using the traditional approach, where a boxcar filter was altered from 3-19 pixels to avoid that the absence of fat signal in the phase data were interpreted as phase wraps. The unwrapped B0-map was further divided by the readout bandwidth and multiplied with the in-plane resolution to create a geometric offset map in mm. The mean geometric distortions, as well as the maximum and minimum value, was calculated within the PTV structure.
Results
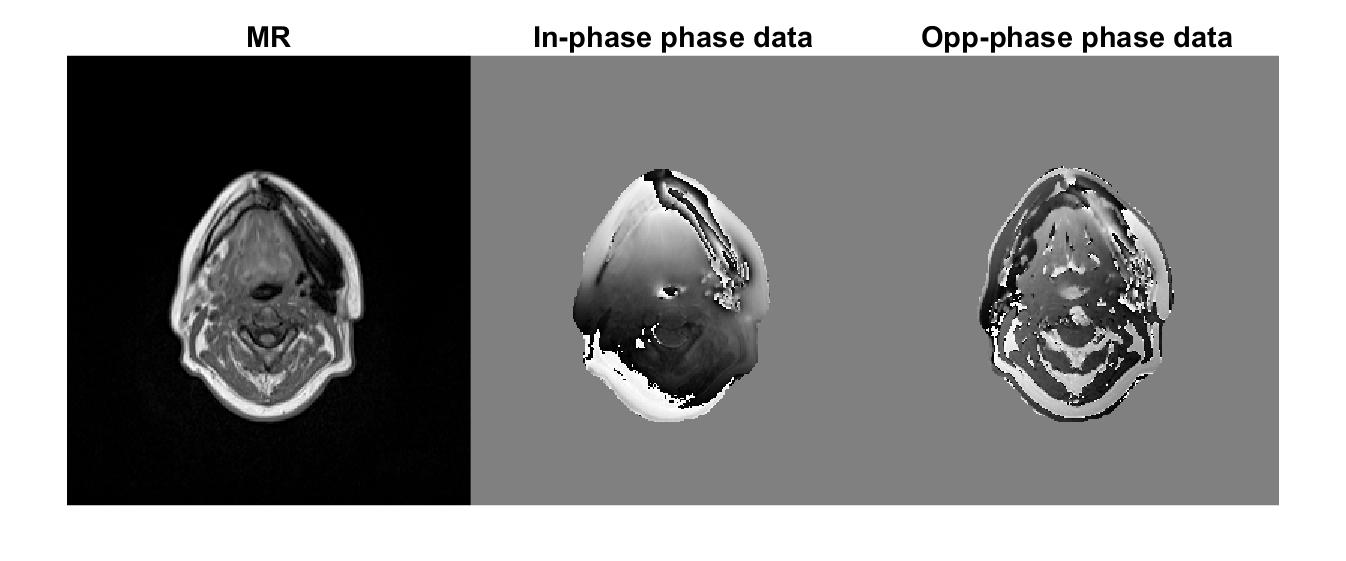
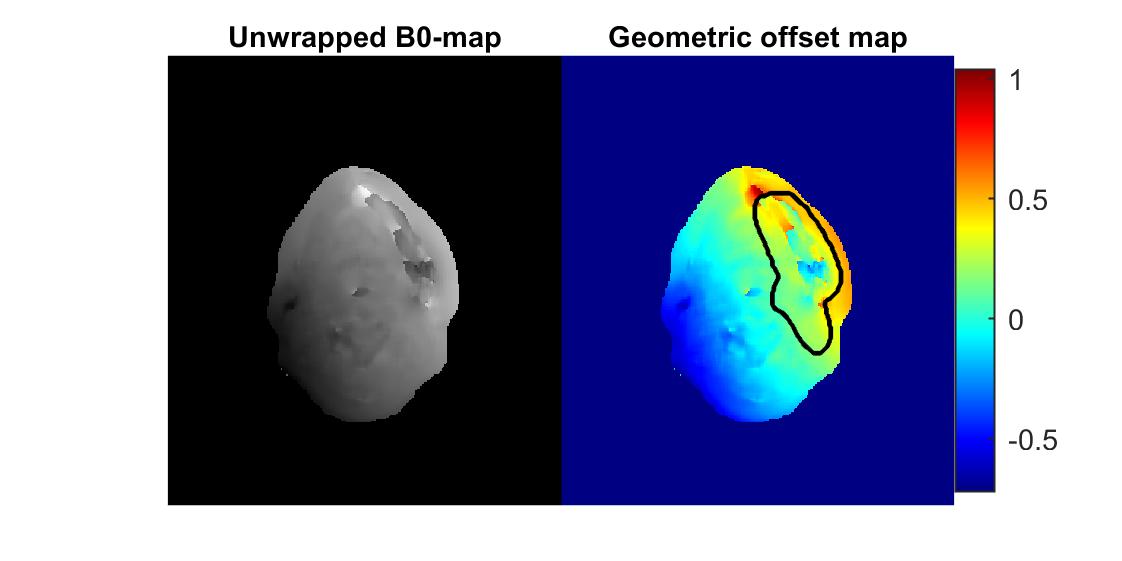
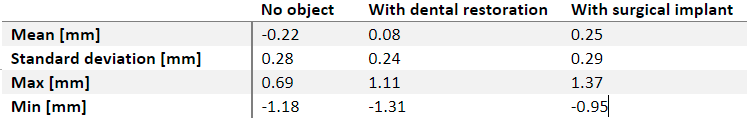
B0-maps without unwrapping-errors was obtained for all patients using a filter ≥ 7 pixels. Figure 1 shows in-phase magnitude MRI data as well as in- and opposed phase MRI phase data for the patient with a surgical implant. Figure 2 shows the calculated unwrapped B0-map and geometric offset map with the delineated PTV structure for the same patient.The mean, maximum and minimum geometric distortions within the PTV in the H&N region for each patient are presented in Table 1.
Discussion
The head and neck region contains various anatomical tissue types (e.g., muscle, fat, air, and bones), has a large difference in body contour size in different parts of the field of view, and many patients have implants, i.e., it is a complex region to calculate B0-maps without any unwrapping-errors. The method suggested in this work successfully calculated and unwrapped B0-maps using the Hermitian product and a boxcar filter of 7 pixels. A drawback of the method is the size of the boxcar filter which often is large compared to the extent of the phase wraps near high magnetic susceptibility objects. The boxcar filter merged multiple periodic phases and as a result the geometric distortions were underestimated.The MR images of the three patients included in this pre-study showed only small geometric distortions, even in the presence of metal objects in the H&N region. However, depending on the parameters used for the MR acquisition, the distortions may become larger. Therefore, the tool presented in this work could be an important help for the physician in the estimation of the impact an object with high susceptibility has on the image, and potentially adjustment of the delineation based on the new information provided.
Conclusion
This pre-study shows that a Dixon-sequence from the standard clinical protocol can be used to calculate geometric distortion maps for the rather complex H&N region. The additional information these maps contributes with during delineation of structures in an MRI-only H&N workflow implies that the proposed method would be a promising clinical tool for MRI based radiation therapy.Acknowledgements
No acknowledgement found.References
1. Owrangi AM, Greer PB, Glide-Hurst CK. MRI-only treatment planning: benefits and challenges [published online ahead of print 2018/02/03]. Phys Med Biol. 2018;63(5):05tr01.
2. Palmér E, Karlsson A, Nordström F, et al. Synthetic computed tomography data allows for accurate absorbed dose calculations in a magnetic resonance imaging only workflow for head and neck radiotherapy [published online ahead of print 2021/04/27]. Phys Imaging Radiat Oncol. 2021;17:36-42.
3. Coombs BD, Szumowski J, Coshow W. Two-point Dixon technique for water-fat signal decomposition with B0 inhomogeneity correction [published online ahead of print 1997/12/24]. Magn Reson Med. 1997;38(6):884-889.
4. Liu J, Peters DC, Drangova M. Method of B0 mapping with magnitude-based correction for bipolar two-point Dixon cardiac MRI [published online ahead of print 2016/12/10]. Magn Reson Med. 2017;78(5):1862-1869.
Figures