2216
Integration of T2* mapping in daily prostate MR-Linac workflow for hypoxia characterisation1Joint Department of Physics, The Institute of Cancer Research and The Royal Marsden NHS Foundation Trust, London, United Kingdom, 2Department of Radiotherapy, The Royal Marsden NHS Foundation Trust, London, United Kingdom
Synopsis
T2* mapping can be a potential biomarker to characterise hypoxia and monitor treatment response throughout the course of MR-guided radiotherapy on an MR-Linac. This study explores the feasibility of integrating T2* mapping in daily prostate MR-Linac workflow using a cohort of patients with prostate cancer. We compared mean T2* values within the prostate with repeated measures acquired twice weekly during radiotherapy. T2* values at the end of treatment were higher than at the first fraction but didn’t show a consistent trend throughout treatment. Integrating T2* mapping with other functional measurements can aid in response based treatment adaptation.
Purpose
T2* mapping can be used to characterize tumour hypoxia, which is associated with therapy resistance1. Acquiring T2* maps during MR-guided radiotherapy can potentially help in treatment adaptation by escalating the doses to resistant sub-volumes. With the help of MR-Linacs2 integration of quantitative MRI in daily online adaptive radiotherapy is possible without any additional time as these measurements can be acquired during the delineation and planning phase of the workflow when the MR system is not in use3. Changes within the prostate after radiation therapy have been studied earlier using quantitative MRI such as T2 mapping and diffusion 4,5. However, changes in the T2* measurements after radiation therapy have not been studied, yet. This study aims to evaluate T2* changes in patients with prostate cancer undergoing radiotherapy on an MR-Linac.Materials and Methods
Five patients with prostate cancer received radiotherapy after androgen deprivation therapy with a dose of 60Gy/48.6Gy to prostate and seminal vesicles in 20 fractions. Patients were treated on 1.5T MR-Linac (Elekta AB. Stockholm, Sweden) and T2* mapping was acquired twice per week before treatment delivery using a radial stack-of-stars6 spoiled multi-gradient echo sequence with the following parameters: TR = 48 ms, ΔTE=5ms, FOV = 400x400x180 mm and 1.5x1.5x4 mm3 acquisition voxel size. The acquisition time for the fully sampled scan was 7:56 min. Offline reconstruction of T2* maps was performed in MATLAB (The Mathworks, Natick, MA, USA) from Dicom magnitude images and raw k-space data on a workstation with an Intel Xeon E3-1240 3.4 GHz CPU (Intel Corporation, Santa Clara, CA, USA). All non-uniform discrete Fourier transforms were computed using a GPU-based non-uniform fast Fourier transform (NUFFT) algorithm7 .T2* maps were reconstructed from Dicom magnitude images using auto-regression on linear operations (ARLO)8. Raw k-space data was corrected for gradient delay errors using joint Trajectory Auto-Corrected Image Reconstruction (TrACR)9 and model-based reconstruction10. Prostate was delineated manually and mean T2* values were compared from the whole prostate volume across all the fractions. Comparison was also made between mean T2* values calculated from Dicom (un-corrected) and raw k-space (corrected) data. The first day of treatment (fraction 0) was considered baseline and the last five fractions (15-20) were considered as an end of treatment. Statistical analysis was performed using Graphpad Prism (version 9 for Mac, San Diego, California USA).Results
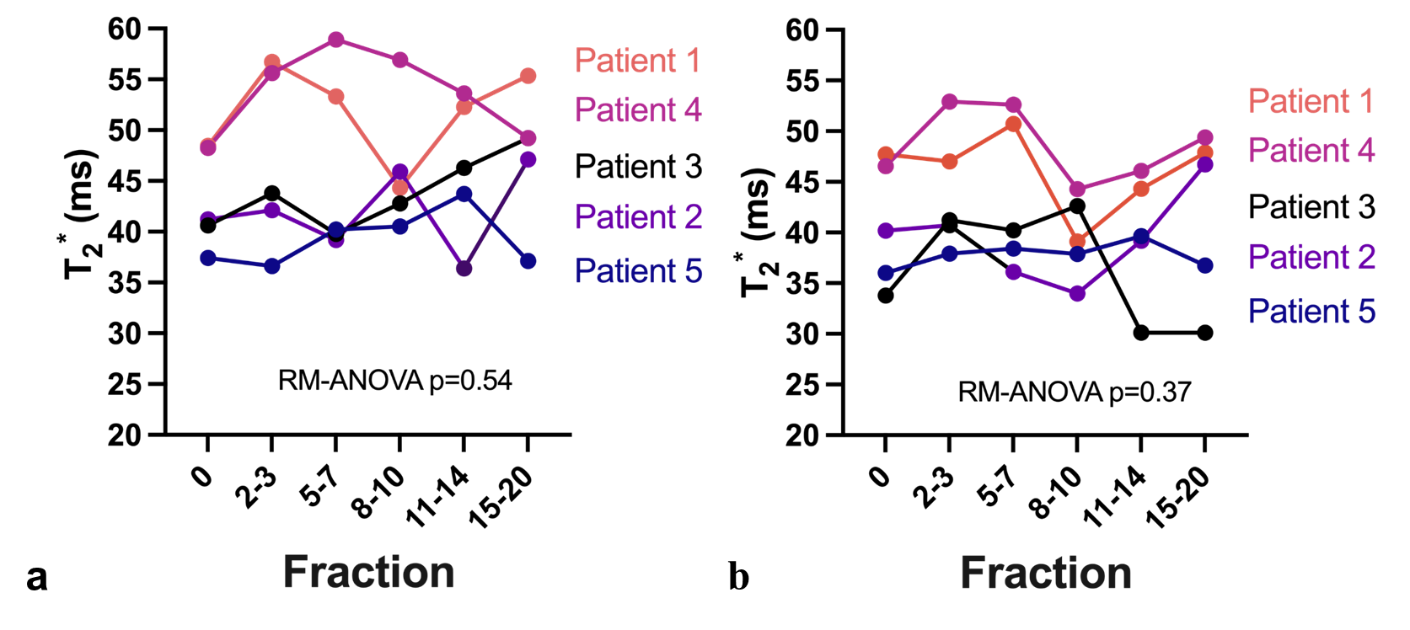
Table1 demonstrates the mean T2* values during the course of radiotherapy for the corrected and uncorrected dataset. Overall T2* values calculated with the trajectory correction were lower than the T2* calculated from Dicoms and variation across the treatment fractions was reduced. Baseline mean T2* values varied across different patients, which could be attributed to the inter-patient variability. Figure 2 shows trends in the T2* values within the prostate with and without trajectory correction. Repeated measures ANOVA showed no statistically significant difference in T2* values across different fractions for both corrected (p=0.37) and uncorrected (p=0.54). Figure 3 shows the comparison of T2* values during fraction 0 (before radiotherapy) and T2* of all the last five (15-20) fractions. There is a decrease in T2* values in all the patients at the end of treatment as compared to baseline. The difference between T2* values within the prostate of fraction 0 and fraction 15-20 was not statistically significant in uncorrected (paired t-test, p=0.05) but significant in the corrected data (paired t-test, p=0.04). This variability and the changes in the T2* values can be seen visually in corrected T2* maps across different fractions (Figure 4).Discussion and Conclusion
This was an exploratory study to evaluate the weekly changes in T2* values for prostate cancer patients undergoing radiotherapy on an MR-Linac. There was a variable change in T2* values in all patients with an overall increase in T2* at the end of treatment. This increase in T2* values could be indicative of fibrosis or apoptotic changes in the prostate. Similar trends in T2* were observed during radiotherapy for myxoid liposarcomas11. This work focused only on the changes within the whole prostate in a limited number of patients and future work will evaluate the voxel-level changes within the gross tumour volume. The correlation of T2* with clinical and quantitative parameters (e.g diffusion) may help characterize the nature of these changes and provide input for adaptive radiotherapy.Acknowledgements
No acknowledgement found.References
1. Panek R, Welsh L, Baker LC, et al. Noninvasive imaging of cycling hypoxia in head and neck cancer using intrinsic susceptibility MRI. Clin Cancer Res. 2017;23(15):4233-4241.
2. Winkel D, Bol GH, Kroon PS, et al. Adaptive radiotherapy: the Elekta Unity MR-linac concept. Clin Transl Radiat Oncol. 2019;18:54-59.
3. Van Houdt PJ, Yang Y, Van Der Heide UA. Quantitative magnetic resonance imaging for biological image-guided adaptive radiotherapy. Front Oncol. 2020;10.
4. van Schie MA, van Houdt PJ, Ghobadi G, et al. Quantitative MRI changes during weekly ultra-hypofractionated prostate cancer radiotherapy with integrated boost. Front Oncol. 2019;9.
5. Foltz WD, Wu A, Chung P, et al. Changes in apparent diffusion coefficient and T2 relaxation during radiotherapy for prostate cancer. J Magn Reson Imaging. 2013;37(4):909-916.
6. Block KT, Chandarana H, Milla S, et al. Towards routine clinical use of radial stack-of-stars 3D gradient-echo sequences for reducing motion sensitivity. J Korean Soc Magn Reson Med. 2014;18(2):87-106.
7. Knoll F, Schwarzl A, Diwoky C, Sodickson DKP. gpuNUFFT-an open source GPU library for 3D regridding with direct Matlab interface. In: ; 2014:4297-4297.
8. Pei M, Nguyen TD, Thimmappa ND, et al. An Algorithm for Fast Mono-exponential Fitting Based on Auto-Regression on Linear Operations (ARLO) of Data. Magn Reson Med Off J Soc Magn Reson Med Soc Magn Reson Med. 2015;73(2):843-850. doi:10.1002/mrm.25137
9. Ianni JD, Grissom WA. Trajectory auto‐corrected image reconstruction. Magn Reson Med. 2016;76(3):757-768.
10. Bano W, Holmes W, Golbabaee M, Tree A, OelfkeU, Wetscherek A. Joint radial trajectory correction for fast T2* mapping on an MR-Linac Proceedings of the Joint Annual Meeting ISMRM. Online; 2021.
11. Kousi E, Messiou C, Miah A, et al. Descriptive analysis of MRI functional changes occurring during reduced dose radiotherapy for myxoid liposarcomas. Br J Radiol. 2021;94(1126):20210310. doi:10.1259/bjr.20210310
Figures