2215
Multi-parametric MRI on a 0.35 T MR-LINAC: application to prostate radiotherapy treatment follow-up1Medical Physics, Centre Georges-François Leclerc, Dijon, France, 2Radiotherapy, Centre Georges-François Leclerc, Dijon, France, 3Aix-Marseille Univ, CNRS, CRMBM, Marseille, France
Synopsis
- The proposed method allows a comprehensive relaxation times estimation (T1, T2, T2*) on MRgRT systems.
- The methodology was validated on phantom and volunteer for accuracy and reproducibility.
- For T1 and T2, less than 5 % coefficient of variation was observed and less than 10 % for the T2*.
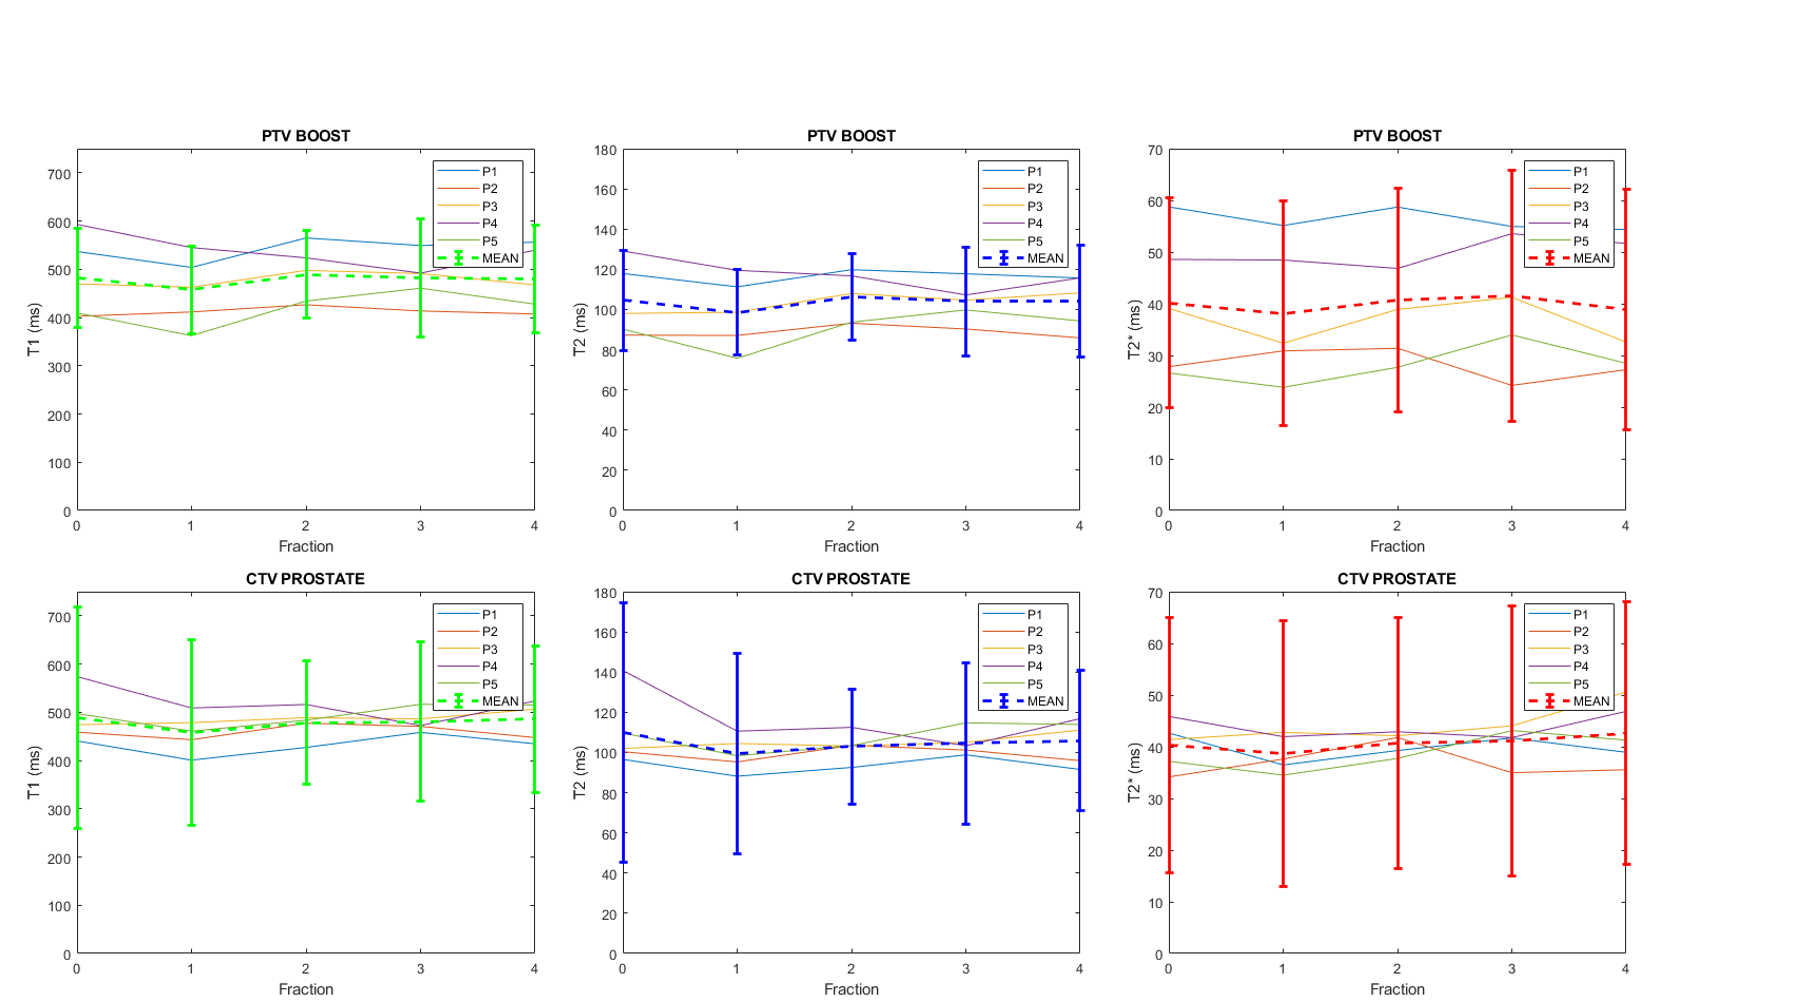
- Trends on 5 patients show a slight decrease and a recovery for the T1 and T2 values in both the boost and whole prostate during their treatment.
- The dispersion of T1 and T2 decreased for all patients for the whole prostate whereas it was stable for the boost.
Introduction
Recently, an increasing number of Magnetic Resonance guided Radiation Therapy (MRgRT) combined systems are deployed. Although multiparametric quantitative MRI (qMRI) has emerged as an important field in MRI, it remains poorly explored in MRgRT. On the MRIdian 0.35 T system, two pilot studies were carried out1,2, one being a comprehensive qMRI on the brain and the second being a fingerprinting method validation on volunteers. One key motivation is to discover an early MR biomarker that helps the prognostic of tumor control. To this same purpose, the proposed method in this study allows a comprehensive relaxation times estimation (T1, T2, T2*) as well as the proton density fat fraction (PDFF) of the tissues. The methodology was validated on phantom and volunteer. Afterward, the first results on patients at each radiation delivery of their stereotactic prostate treatment have been highlighted.Methods
All acquisitions were performed on a 0.35 T MR-Linac system (MRIdian, Viewray, Paolo Alto, CA, USA)3. The images were acquired with the vendor-provided 12-channels body coil array. The imaging protocol included two 3D multi-echoes SPGR sequences; TR/TEs=13/{1.9, 5.6, 9.4} ms, FAs=8° and 25°, BW=299 Hz/Px, TA=3:38 minutes; and two 3D bSSFP sequences; TR/TE=2.3/1 ms, FAs= 30° and 90°, BW=1196 Hz/Px, TA=30s each. All sequences were in axial native view with the same FOV and a 2x2x3 mm3 resolution for a total acquisition time of 8:16 minutes.Dicom images were imported in Matlab for qMRI processing. The two 1st echo volumes from the SPGR acquisitions were combined to map longitudinal relaxation times T1 according to the variable flip angle framework4. The same images also served to compute a proton density map, albeit with fluids attenuated (bladder) from inherent SPGR intravoxel dephasing. Next, the two bSSFP volumes were combined, and the T1 values from the previous step were included in the calculation of transversal relaxation times T2 according to the DESPOT2 framework5. Finally, the high flip angle SPGR complex values volumes were processed for proton density fat fraction (PDFF) and transverse relaxation time constant (T2*) values using open-source PRESCO (Phase Regularized Estimation using Smoothing and Constrained Optimization) algorithm6.
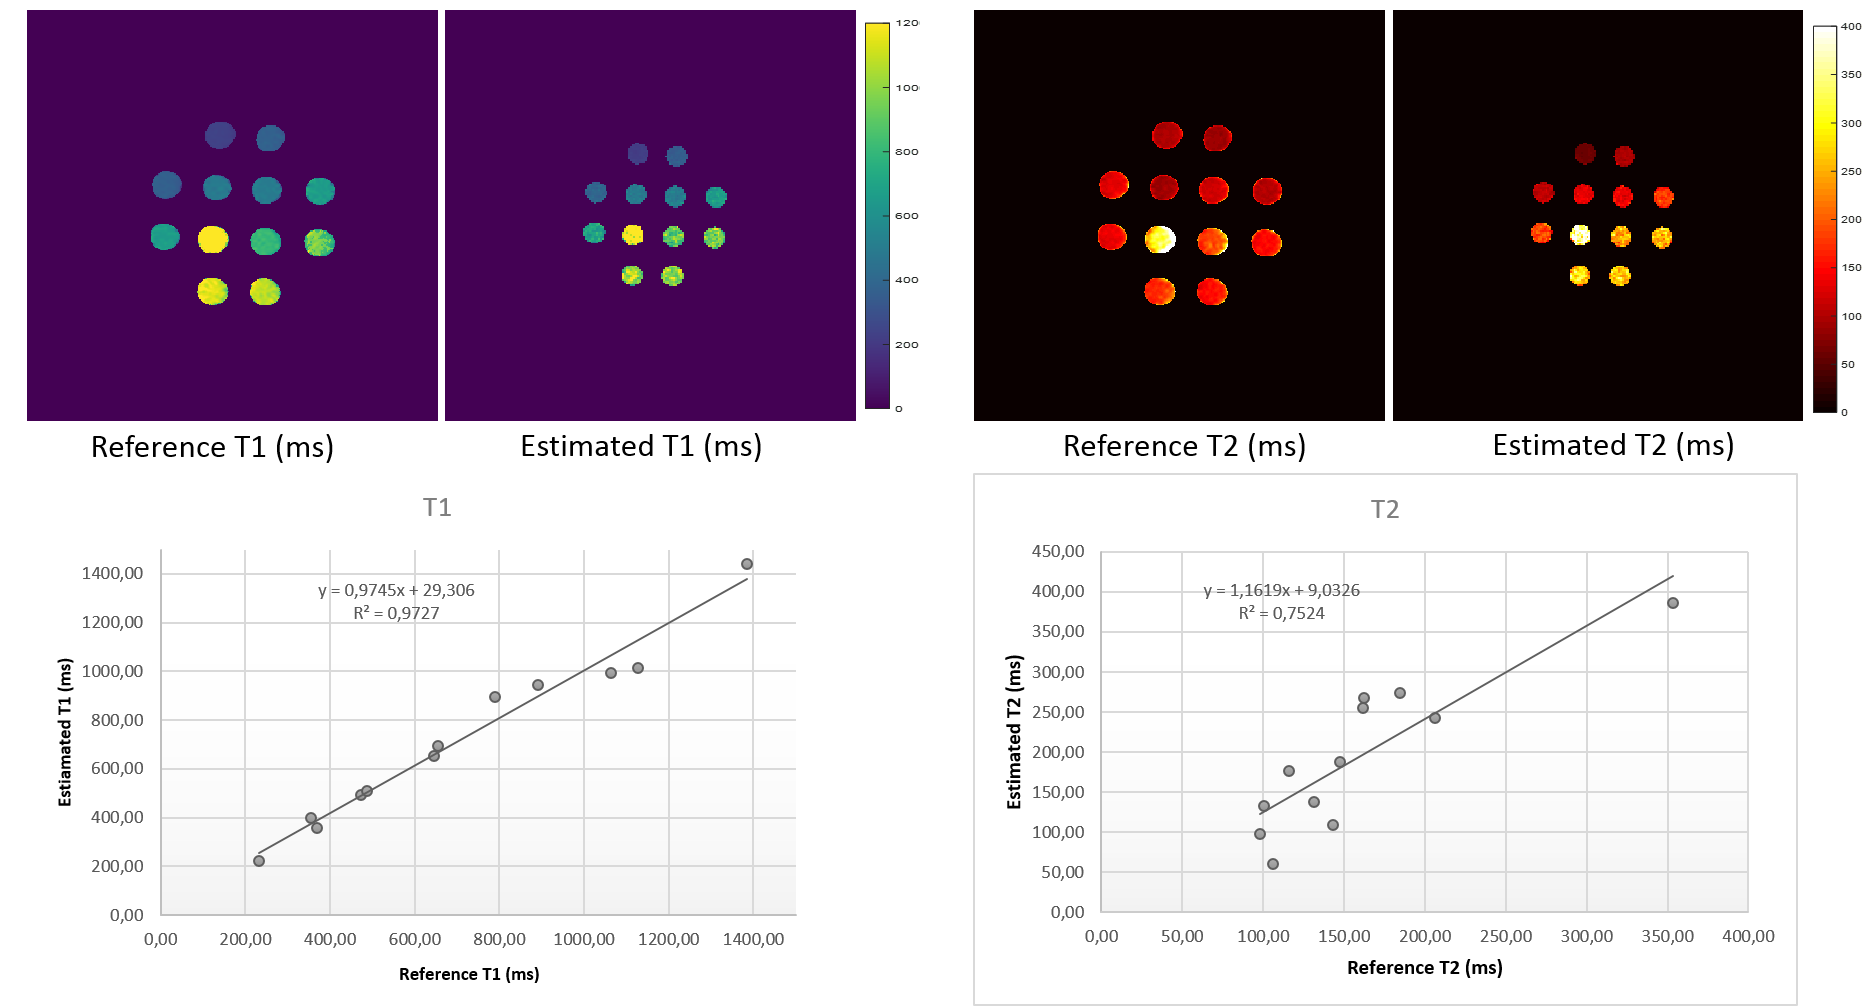
The qMRI protocol was validated in a calibrated phantom containing twelve doped-Agarose vials mixed with varying concentrations of Gadolinium. For reference, a single-slice T1 and T2 maps were acquired with spin-echo echo-planar imaging (IR-SE-EPI) with multiple inversion times and multiple echo times. Mono-exponential equations from the signal model were fitted with a least-square algorithm on a pixelwise basis to quantify reference T1 and T2. All subjects were recruited after obtaining informed consent. The repeatability study has been performed on a single 36-years-old male healthy volunteer scanned 6 times in a row, with full repositioning after each session. Five patients underwent the qMRI protocol during their pre-treatment simulation and after each fraction of the stereotactic prostate treatment (~10 Gy/Fraction, 4 fractions). Experts manually segmented regions of interest (prostate and lesion boost) for volume of interest (VOI) analysis.
Results
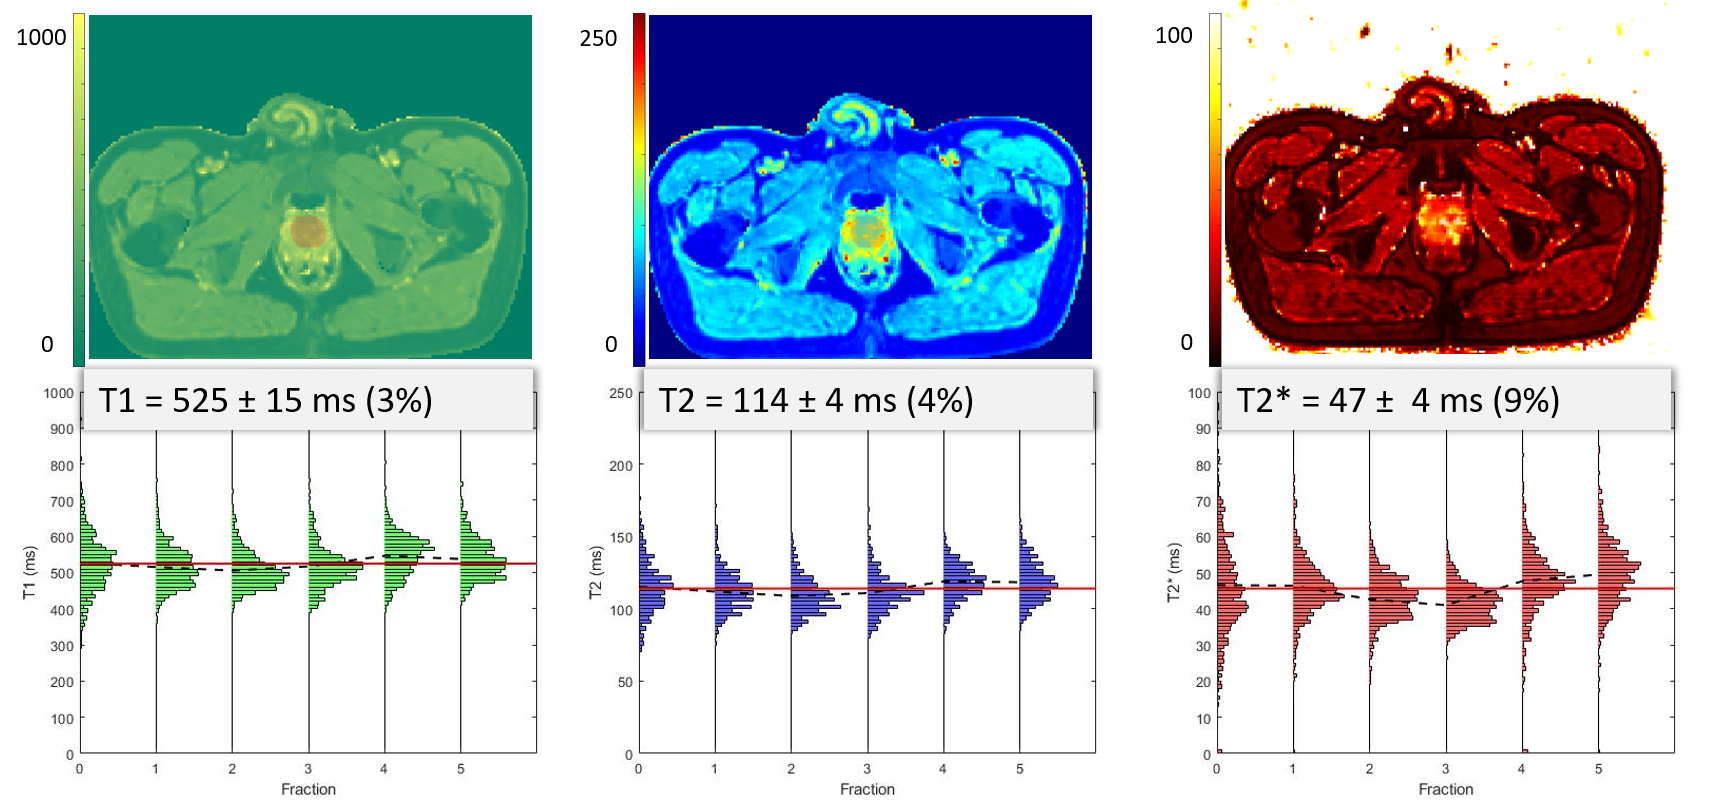
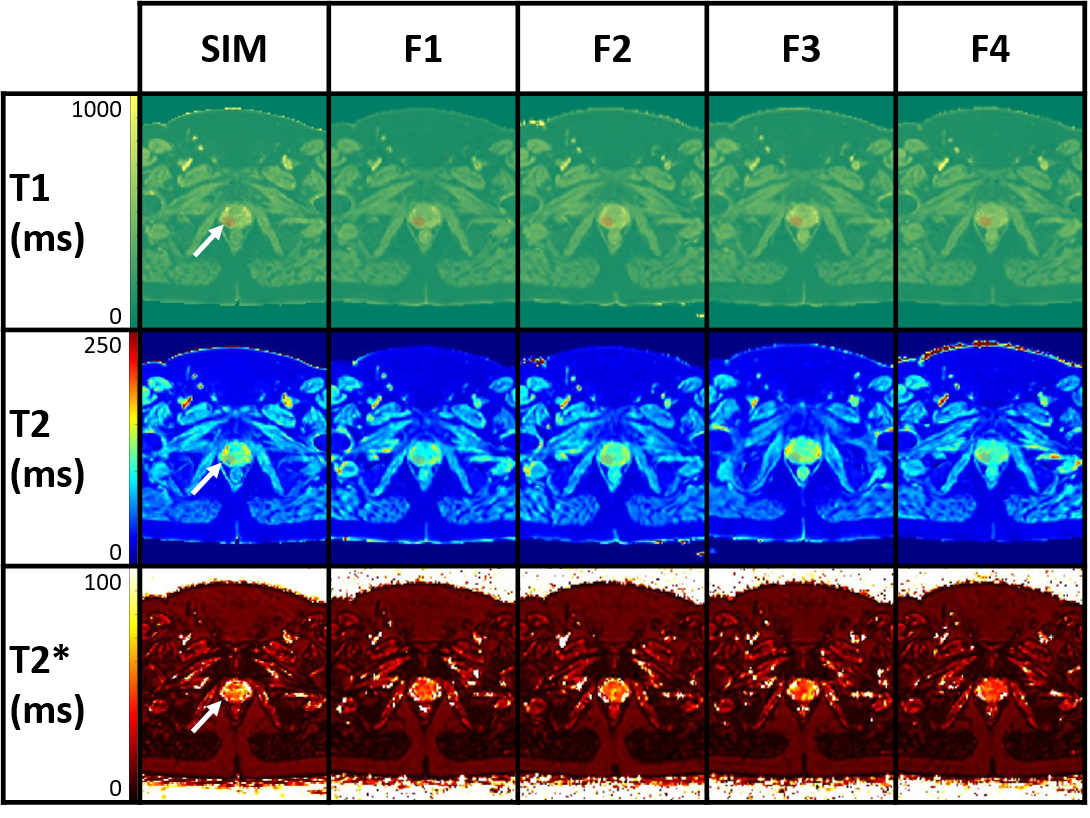
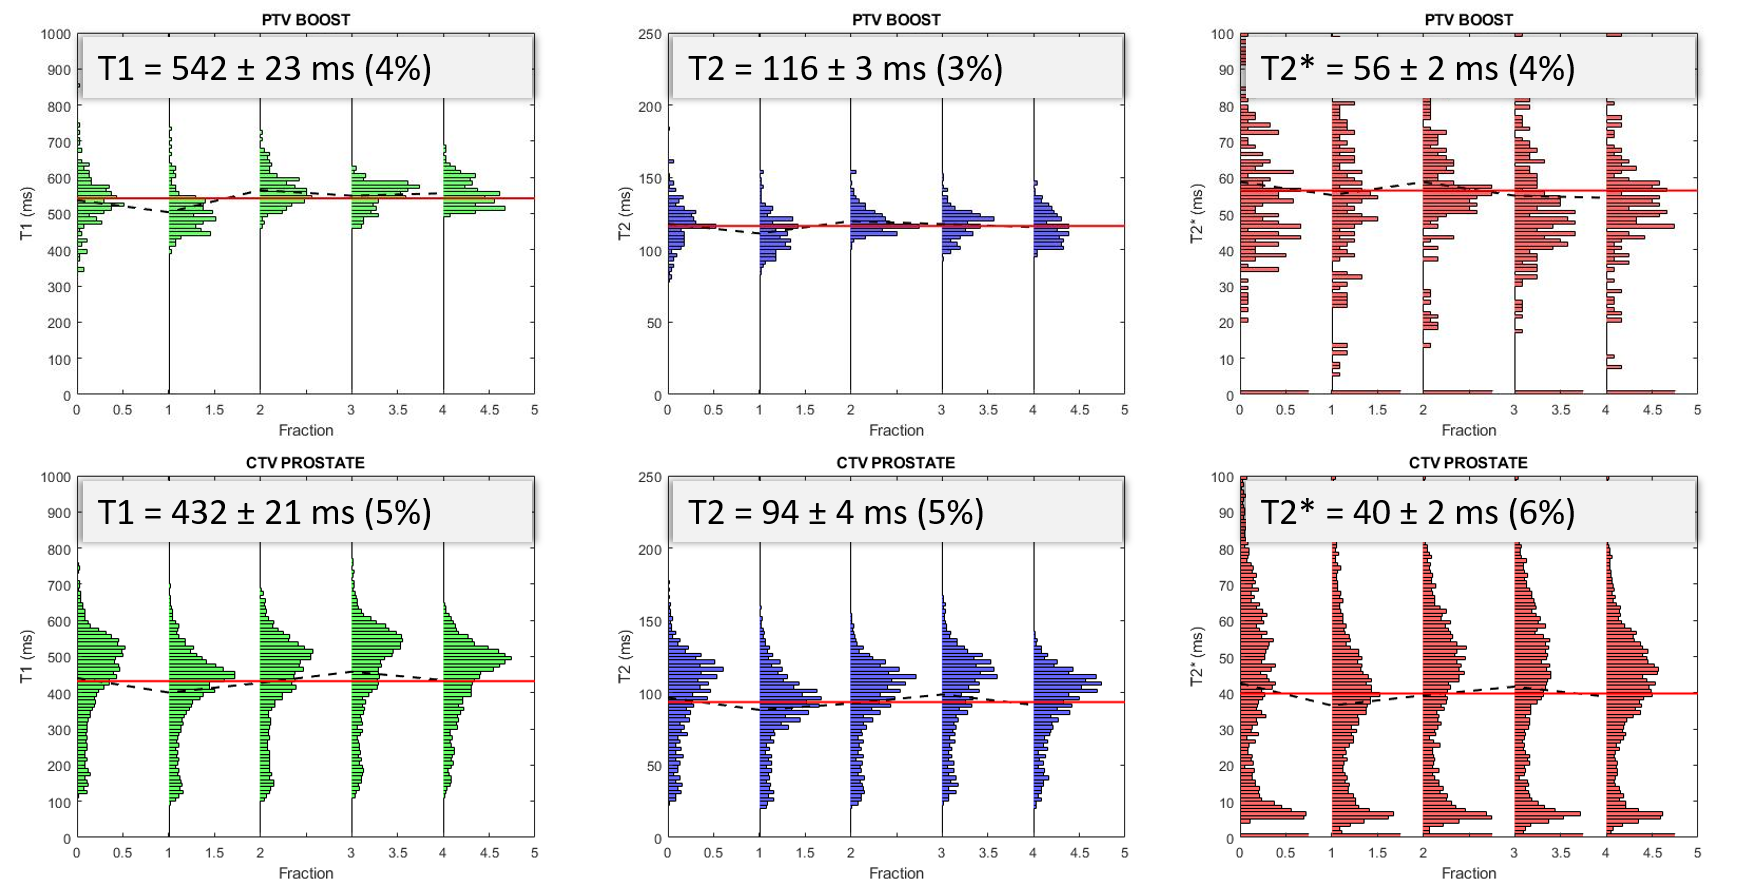
The T1 and T2 quantification proved highly correlated with reference values in the phantom (Fig.1, R2= 0.97 and 0.75 respectively). T2 values were more dispersed than T1. The Fig.2 shows the histograms of the quantitative maps of the repeatability study on the volunteer with the VOI taken in the center of the prostate. For T1 and T2 reproducibility, a less than 5% coefficient of variation (CV) was observed and less than 10% for the T2*. A good reliability was observed in a patient follow up qMRI maps in Fig.3, in accordance with the histograms showed in Fig.4. Following patients throughout their treatment fractions, the structure of the prostate seemed to evolve. Trends on all patients tend to show a slight decrease after the first fraction, followed by a recovery for the T1 and T2 values in both the boost and whole prostate (Fig.5). In accordance with the Fig.3, the dispersion of the T1 and the T2 decreased for all patients across time for the whole prostate whereas it was stable for the boost.Discussion
A fast and easily reproducible qMRI protocol was implemented, validated and carried out at 0.35 T. The investigations on phantom and on volunteer showed respectively a good accuracy and a good reliability. The relaxometry values on volunteer pelvis were coherent with other qMRI method2. Due to the small number of patients, no sensitive variation of relaxation times has been demonstrated although some preliminary trends warrant further investigations. This corroborates results from another study about normo-fractionated treatments in brain1. The qMRI results at two months after treatment would also complete this investigation. This is an ongoing study.The limitations of this method are 1/ it is a multiple sequences protocol, 2/ the phase singularities observed in this MRI software (VB19) inquire further investigations prior of the estimation of PDFF and 3/ for tissue like the prostate with high T2* value, the T2* quantification can be challenging.
Conclusion
We provided a fast, reliable and comprehensive qMRI method suitable clinical purposes within less than 10 minutes acquisition time. This protocol allows the measurement of four biomarkers at once for instance the T1, T2, T2* relaxation times and the PDFF. It could also be applied to other regions.Acknowledgements
The authors would heartily thank the technicians involved in this study.References
1. Nejad‐Davarani SP, Zakariaei N, Chen Y, et al. Rapid multicontrast brain imaging on a 0.35T MR‐linac. Med Phys 2020; 47:4064–4076.
2. Mickevicius NJ, Kim JP, Zhao J, Morris ZS, Hurst NJ, Glide‐Hurst CK. Toward magnetic resonance fingerprinting for low‐field MR‐guided radiation therapy. Med Phys 2021:mp.15202.
3. Klüter S. Technical design and concept of a 0.35 T MR-Linac. Clinical and Translational Radiation Oncology 2019; 18:98–101.
4. Christensen KA, Grant DM, Schulman EM, Walling C. Optimal determination of relaxation times of fourier transform nuclear magnetic resonance. Determination of spin-lattice relaxation times in chemically polarized species. J Phys Chem 1974; 78:1971–1977.
5. Deoni SCL, Rutt BK, Peters TM. Rapid combinedT1 andT2 mapping using gradient recalled acquisition in the steady state. Magn Reson Med 2003; 49:515–526.
6. Bydder M, Ghodrati V, Gao Y, Robson MD, Yang Y, Hu P. Constraints in estimating the proton density fat fraction. Magnetic Resonance Imaging 2020; 66:1–8.
Figures