2211
129Xe Gas-Transfer MRI RBC-to-Barrier Ratio in Post-Acute COVID19 Syndrome: Clinically-relevant?1Department of Medical Biophysics, Robarts Research Institute, Western University, London, ON, Canada, 2Center for In Vivo Microscopy, Duke University Medical Center, Durham, NC, United States, 3Department of Physics, Ryerson University, Toronto, ON, Canada, 4Hospital for Sick Children, Toronto, ON, Canada, 5Department of Medical Biophysics, University of Toronto, Toronto, ON, Canada, 6Thunder Bay Regional Health Research Institute, Lakehead University, Thunder Bay, ON, Canada, 7Division of Respirology, Department of Medicine, McMaster University, Hamilton, ON, Canada, 8St. Joseph's Healthcare, Hamilton, ON, Canada, 9Department of Physics and Astronomy, Western University, London, ON, Canada, 10Division of Respirology, Department of Medicine, Western University, London, ON, Canada
Synopsis
Post-acute COVID19 syndrome (PACS) is an umbrella term for a syndrome of symptoms persisting at least 12 weeks post COVID19 infection. Preliminary studies in PACS patients post-hospitalization revealed abnormally low 129Xe RBC-to-barrier ratios, but the clinical relevance of this is not well-understood. We acquired 129Xe gas-transfer MRI, spirometry, diffusing-capacity-of-the-lung for carbon-monoxide (DLCO) and same-day CT in 39 participants including 30 PACS and 9 never-COVID19 controls. The 129Xe MRI RBC-to-barrier ratio was significantly related to DLCO and significantly lower in both never-hospitalized and ever-hospitalized PACS patients compared to never-COVID19 controls.
Purpose
Approximately 3-7 in 101 people with COVID19 infection will experience persistent symptoms at least 12 weeks post-infection including dyspnea, fatigue, chest-pain and impaired quality-of-life. The constellation of symptoms has been termed post-acute COVID19 syndrome (PACS)2 and recent studies have shown that the diffusing-capacity-of-the-lung for carbon-monoxide (DLCO),3 pulmonary vascular tree volume4 and other CT measurements5 are abnormal in patients with PACS. Preliminary 129Xe MRI investigations6,7 identified a reduced red-blood-cell to barrier (RBC:barrier) signal intensity ratio, suggestive of gas transfer impairment but without a strong relationship with DLCO. These pilot studies focused on small groups (n=9; n=13) of hospitalized patients, which is notable because many PACS patients did not experience severe infection and hypoxia requiring hospitalization. Hence, we asked the question: Does PACS in ever-hospitalized patients differ from those who did not require hospitalization? We hypothesized that the 129Xe MRI RBC:barrier ratio would significantly differ in ever-hospitalized as compared to never-hospitalized PACS and would be significantly related to DLCO, CT airway and vessel measures.Methods
Participants:Participants with a confirmed positive COVID19 test and who were followed for long-term COVID symptoms, provided written informed consent to a baseline visit at 12 weeks post-infection consisting of 129Xe MRI, spirometry, DLCO, thoracic low-dose CT, and again 6- and 12-months post-baseline. A never-COVID19 control group who had never experienced COVID19 infection nor any acute or chronic cardiopulmonary disease during the period January 2020-January 2021 also provided written informed consent to the same examinations.
Data Acquisition:
MRI was acquired using a whole-body 3.0T Discovery MR750 system (General Electric Healthcare, USA) with broadband imaging capabilities and a flexible vest transmit-receive coil (Clinical MR Solutions, USA). 129Xe MR spectroscopy was acquired following inhalation breath-hold of a 1.0L gas mixture (4/1 by volume 4He/129Xe) from functional residual capacity (FRC) using a free-induction-decay whole-lung spectroscopy sequence (200 dissolved-phase spectra, TR=15ms, TE=0.7ms, flip=40°, BW=31.25kHz, 600μs 3-lobe Shinnar-Le Roux pulse). Spectroscopy was used to determine the echo time for a 90° barrier/RBC phase difference (TE90). 129Xe MRI was performed following inhalation of a 1.0L gas mixture (1/1 by volume 4He/129Xe) using an interleaved gas/dissolved-phase 3D radial sequence (TR=15ms TE=variable, flip=0.5°/40°, FOV=40cm3, matrix=72x72x72, BW=62.5kHz, 990 gas/dissolved projections, 600μs 3-lobe Shinnar-Le Roux pulse, frequency shift=7.664kHz). CT images were acquired in a subset (n=22) of participants using a 64 slice LightSpeed VCT system (General Electric Healthcare) during inspiration breath-hold of 1.0L of N2 gas from FRC (64x0.625 collimation, 100mA, tube rotation time 500ms, pitch 1.25, standard reconstruction kernel, 1.25mm slice thickness). Post-bronchodilator (4x 100μg Salbutamol Sulfate (Ivax Pharmaceuticals, Ireland)) pulmonary function tests were performed using an EasyOne Pro Lab gas analyzer (NDD Medizintechnik AG, Switzerland) according to American Thoracic Society guidelines.8,9
Data Analysis:
MRS peaks were fit to three complex Lorentzian distributions to determine compartment frequency and area under the curve (AUC). RBC:barrier ratio was calculated as the ratio of RBC AUC to barrier AUC. MRI reconstruction was performed by regridding radial k-space data to a cartesian representation (kernel sharpness=0.32, overgridding=3).10 Receiver phase-offset and local phase inhomogeneity were corrected as previously described.11 Ventilation defect percent (VDP) was calculated as previously described.12 Quantitative CT analysis was performed using VIDAvision (VIDA Diagnostics Inc., USA) to determine CT percent-of-vessels-with-radius <1 voxel (PV1) and CT airway wall area % (WA%). Inter-group differences were determined using ANOVA with post-hoc Student’s t-tests. Relationships were determined using Spearman correlation coefficients.
Results
We enrolled 30 PACS participants (53±15 years, 14M/16F) and nine never-COVID19 controls (41±16 years, 5M/4F). As shown in Table 1, there were significant differences for age (p=.04) between control and PACS participants but no other pulmonary function differences. Figures 1 and 2 show that ever-hospitalized PACS participants had lower RBC:barrier ratio (p=.01) and RBC AUC (p=.002) than never-COVID19 controls. Never-hospitalized PACS participants reported a significantly diminished RBC:barrier ratio (p=.047) compared to controls. Figure 3 shows 129Xe MRI evidence of ventilation patchiness and heterogeneity but qualitatively homogenous barrier and RBC images. Figure 4 shows that the RBC:barrier ratio strongly correlated with DLCO (ρ=.72, p=.008) and trended toward a significant relationship with CT PV1 in ever-hospitalized (p=.08) but not never-hospitalized participants.Discussion
In contrast with our findings, previous work in a smaller group of ever-hospitalized PACS patients did not show a significant relationship between RBC:barrier ratio and DLCO, albeit in a narrow range of DLCO values.7 Given the significant differences in RBC:barrier ratio but not DLCO between controls and PACS participants, 129Xe RBC:barrier may be more sensitive to alveolar-level gas transfer abnormalities. We observed significant differences between RBC AUC in ever-hospitalized participants and controls, but not for barrier AUC, suggesting that vascular abnormalities may dominate abnormal gas exchange observed here. Prior comparisons between MR and CT measures post-COVID noted near-normal observer CT-scores. We report no significant differences between quantitative CT measures of airway or vessel structure, but an unexpected relationship between RBC:barrier and PV1 in hospitalized participants which may hint at pulmonary blood distribution abnormalities post-COVID.Conclusions
The 129Xe MRI RBC:barrier ratio and RBC AUC were abnormal in ever-hospitalized PACS patients whilst 129Xe MRI RBC:barrier ratio correlated with DLCO. Together, these findings suggest that RBC:barrier ratio points to gas-transfer abnormalities that stem from the small pulmonary vessels that remain abnormal post-COVID19 infection.Acknowledgements
We would like to acknowledge the support of the Government of Ontario Ministry of Health for grant funding for the LiveCovidFree study.References
1 Nasserie, T., Hittle, M. & Goodman, S. N. JAMA Network Open (2021).
2 Nalbandian, A. et al. Nature Medicine (2021).
3 Mendez, R. et al. Ann Am Thorac Soc (2021).
4 Lins, M. et al. Acad Radiol (2020).
5 Han, X. et al. Radiology (2021).
6 Li, H. et al. Sci Adv (2021).
7 Grist, J. T. et al. Radiology (2021).
8 Graham, B. L. et al. Eur Respir J (2017).
9 Graham, B. L. et al. Am J Respir Crit Care Med (2019).
10 Robertson, S. H. et al. Concepts in Magnetic Resonance Part A (2015).
11 Kaushik, S. S. et al. Magn Reson Med (2016).
12 Kirby, M. et al. Acad Radiol (2012).
Figures
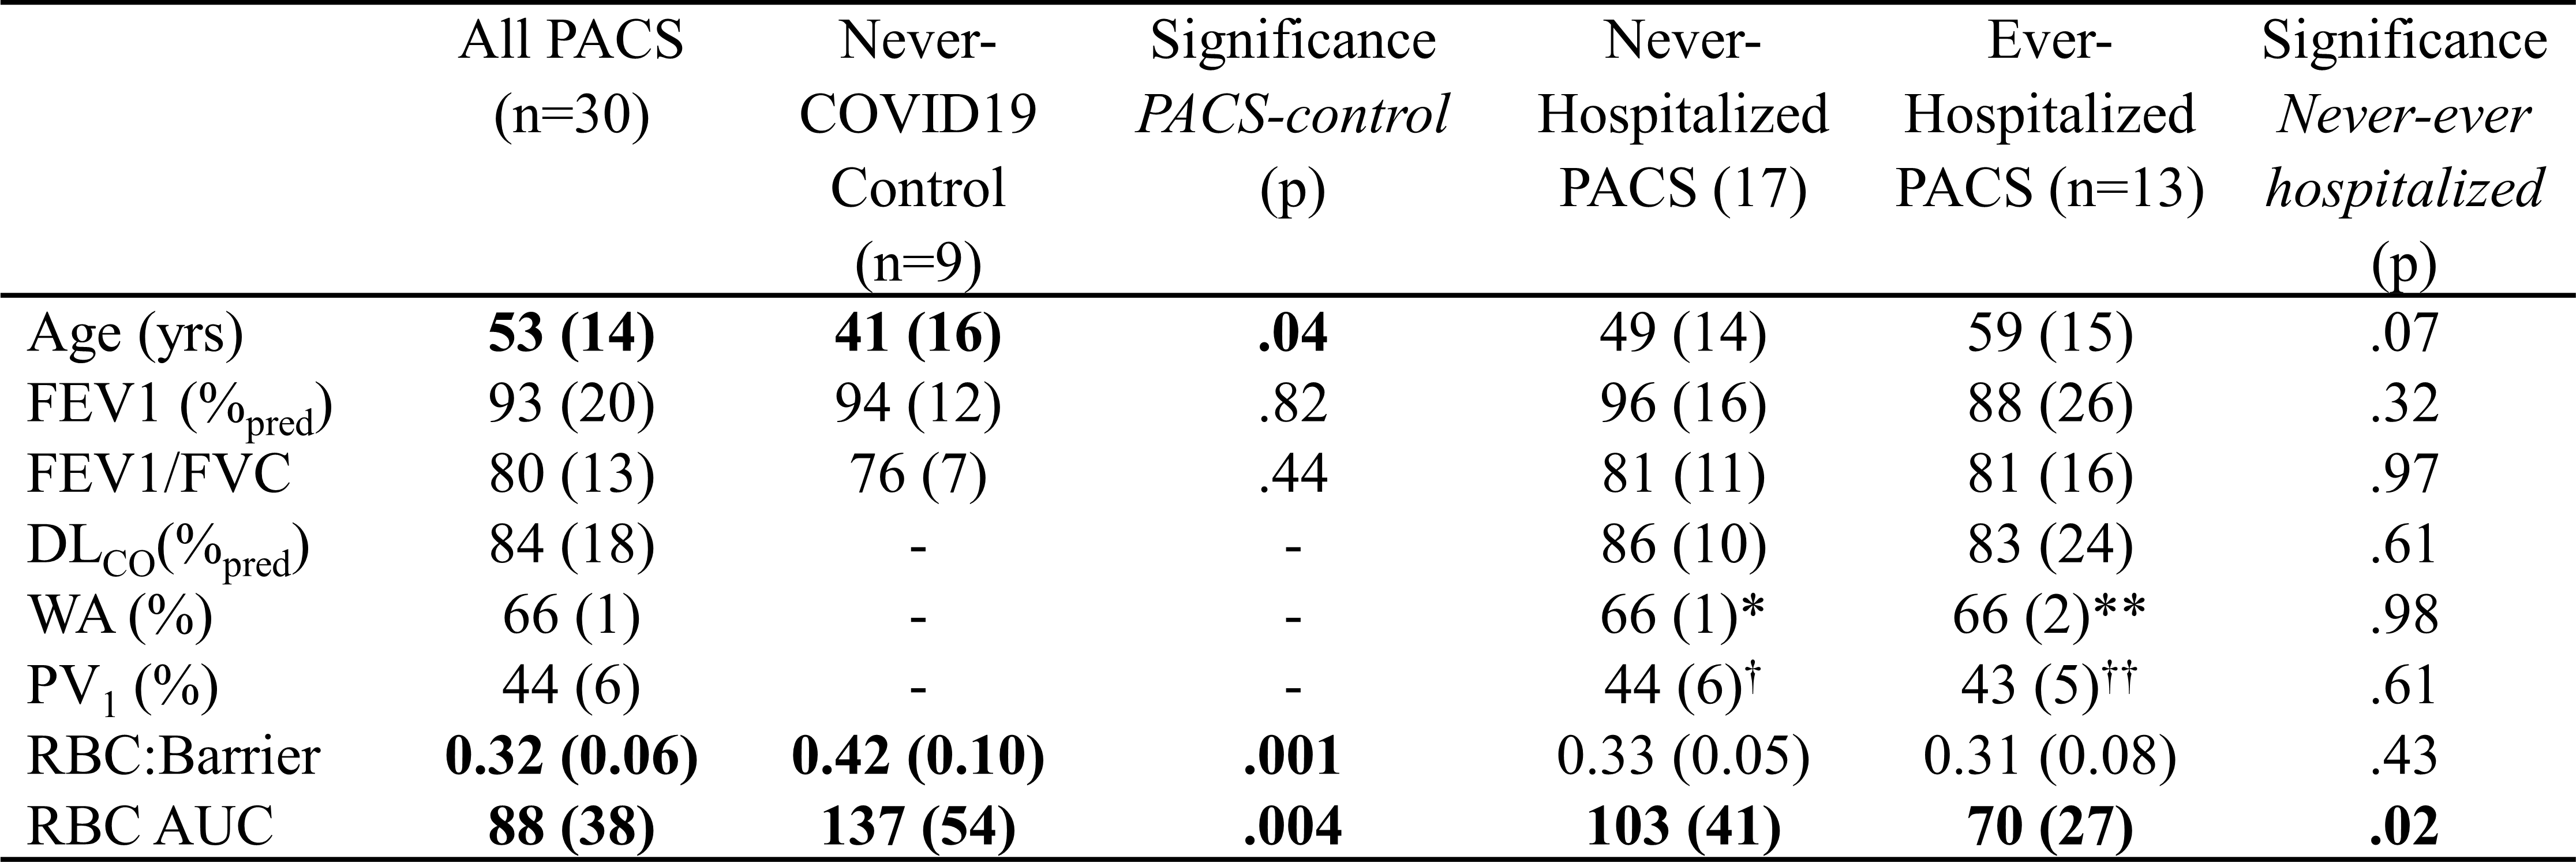
Table 1. Demographics of never-COVID19 participants and PACS participants separated by hospitalization status. *n=11 **n=7 †n=14 ††n=8
BMI=body mass index; FEV1=forced expiratory volume in 1 second; FVC=forced vital capacity; DLCO=diffusing capacity of the lung for carbon monoxide; WA=wall area; PV1=percent of vessels with radius<1 voxel; RBC=red blood cell; AUC=area under the spectroscopy curve
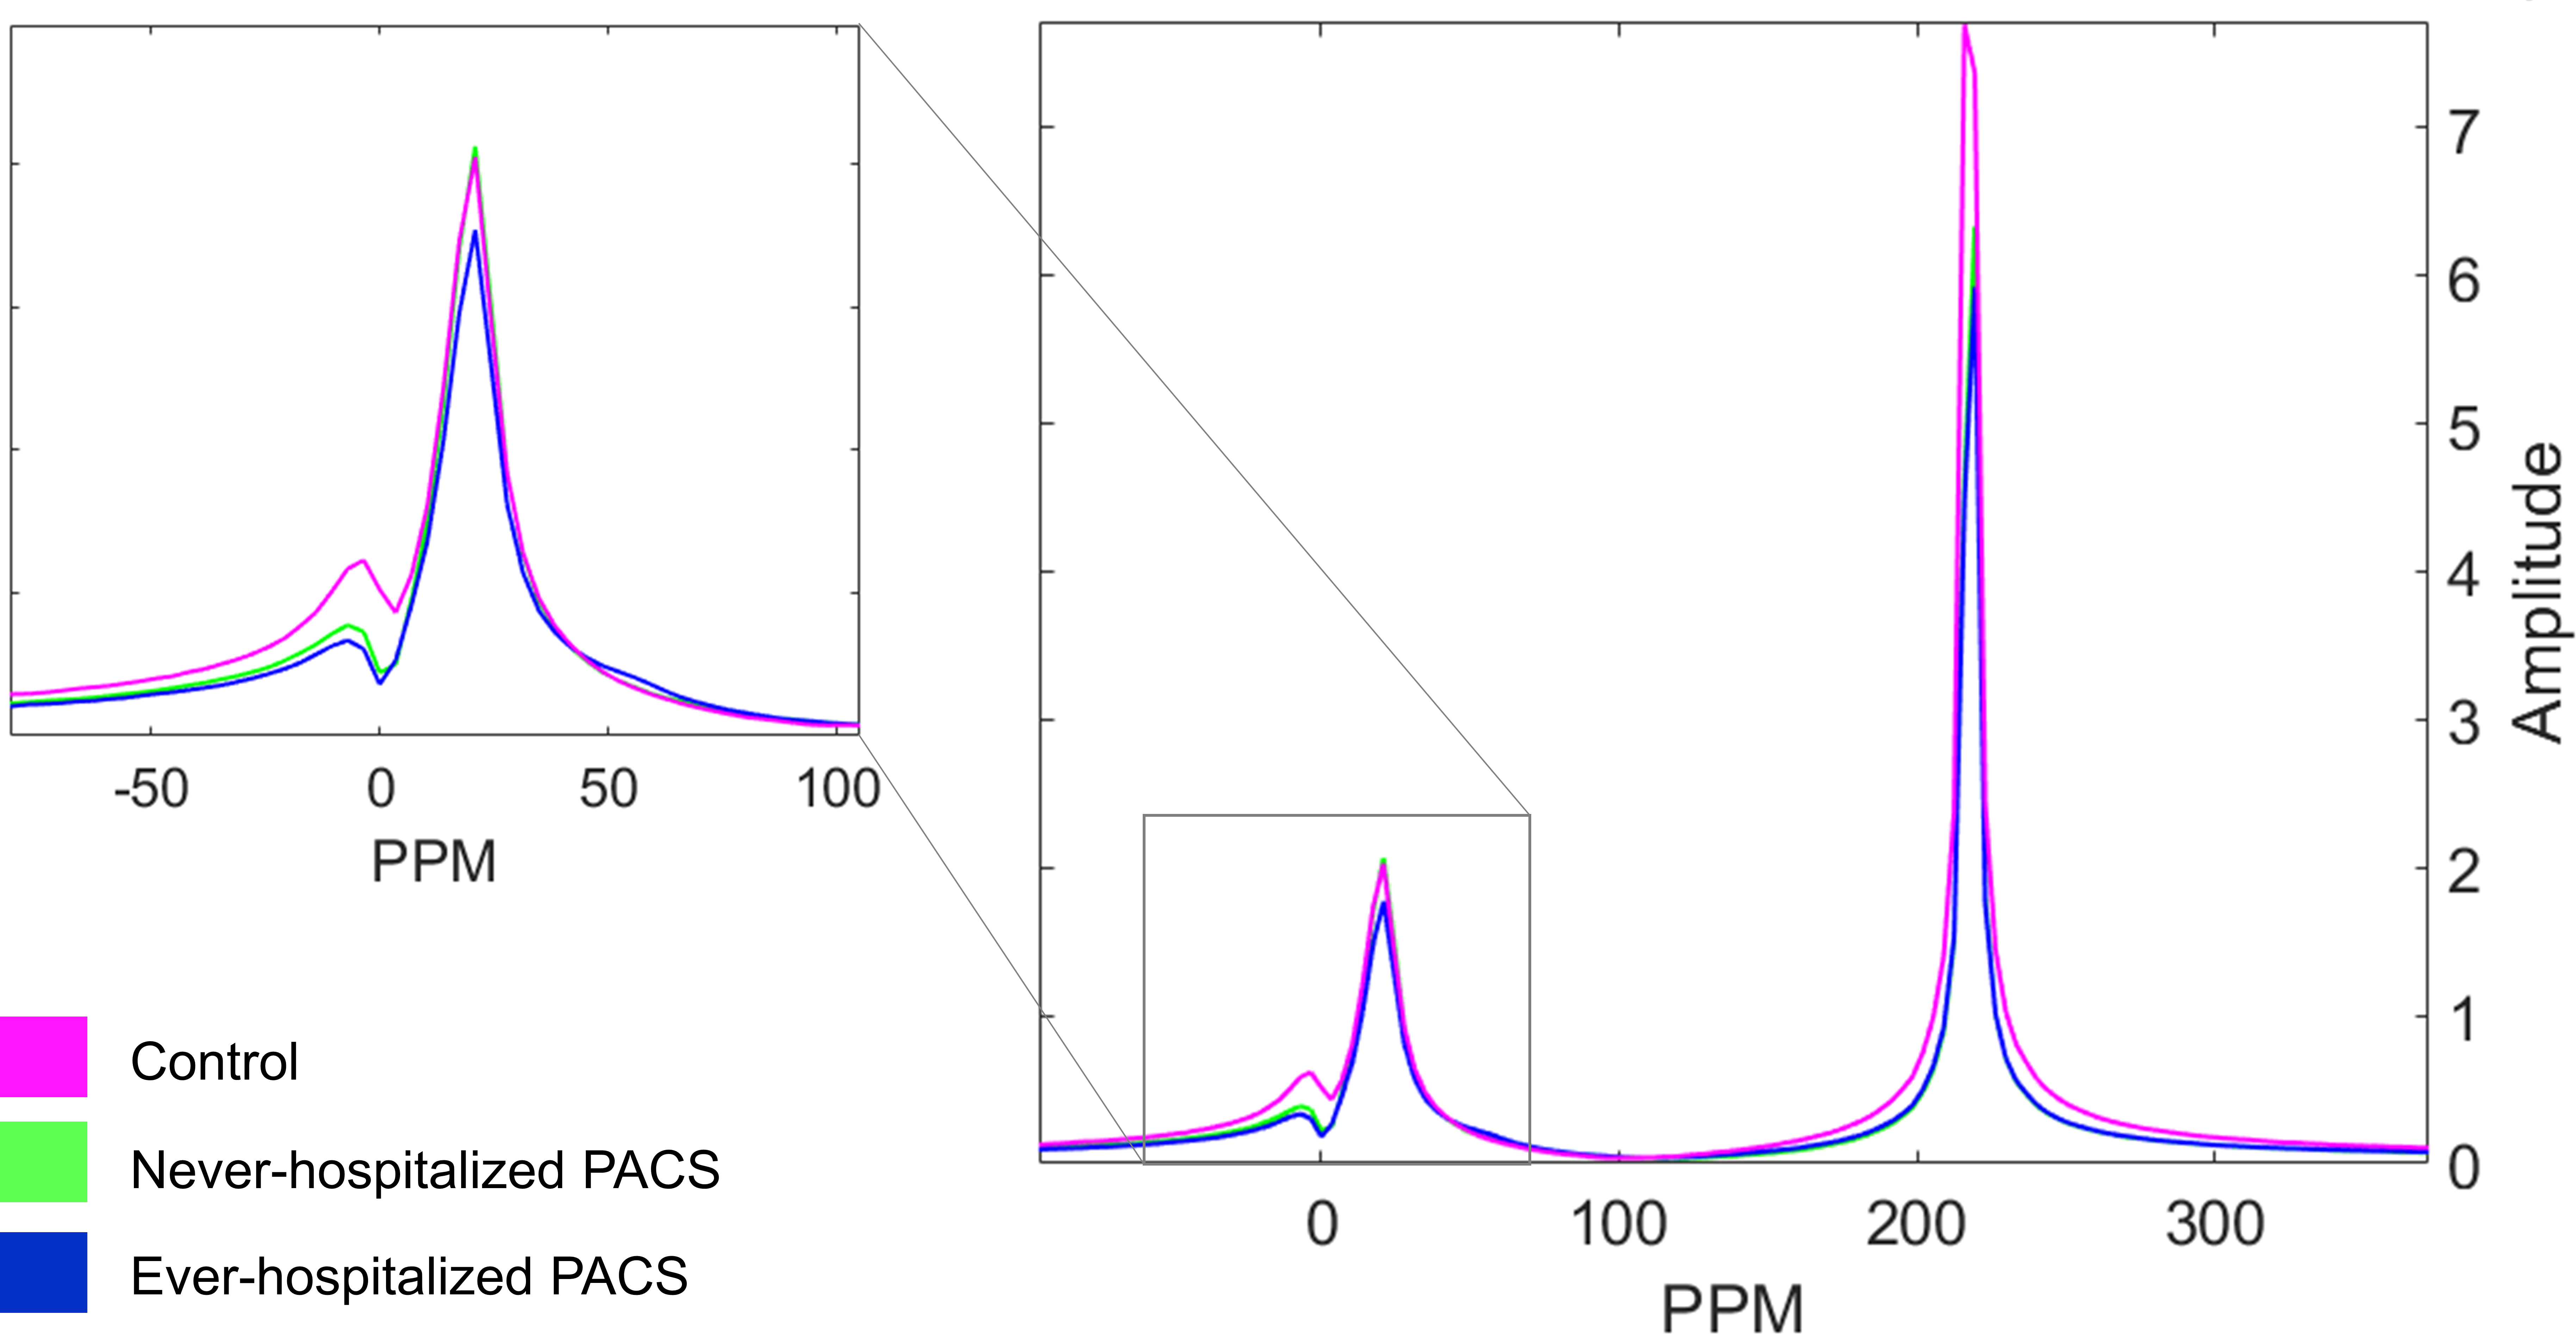
Figure 1. Magnetic resonance spectroscopy in never-COVID19 controls, non-hospitalized PACS participants and hospitalized PACS participants. Spectra are averaged over all individuals in each group. While both hospitalized and non-hospitalized PACS participants had lower RBC AUC, only the hospitalized group was observed to be statistically different from never-COVID19 controls. As a result, the RBC:barrier ratio was significantly different between never-COVID19 controls and hospitalized PACS participants.
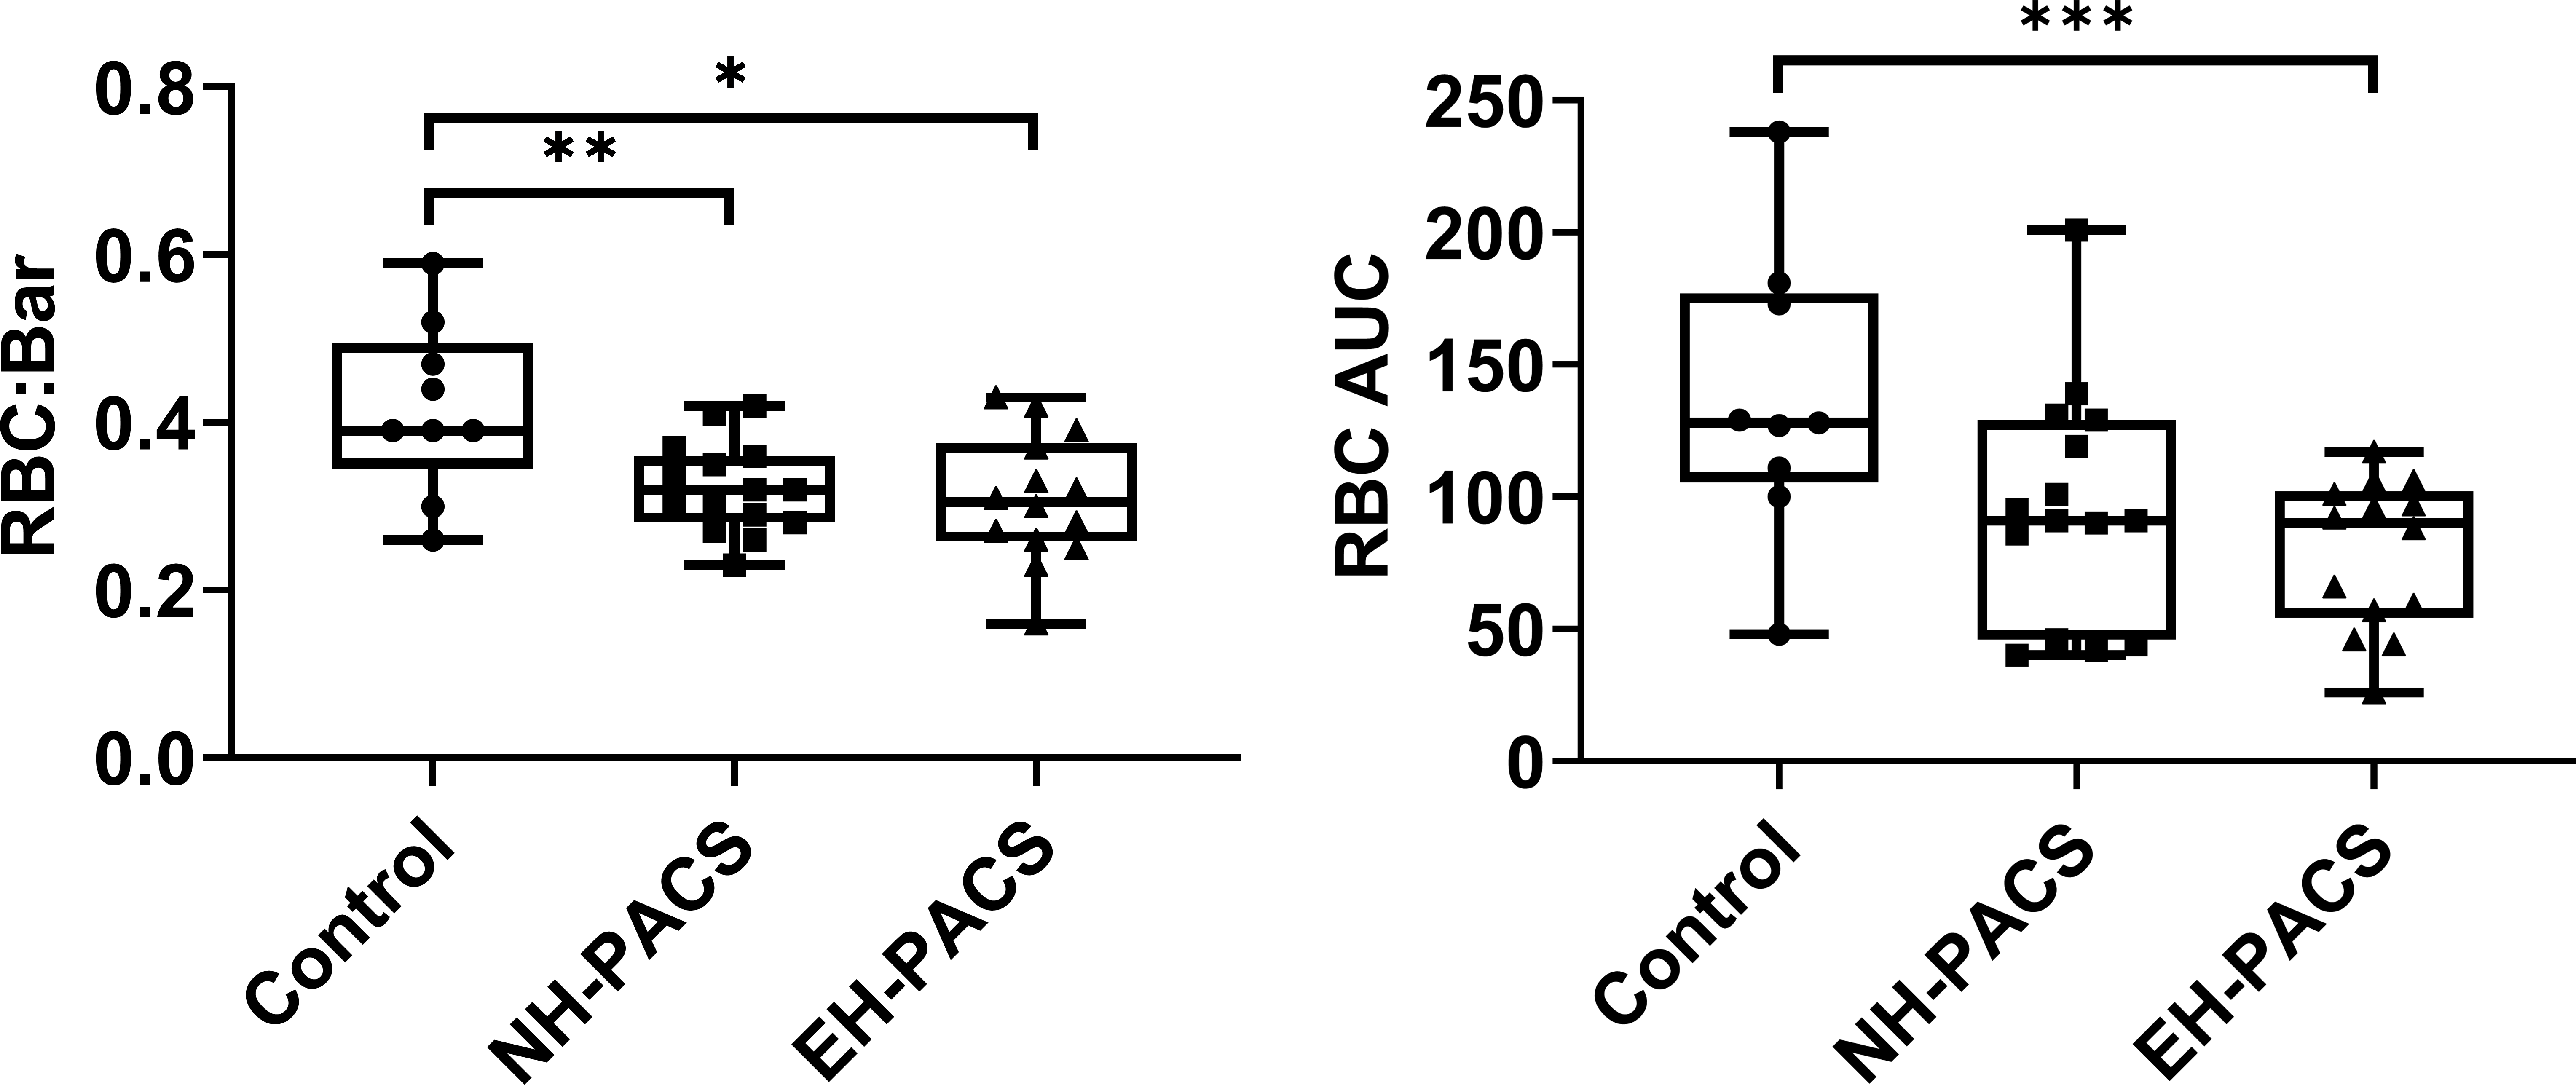
Figure 2. Intergroup differences between never-COVID controls, never-hospitalized PACS participants (NH-PACS) and ever-hospitalized participants (EH-PACS). Left: the EH-PACS group exhibited significantly lower RBC:barrier ratio, right: EH-PACS also exhibited significantly lower RBC AUC.
*p=.01; **p=.047; ***p=.002
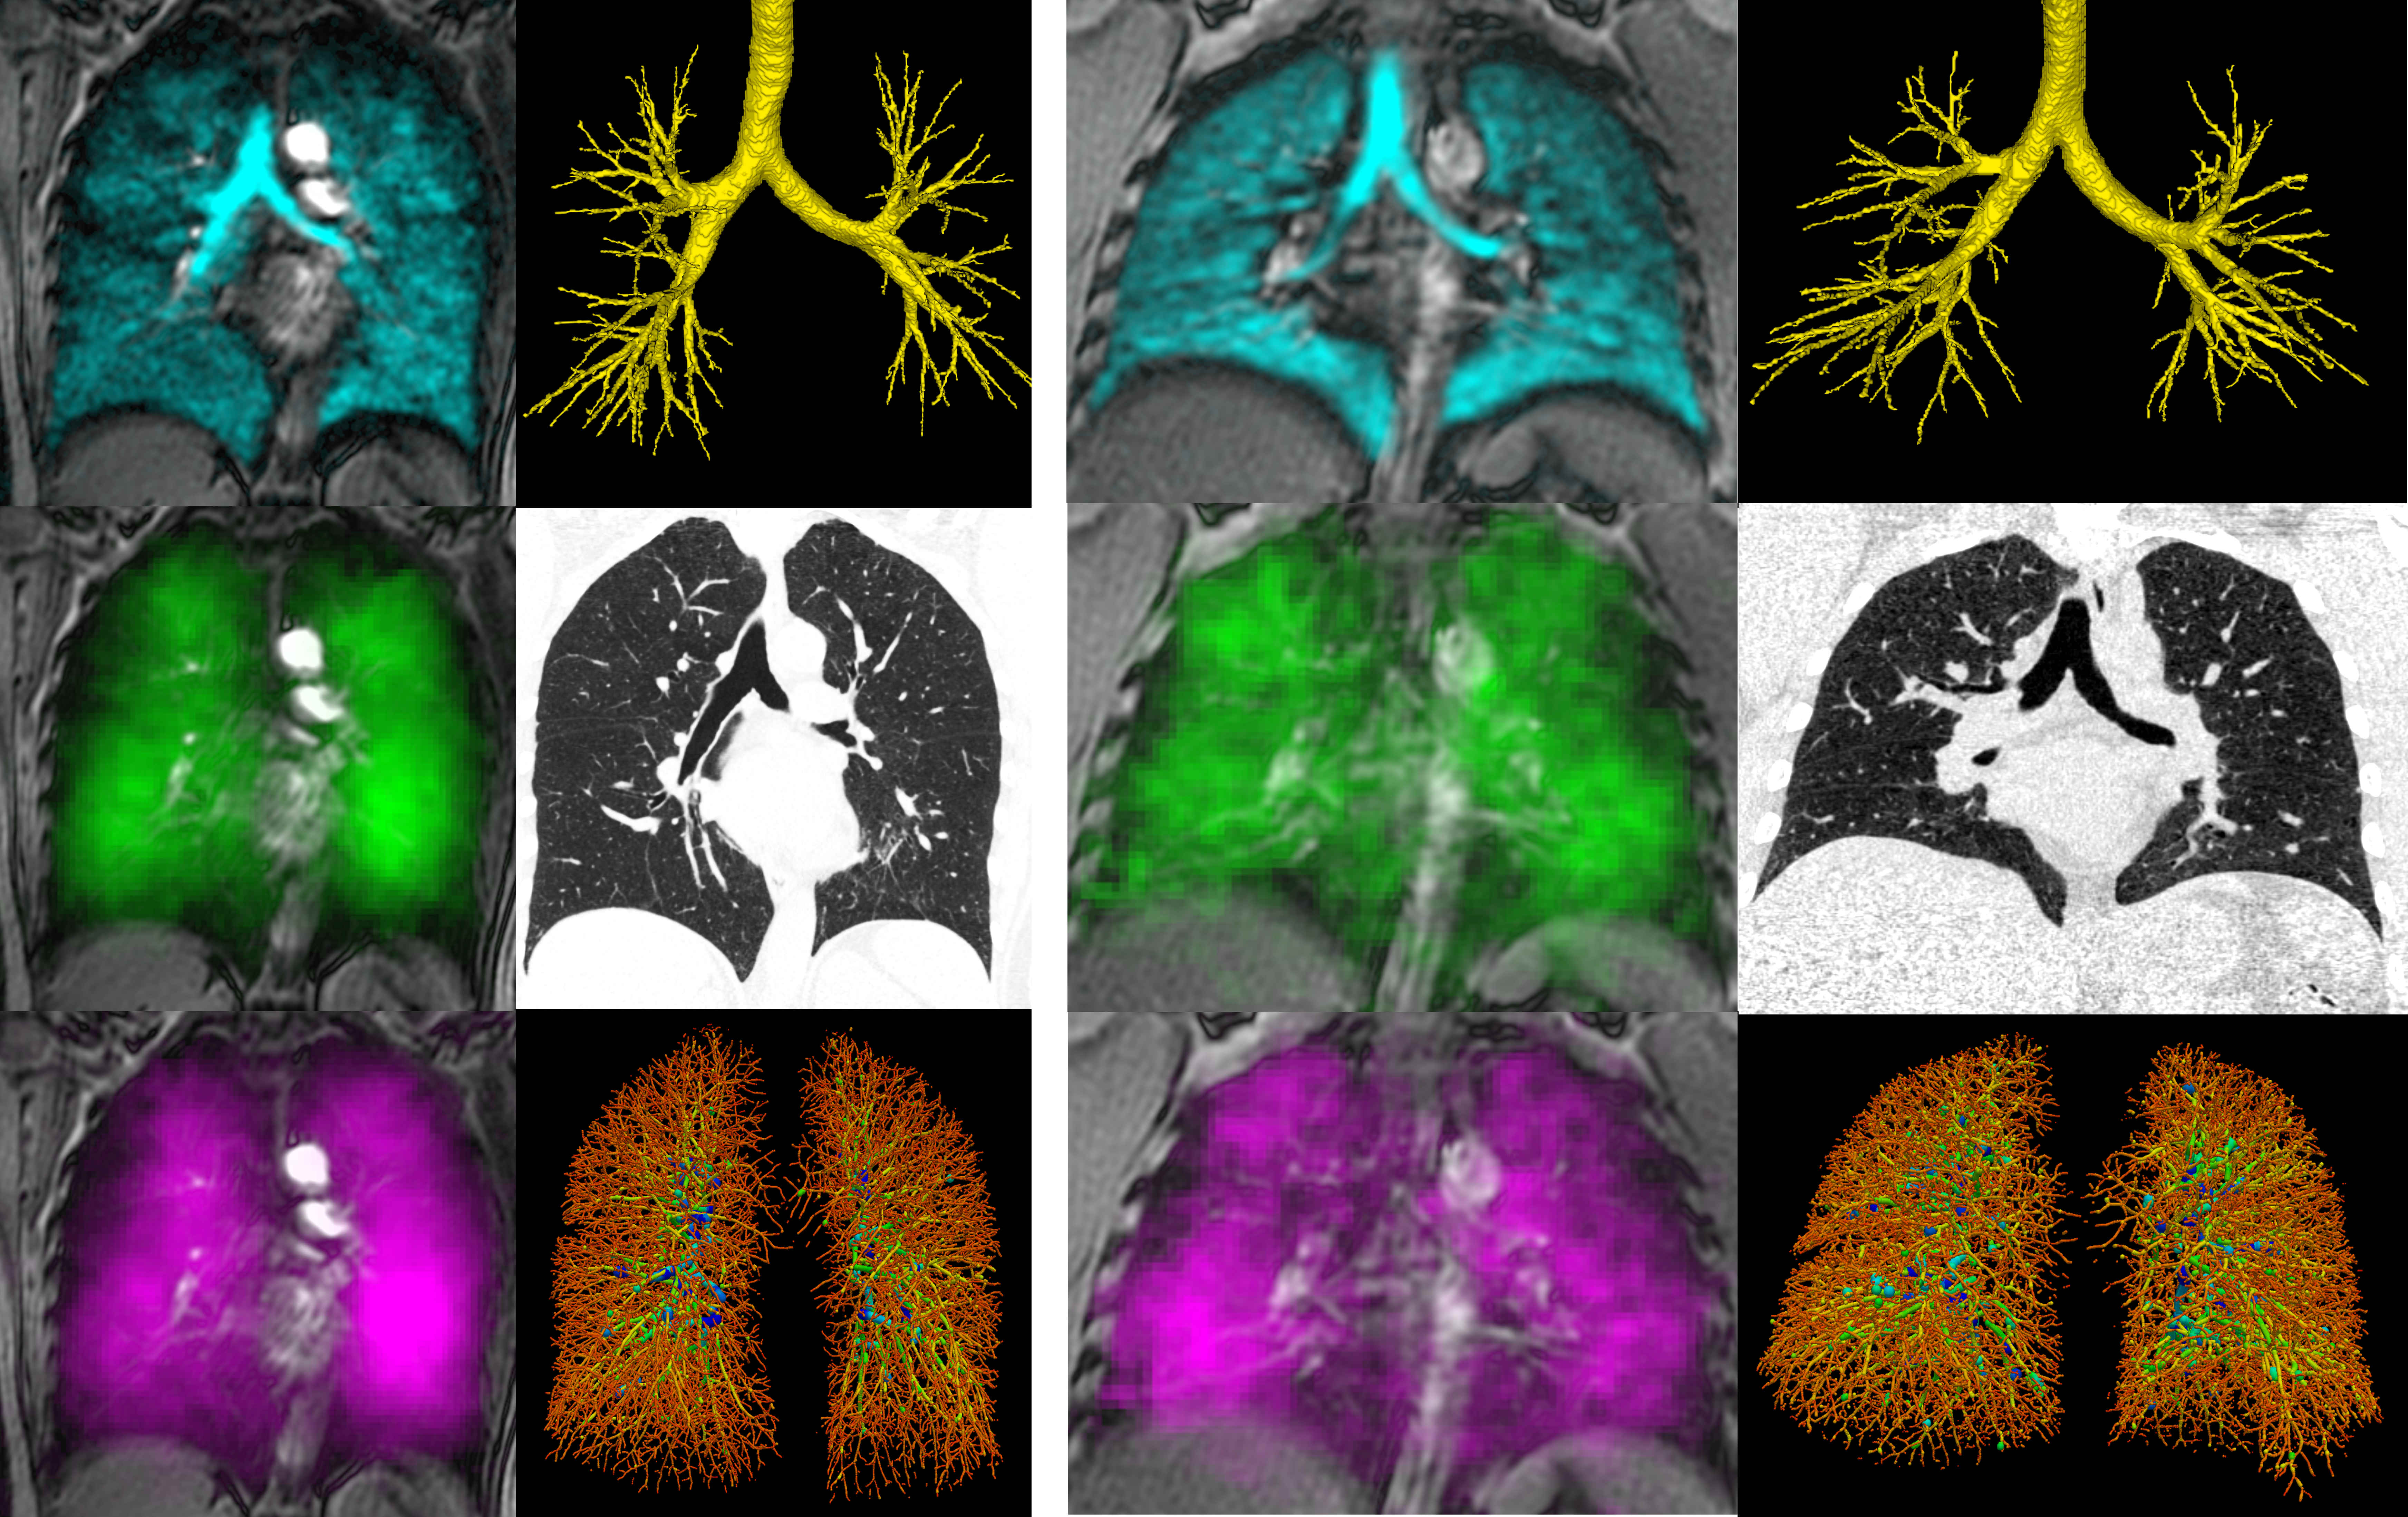
Figure 3. Images of lung structure/function acquired in a never-hospitalized (left, female, age=59 DLCO=83%pred VDP=4% PV1=46% RBC:Bar=0.26) and ever-hospitalized PACS participant (right, male, age=42 DLCO=92%pred VDP=1% PV1=34% RBC:Bar=0.33). Top left: 129Xe ventilation, top right: CT airway tree, middle left: 129Xe barrier intensity, middle right: CT tissue attenuation, bottom left: 129Xe RBC intensity, bottom right: CT vascular tree.
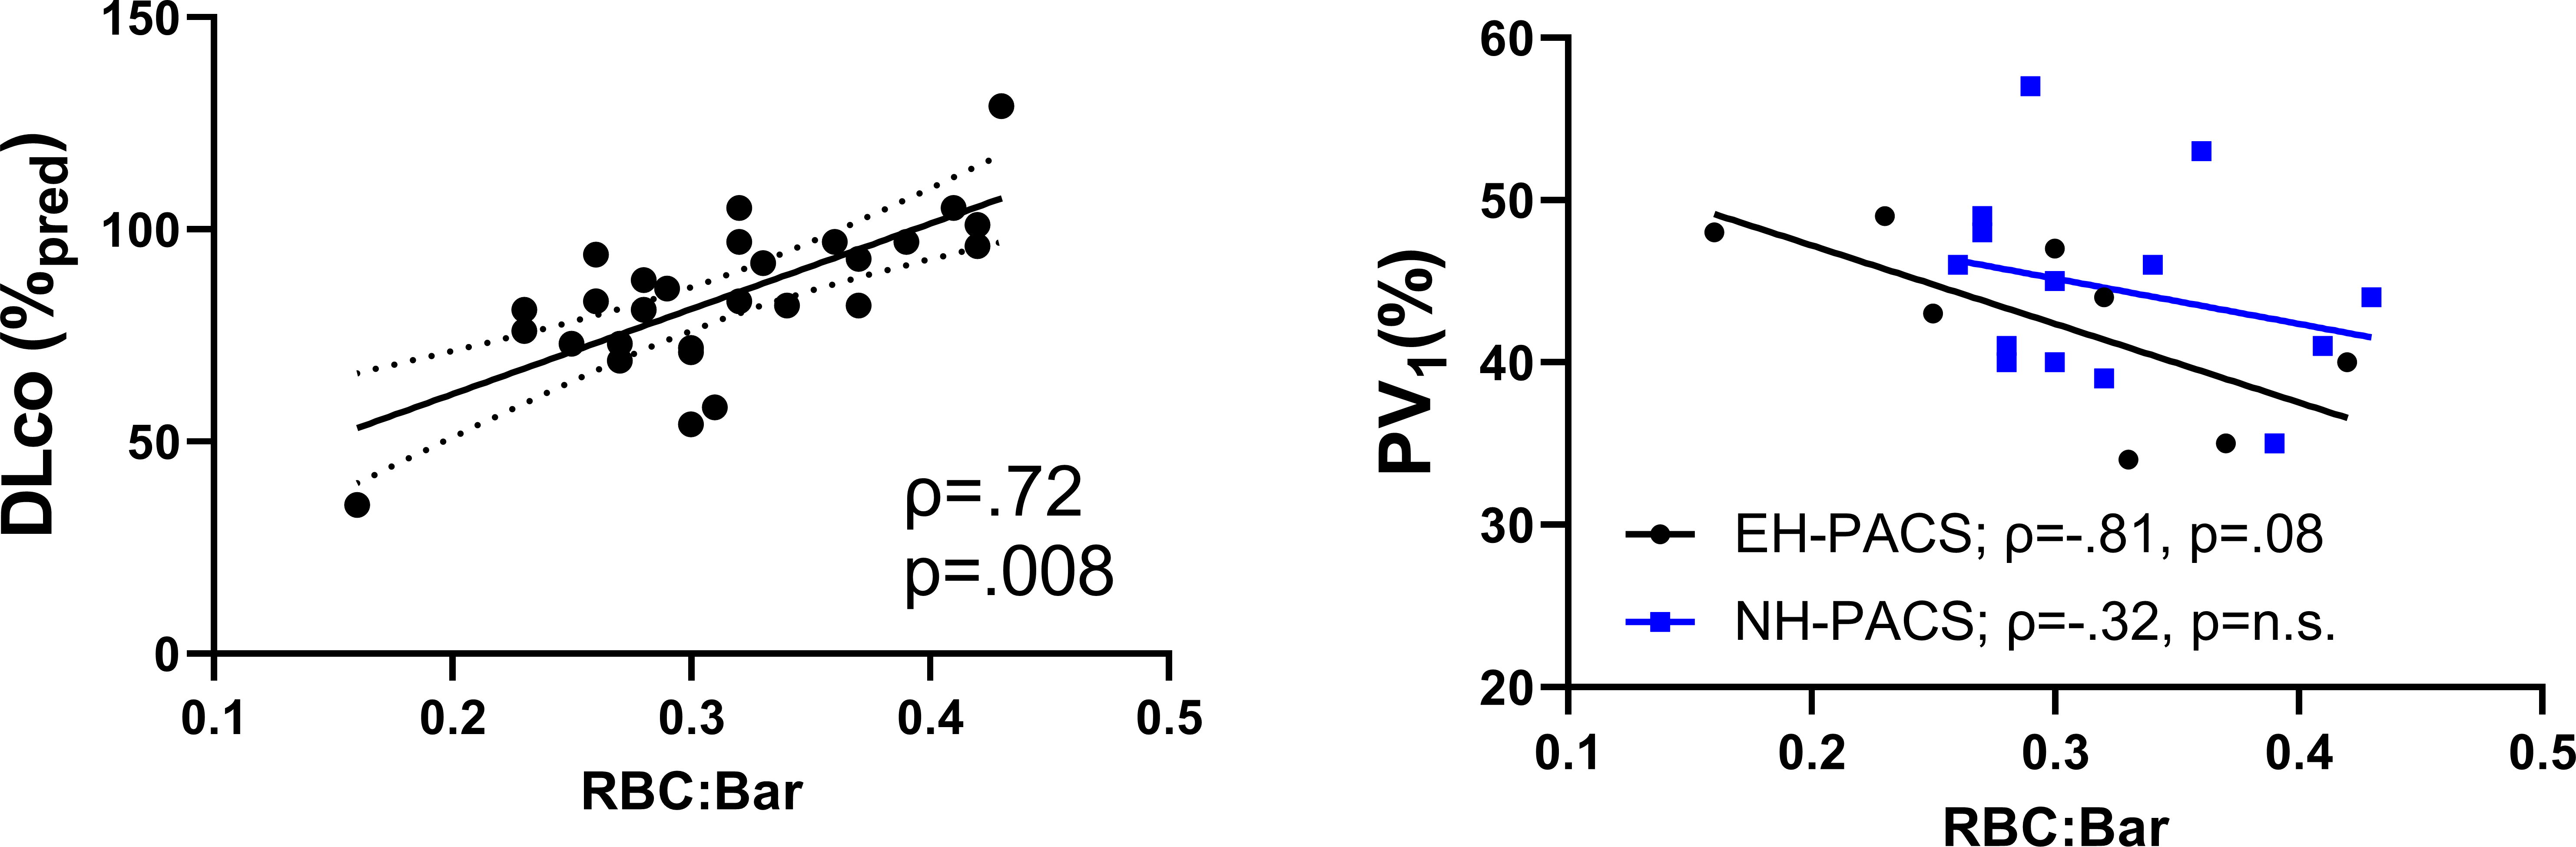
Figure 4. Relationships of 129Xe gas-exchange measurements with DLCO and CT measurements. RBC:barrier was significantly related to DLCO (ρ=.72, p=.008, y=201x+21). PV1 was not significantly related to RBC:barrier in never-hospitalized participants, but was trending towards significance in ever-hospitalized participants (ρ=-.81, p=.08, y=-48x+57). EH-PACS = ever-hospitalized black dots; NH-PACS=never-hospitalized blue squares.