2210
Free-breathing low-field MRI of the lung exhibits functional damages associated with persistent symptoms in Covid-19 patients1Institute of Radiology, University Hospital Erlangen, Friedrich-Alexander-Universität Erlangen-Nürnberg (FAU), Erlangen, Germany, 2MR Application Predevelopment, Siemens Healthcare, Erlangen, Germany, 3Institute of Diagnostic and Interventional Radiology, Hannover Medical School, Hannover, Germany, 4Biomedical Research in Endstage and Obstructive Lung Disease Hannover (BREATH), German Center for Lung Research (DZL), Hannover, Germany, 5Department of Medicine 1, University Hospital Erlangen, Friedrich-Alexander-Universität Erlangen-Nürnberg (FAU), Erlangen, Germany, 6Department of Transfusion Medicine and Haemostaseology, University Hospital Erlangen, Friedrich-Alexander-Universität Erlangen-Nürnberg (FAU), Erlangen, Germany, 7Department of Gastroenterology and Hepatology, University Hospital Zürich, Zürich, Switzerland
Synopsis
Free-breathing lung images were acquired at 0.55T in 73 Covid-19 patients, on average 5.4 months after the symptoms onset. Perfusion, fractional ventilation and Flow-Volume Loop correlation (FVLc) maps were extracted with the Phase-Resolved Functional Lung analysis technique, and percentages of defect areas were calculated. The most relevant predictors of the presence of persistent symptoms were the areas with concurrent perfusion and FVLc defects, and the areas without defects. Patients could be classified as symptomatic or asymptomatic with an accuracy of 71% when fitting a regression model with these predictors on the entire dataset and their combined score was significantly different.
Introduction
With the Covid-19 pandemic, diagnostic imaging of the lungs has become crucial for the follow-up of the alterations incurred by this infectious disease still to be fully characterized. The main technology currently used remains Computed Tomography, which exposes the patient to ionizing radiation, especially in repetitive examinations. In contrast, MRI is a non-ionizing technology providing functional information beyond morphological assessment, but is hampered in the lungs by susceptibility effects due to the direct tissue-air interface, limiting its clinical use. However, these effects are mitigated at lower field strengths, which are currently reconsidered by MRI vendors in conjunction with the latest advances in sequence developments, reconstruction and data processing (e.g., 0.55T)1. Moreover, free-breathing analysis techniques based on Fourier-Decomposition such as PREFUL (Phase-Resolved Functional Lung)2 can provide quantitative maps of perfusion and ventilation functions, and identified significant changes in defect areas in different pathologies2–5.This study aimed to evaluate the potential of free-breathing lung MRI at 0.55T in combination with the PREFUL technique for the diagnostic and follow-up of long-Covid symptoms.
Materials & Methods
Acquisition. A balanced steady-state free precession sequence was optimized on a 0.55T prototype whole-body system (Siemens Healthcare, Erlangen, Germany) for free-breathing lung imaging: one two-dimensional coronal slice (middle of the heart), thickness=15mm, in-plane resolution=1.7x1.7mm2, matrix=128x128 (interpolated to 256x256), bandwidth=1302Hz/pixel, flip angle=30°, TR/TE=276.7/1.6ms, GRAPPA=2, 250 time points, duration=1min34s. The sequence was applied to 73 patients infected with Covid-19, 3.5-7.4 months after the symptoms onset.Processing. The following metrics were automatically calculated voxel-wise with a prototype implementation of the PREFUL technique2 (MR Lung v2.0, Siemens Healthcare), after registration to a manually selected mid-expiration position:
- Normalized perfusion (Q, %) with respect to full-blood signal (highest perfusion signal in-between the lungs3);
- Fractional ventilation (FV, %)6;
- Flow-Volume Loop correlation (FVLc)5: correlation of the Flow-Volume Loop (deduced from the FV reconstructed cycle) with respect to a healthy region (largest connected region within the 80th and 90th FV percentiles);
- Perfusion time-to-peak (ms) with respect to the normalization region;
- FV time-to-peak (% of the respiratory cycle).
The percentage of overlap between defect areas of perfusion and ventilation metrics (Q-FV-Defect, Q-FVLc-Defect) and perfusion defects exclusive to ventilation defects (Q-Defect-FV-Exclusive, Q-Defect-FVLc-Exclusive) were derived, and vice versa (FV-Defect-Q-Exclusive, FVLc-Defect-Q-Exclusive), in addition to areas without defect on both perfusion and ventilation maps (Q-FV-Non-Defect, Q-FVLc-Non-Defect).
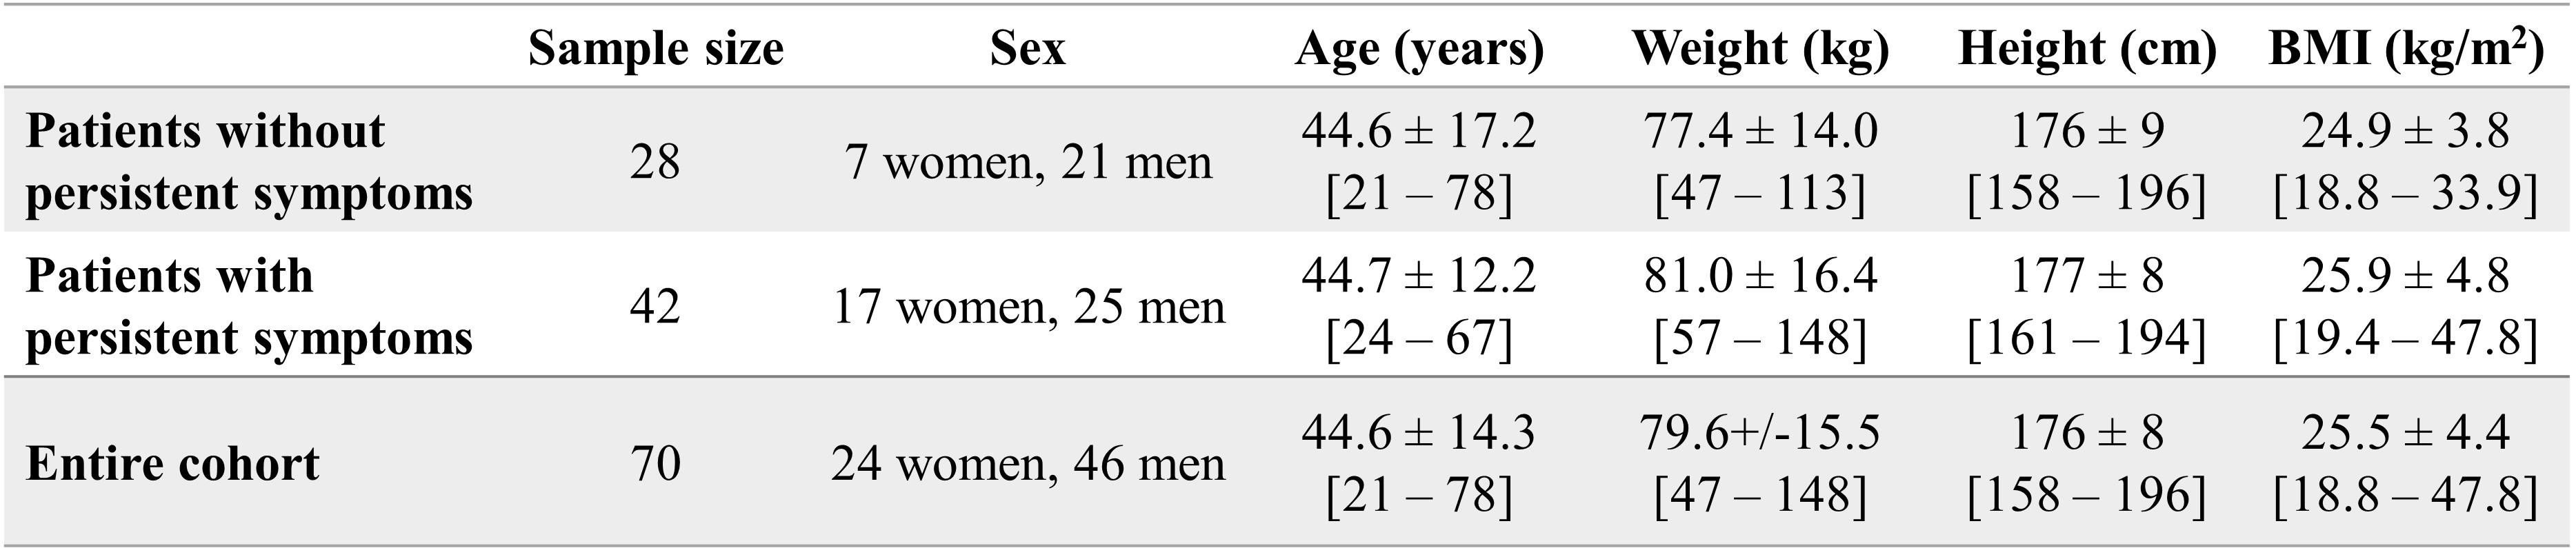
Analysis. Three patients were discarded because of signal clipping in MR data, resulting in a final cohort of 70 patients (Fig.1).
First, the variables with the highest predictive power for the presence of persistent symptoms had to be determined. All MRI metrics described above, sex, age, body mass index and the presence of pre-existing conditions affecting baseline functions (e.g., asthma) were included. These variables were standardized with respect to their distribution in the cohort. For every number of variables N to select, the Recursive Feature Elimination algorithm (scikit-learn 0.24.2) was applied to evaluate the logistic regression model for the prediction of the presence of persistent symptoms. A Repeated Stratified K-Fold cross-validation strategy was used with 7 splits (6 folds for fitting, 1 for evaluation), repeated 5 times. The mean classification accuracy was calculated across all splits and repetitions, for each N.
Secondly, the set of variables providing the highest mean accuracy was kept and the mean Receiver Operating Characteristic curve was calculated with a Stratified K-Fold cross-validation (7 folds).
Results
The animation in Fig.2 shows the image time series obtained in two patients, without and with persistent symptoms. The most relevant predictors (mean accuracy=67%) were (in order of selection, Fig.3):- Q-FVLc-Defect
- Q-FVLc-Non-Defect.
- $$$\alpha_1$$$=3.19 (without
standardization, $$$\alpha_1^{native}$$$=1.02)
- $$$\alpha_2$$$=1.59 ($$$\alpha_2^{native}$$$=0.09)
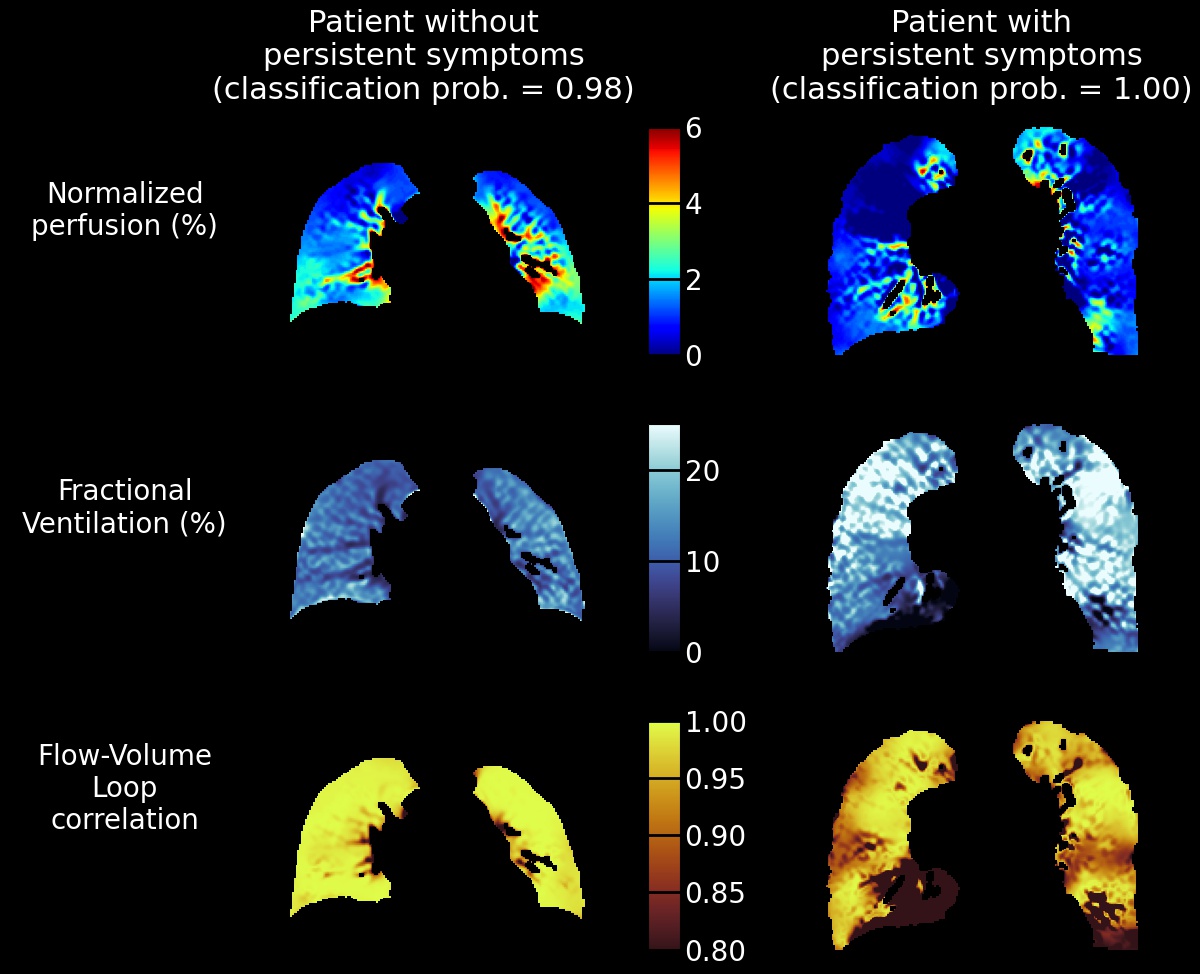
While no significant difference in Q-FVLc-Defect and Q-FVLc-Non-Defect were observable between the two groups (Student’s t-test p-value of 0.233 and 0.227, respectively), the difference in the score $$$\lambda=\alpha_1^{(native)}×$$$[Q-FVLc-Defect]$$$+\alpha_2^{(native)}×$$$[Q-FVLc-Non-Defect] was significant (p-value<0.02). Clear functional abnormalities were observed at the individual level comparing perfusion, FV and FVLc maps in the patients best classified in each group by the model (Fig.5).
Discussion
As in other pathologies5, FVLc, which captures the ventilation cycle dynamics, was more sensitive than FV to the presence of symptoms. The involvement of perfusion concurs with the main vascular component of the disease previously reported7,8. The concurrent presence of perfusion and ventilation dynamics defects/non-defects appeared as a discriminant factor between patients with and without persistent symptoms. The score $$$\lambda$$$ could be a potential biomarker for lung assessment in Covid-19 patients.Conclusion & Perspectives
Free-breathing 0.55T MRI and the PREFUL analysis demonstrated sensitivity to the presence of persistent symptoms with an accuracy of 71%, concurrent perfusion and FVLc defects/non-defects being the most relevant factors. More advanced models could increase this accuracy. An ongoing longitudinal study will aim to confirm these findings.Acknowledgements
The authors would like to gratefully thank Siemens Healthineers for the support in this study. This work received funding from the Bayerisches Staatsministerium für Wissenschaft und Kunst.References
1. Heiss, R., Nagel, A. M., Laun, F. B., Uder, M. & Bickelhaupt, S. Low-Field Magnetic Resonance Imaging: A New Generation of Breakthrough Technology in Clinical Imaging. Invest Radiol 56, 726–733 (2021).
2. Voskrebenzev, A. et al. Feasibility of quantitative regional ventilation and perfusion mapping with phase‐resolved functional lung (PREFUL) MRI in healthy volunteers and COPD, CTEPH, and CF patients. Magn. Reson. Med 79, 2306–2314 (2018).
3. Behrendt, L. et al. Validation of Automated Perfusion‐Weighted Phase‐Resolved Functional Lung (PREFUL)‐MRI in Patients With Pulmonary Diseases. J. Magn. Reson. Imaging 52, 103–114 (2020).
4. Pöhler, G. H. et al. Chronic thromboembolic pulmonary hypertension perioperative monitoring using phase‐resolved functional lung (PREFUL)‐MRI. J. Magn. Reson. Imaging 52, 610–619 (2020).
5. Moher Alsady, T. et al. MRI‐derived regional flow‐volume loop parameters detect early‐stage chronic lung allograft dysfunction. J. Magn. Reson. Imaging 50, 1873–1882 (2019).
6. Klimeš, F. et al. Free‐breathing quantification of regional ventilation derived by phase‐resolved functional lung (PREFUL) MRI. NMR in Biomedicine 32, e4088 (2019).
7. Siddiqi, H. K., Libby, P. & Ridker, P. M. COVID-19 – A vascular disease. Trends in Cardiovascular Medicine 31, 1–5 (2021).
8. Zamboni, P. COVID-19 as a Vascular Disease: Lesson Learned from Imaging and Blood Biomarkers. Diagnostics 10, 440 (2020).
Figures