2209
The Impact of 3-ply and KN95 Facemasks on Cerebral Blood Flow and Oxygenation1UBC MRI Research Centre, University of British Columbia, Vancouver, BC, Canada, 2Department of Physics and Astronomy, University of British Columbia, Vancouver, BC, Canada, 3Geoffrey Jefferson Brain Research Centre, Division of Neuroscience and Experimental Psychology, Faculty of Biology, Medicine and Health, University of Manchester, Manchester, United Kingdom, 4Department of Neuroradiology, Medical University of Innsbruck, Innsbruck, Austria, 5Department of Pediatrics, Division of Neurology, University of British Columbia, Vancouver, BC, Canada
Synopsis
Given the increased use of facemasks in everyday life, the impacts of these masks on cerebral blood flow (CBF) and oxygenation needs to be investigated. This study used pseudo-continuous arterial spin labeling (pCASL) and quantitative susceptibility mapping (QSM) to determine changes to grey matter CBF and oxygenation respectively. This was done by comparing facemask and no facemask scans for both 3-ply and KN95 masks. The average percent change between the facemask and no facemask oxygenation/susceptibility were insignificant for both mask types, and only the 3-ply facemask showed a statistically significant increase of 5.5% in CBF when wearing the facemask.
Purpose
The COVID-19 pandemic has greatly increased the use of facemasks in everyday life. It has become commonplace for facemasks to be recommended, and oftentimes mandated, in many public places. However, the effect of facemasks on cerebral blood flow (CBF) and magnetic susceptibility/oxygenation has not been thoroughly investigated.Methods
This was a scan-rescan study with 16 participants (8 male and 8 female, age range 22-36 years old with a mean age of 26.6 years). Half of the participants were scanned with the 3-ply facemask first and half were scanned with the facemask in the second set of scans. A subset of 10 of the 16 participants (5 male and 5 female, age range of 23-36 years with a mean age of 26.5 years) agreed to undergo the same scanning procedures with a KN95 mask and without. This study used a 3T MR system (Ingenia Elition; Philips Medical Systems, Best, The Netherlands). The scans acquired for anatomy, blood flow, and oxygenation were as follows:· A 3DT1-weighted scan (repetition time TR = 1.7ms, echo time TE = 3.55ms, flip angle = 8°, voxel size = 3x3x6mm3)
· A 3D pCASL (TR = 4,234ms, TE 10.61ms, post labelling delay 2,000ms, voxel size 3x3x6mm3)
· A 3D gradient echo scan (TR = 28.4ms, TE = 6, 12,…,24ms, flip angle = 15°, voxel size = 0.69x0.69x0.69 mm3)
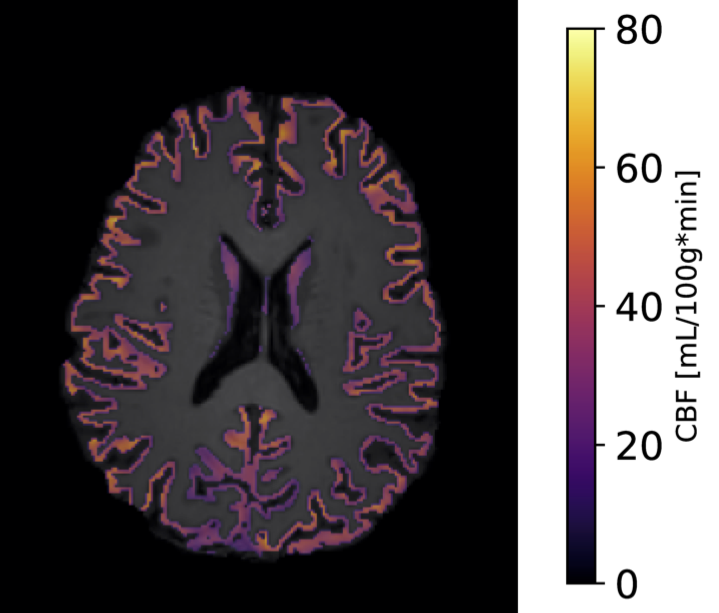
The grey matter CBF was determined by masking the standard output CBF maps from the Philips pCASL protocol to the grey matter mask determined using FSL FAST1 on the brain extracted 3DT1-weighted scan (brain extraction done using FSL BET2). See figure 1 for an example of the CBF map masked to the grey matter. Note that prior to masking to the grey matter, the CBF maps were registered to the 3DT1-weighted scans by registering the M0 pCASL scan. The non-zero voxel CBF average was taken across all grey matter to determine a percent change in grey matter CBF between the facemask and no facemask scan.
Similarly, the QSM was masked to the grey matter determined from the 3DT1-weighted scan after registration. The QSM was determined from the 4th echo of the 3D gradient echo scan using the RTS algorithm3. The grey matter magnetic susceptibility was averaged across all non-zero voxels above the red nuclei. All slices below the red nuclei were excluded from analysis since regions below the red nuclei are prone to artifacts4,5, and the grey matter magnetic susceptibility was not converted to cerebral venous oxygen saturation (CSVO2) due to the non-venous tissue included in grey matter.
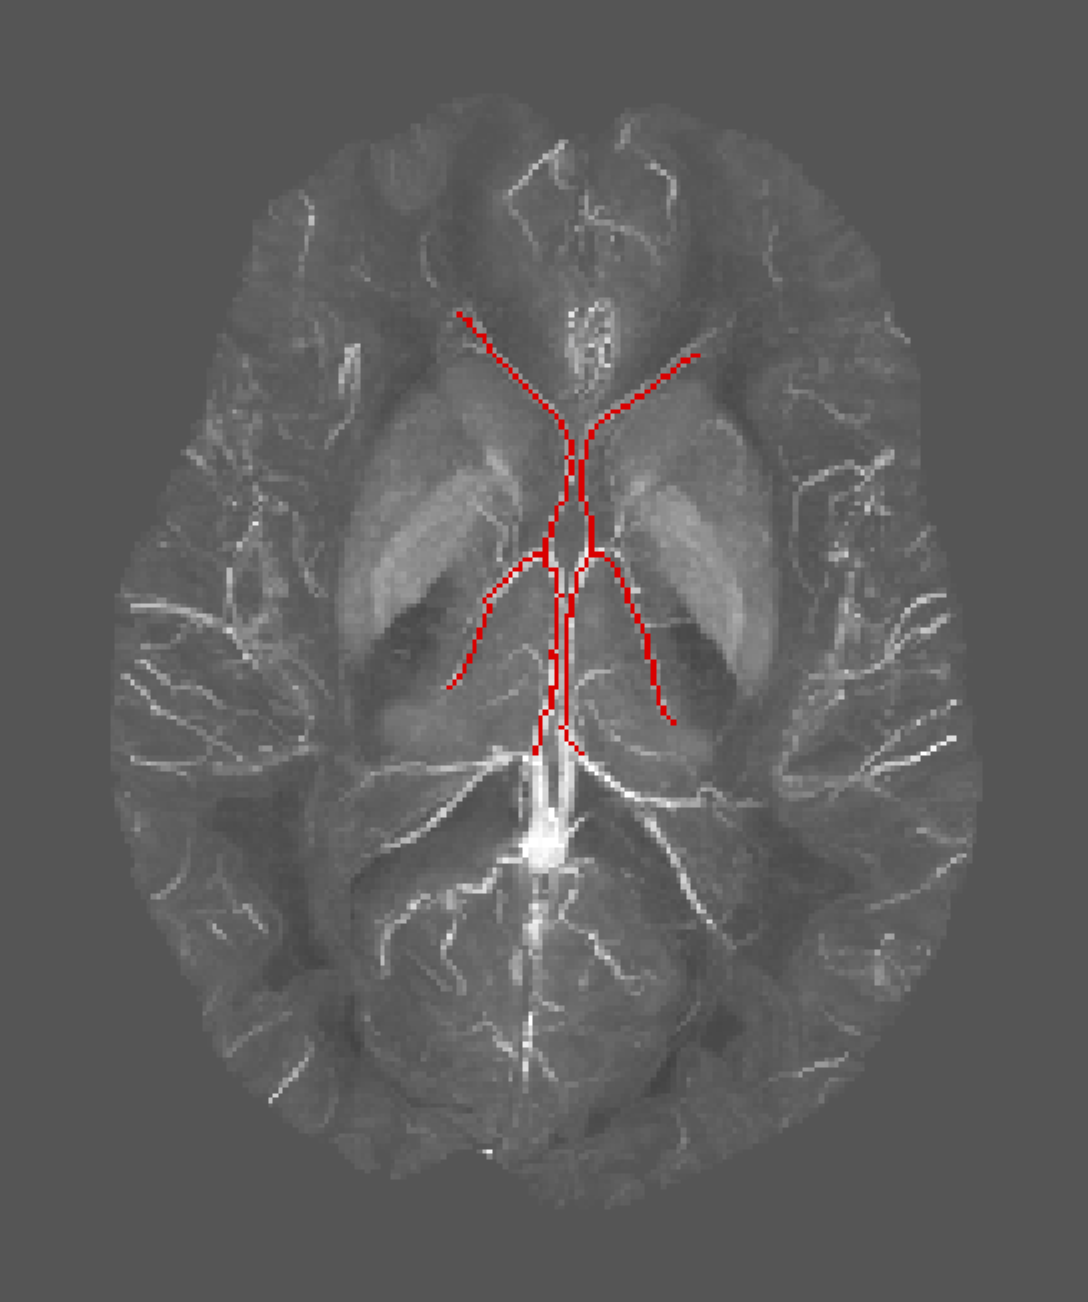
A CSVO2 value was determined through a maximum intensity projection of a stack of slices of the QSM image that contained the thalamostriate, anterior septal, and internal cerebral vein. These veins were then manually segmented from the projections; see figure 2 for an example of one of the venous segmentations of the QSM projection. The average magnetic susceptibility value from the segmented venous portion was then converted to CSVO2 using the following equation.
$$CS_VO_2=1-\frac{\chi-\chi_{oxy}\cdot Hct}{\chi_{do}\cdot Hct}$$
where Hct is the hematocrit, χ is the magnetic susceptibility difference between blood and surrounding tissue, χoxy is the susceptibility difference between fully oxygenated blood and surrounding tissue, and χdo is the magnetic susceptibility difference between fully oxygenated and fully deoxygenated blood. We assumed values of χdo=0.27·4π≈3.39ppm6, χoxy=-0.03·4π≈-0.38ppm7, and Hct=45%8.
Paired student’s t-tests (alpha value = 0.05) were used to compare the facemask and no facemask values for grey matter CBF, grey matter magnetic susceptibility and CSVO2 for both the 3-ply and KN95 data sets.
Results
When wearing the 3-ply mask grey matter CBF increased significantly by 5.5% (with a paired t-test p-value of 0.008). The grey matter magnetic susceptibility decreased by 7.1% (note: a decrease in magnetic susceptibility is consistent with an increase in oxygenation as shown by the relationship described in the equation above) however, this change was not statistically significant (with a paired t-test p-value of 0.069). The CSVO2 had a 0.37% increase when wearing the facemask but this change was also insignificant through the paired student’s t-test (p-value = 0.358). These results are summarized in the upper row of figure 3.For the KN95 mask type the percent changes in grey matter CBF, grey matter magnetic susceptibility, and CSVO2 were 0.0%, -0.75% and 0.04% respectively. However, through paired student’s t-tests these results were all found to be insignificant with p-values of 0.995, 0.965, and 0.927 respectively. These results are summarized in the lower row of figure 3.
In addition, standard student’s t-tests showed there was no statistical difference in the results from the participants scanned with the facemask first compared to those scanned with the facemask second.
Discussion and Conclusion
Neither the KN95 nor the 3-ply facemask had any significant impact on the cerebral oxygenation as shown by the insignificant changes in grey matter magnetic susceptibility and CSVO2. The only significant change found through this study was an increase in grey matter CBF from the 3-ply facemask. Since there was no difference between those scanned with a facemask first or facemask second, it is expected that any physiological results from the facemask are normalized within a few minutes.Acknowledgements
We would like to thank the participants of the study for volunteering their time, the UBC MRI Research Centre, and the MRI technologists. This study was performed at UBC Vancouver which is located on the traditional, ancestral, and unceded territory of the Musqueam people. This work was funded by the Natural Sciences and Engineering Research Council of Canada (grant number 2021-04085).
References
- Y Zhang, M Brady, S Smith, Segmentation of brain MR images through a hidden Markov random field model and the expectation-maximization algorithm. IEEE Transactions on Med.Imaging 20, 45–57 (2001).
- S.M. Smith. Fast robust automated brain extraction. Human Brain Mapping, 17(3):143-155, November 2002.
- C Kames, V Wiggermann, A Rauscher, Rapid two-step dipole inversion for susceptibility mapping with sparsity priors. NeuroImage 167, 276–283 (2018).
- Y Wang, T Liu, Quantitative susceptibility mapping (QSM): Decoding MRI data for a tissue magnetic biomarker. Magn. Reson. Med. 73, 82–101 (2015).
- J Fang, L Bao, X Li, PC van Zijl, Z Chen, Background field removal for susceptibility mapping of human brain with large susceptibility variations. Magn. Reson. Med. 81, 2025–2037 (2019).
- WM Spees, DA Yablonskiy, MC Oswood, JJ Ackerman, Water proton MR properties of human blood at 1.5 Tesla: magnetic susceptibility, T(1), T(2), T*(2), and non-Lorentzian signal behavior. Magn. Reson. Med. 45, 533–542 (2001).
- RM Weisskoff, S Kiihne, MRI susceptometry: Image-based measurement of absolute susceptibility of MR contrast agents and human blood. Magn. Reson. Med. 24, 375–383 (1992).
- E Cohen, M Kramer, T Shochat, E Goldberg, I Krause, Relationship between hematocrit levels and intraocular pressure in men and women: A population-based cross-sectional study. Medicine (Baltimore) 96, e8290 (2017).
- M Allen, et al., Raincloud plots: a multi-platform tool for robust data visualization. Wellcome Open Res. 4, 63 (2021).
Figures