2205
Inflammation and reduced cortical perfusion assessed by renal MRI during acute kidney injury in critically ill COVID-19 patients1Sir Peter Mansfield Imaging Centre, University of Nottingham, Nottingham, United Kingdom, 2Section of Anesthesiology, Dept of Surgical Sciences, Uppsala University Hospital, Uppsala, Sweden, 3Section of Radiology, Dept of Surgical Sciences, Uppsala University Hospital, Uppsala, Sweden, 4Department of Medical Physics, Uppsala University Hospital, Uppsala, Sweden, 5Department of Medical Cell Biology, Uppsala University, Uppsala, Sweden
Synopsis
Acute kidney injury (AKI) is associated with increased mortality in COVID-19 patients. Multiparametric MRI was performed to study renal perfusion, oxygenation and tissue structure in nineteen COVID-19 intensive care patients. Results are compared between patients with and without COVID-19 associated AKI, and with healthy volunteers (HV). Cortical perfusion was lower in COVID-19 compared to HVs (P=0.0002) with cortex and medullary perfusion lower in AKI compared to non-AKI (P<0.03). Correlations between cortex measures in COVID-19 showed T1 was positively correlated with T2 and ADC, and T2 was positively correlated with ADC and T2* suggesting interstitial oedema resulting from inflammation.
Introduction
Development of acute kidney injury (AKI) is independently associated with increased mortality in hospitalised patients with COVID-19 and 4-fold higher odds of death than AKI due to other causes1. However, the pathophysiology of COVID-19 associated AKI is unclear. Here we perform non-invasive multiparametric magnetic resonance imaging (MRI) to study renal perfusion, oxygenation and tissue structure in ICU COVID-19 patients, and compare the results between participants with and without COVID-19 associated AKI and age-matched healthy volunteers (HV).Methods
Nineteen COVID-19 patients (65[61-72] yrs) underwent renal multiparametric MRI (Philips 3T Ingenia) during their ICU admission, 10 were classified as having AKI and 9 as the non-AKI group. At the time of MRI, patients had been in ICU for 4[3-8] days, of which 89% required mechanical ventilation since the previous 3[2-4] days. In the AKI group, the criteria for AKI was fulfilled in 1[0-2] day prior to MRI. HV data is taken from a previously published study using the same renal MRI protocol2.Renal MRI was assessed in a ~40 minute scan comprising:
(i) Renal perfusion measured using a respiratory-triggered end-expiration flow-sensitive alternating inversion recovery (FAIR) arterial spin labelling (ASL) (post label delay (PLD) 1800 ms, 25 image pairs, inflow measures (PLDs 400 and 600 ms, 3 pairs) with fat-suppressed spin echo-echo planar imaging (SE-EPI) readout (5 slices, TE 27 ms, FOV 336x336x25 mm3, 3x3x5 mm3), and M0 image and T1 map3.
(ii) Total renal blood flow (TRBF) measured using phase contrast (PC)-MRI of both renal arteries (VCG triggered turbo field echo (TFE), TR/TE 10.2/4.2 ms, 1.17x1.17x6 mm2, VENC 120 cm/s, 20 phases). Total kidney volume (TKV) was assessed (T2W TSE, TR/TE 908/60 ms, FOV 350x350x104 mm3, 1.5x1.5 mm2, 19 slices, slice thickness/gap 5/0.5 mm) and global kidney perfusion computed (TRBF/TKV).
(ii) Blood Oxygenation Level Dependent (BOLD) relaxation rate (R2*=1/T2*) (multiecho fast field echo (mFFE), TR 196 ms, TE1/ΔTE 5/3 ms, 12 echoes, FOV 336x336x25 mm3, 5 contiguous slices, 1.5x1.5x5 mm3). Renal venous oxygenation was measured using respiratory triggered FAIR-based T2 Relaxation Under Spin Tagging4 (TRUST) (sagittal slice through left renal vein, effective TEs 1/40/80/160 ms, 6 image pairs, PLD 1000 ms, FOV 244x244 mm2, 2.5x2.5 mm2).
(iii) T2 mapping using respiratory-triggered gradient Spin Echo (GraSE) (TR 3000 ms, TE 12.04–186.62 ms in 6.02 ms steps, FOV 288x288x25 mm3, 3x3x5 mm3).
(iv) Apparent diffusion coefficient (ADC) quantified using respiratory-triggered diffusion weighted imaging (DWI) (b-values 0/5/15/30/45/60/75/400/600 s/mm2, TE 49.7 ms, FOV 336x336x24.5 mm3, 3x3x5 mm3).
TKV was calculated using MIPAV and corrected for body surface area. Multiparametric maps were generated using MATLAB3. Inversion recovery data was fit to form T1 maps. Average perfusion weighted images were normalised to a base magnetisation image, and fit to a kinetic model to quantify perfusion. mFFE data was fit to compute R2*/T2* maps. T2 maps were generated with online scanner software. DWI data was fit to compute ADC maps. Cortex and medulla masks were created from T1 maps, and the mode of all mapping parameters computed for each kidney, and the mean across kidneys calculated3.
Results
Cortical perfusion was significantly lower in COVID-19 compared to HVs (P=0.0002) with cortex and medullary perfusion significantly lower in the AKI group compared to the non-AKI group (P=0.015, P=0.029, Fig.1a). Global perfusion, as assessed from phase contrast, showed no difference between groups (P=0.07, Fig.1b), whilst total renal blood flow was lower in the AKI compared to non-AKI group (P=0.037, Fig.1c). TKV was not significantly different between groups (P=0.78). There was a trend for cortical R2* to be lower in COVID-19 compared to the HVs (P=0.09, Fig.2a). There was no difference in renal venous oxygenation between the AKI and no AKI groups (P=0.77). Renal cortex T2 values higher in COVID-19 patients than for HVs5, but there was no difference between COVID-19 groups (P=0.71, Fig.2b). There was no difference in cortex or medulla ADC between COVID-19 groups (P=0.27, P=0.87, Fig.3a). Cortical T1 was elevated in COVID-19 compared with HVs (P=0.025, Fig.3b).Correlations were performed to assess associations between measures. Cortical T1 significantly positively correlated with cortical T2 and ADC (Fig.4a), and cortical T2 significantly positively correlated with cortical ADC and T2* (Fig.4b). Medulla T1 significantly positively correlated with medulla ADC (Fig.4c).
Discussion
In the COVID-19 patients, cortical and medullary perfusion were lower in those with AKI compared with those without. Hypoperfusion of the medulla is a well-known mechanism of AKI6 when circulating blood volume is reduced. This change was not significant in the global perfusion, which is likely due to the change in both blood flow and TKV likely to occur on AKI7. Despite a marked reduction in regional perfusion in both medulla and cortex, no hypoxia could be measured from BOLD R2* measures. In contrast, we observe a decrease in R2* in COVID-19 patients, we propose this is due to oedema due to inflammation, which will mask any R2* oxygenation related changes. Cortex T2 and ADC both increased with increasing T1 further supporting interstitial oedema8.Conclusion
Renal cortex perfusion is decreased in critically ill COVID-19 patients compared to healthy volunteers. Positive correlations between renal cortex T1, T2, T2* and ADC suggest interstitial oedema as a result of inflammation in these critically ill patients.Acknowledgements
The study was supported with funding from ALF from Uppsala University Hospital and from NoRCORP (Nottingham Recovery from COVID19 Research Platform) and MRC grant MR/V037005/1.
References
1. Kolhe NV, Fluck RJ, Selby NM and Taal MW. Acute kidney injury associated with COVID-19: A retrospective cohort study. PLoS Med 2020; 17: e1003406.
2. Buchanan CE, Mahmoud H, Cox EF, McCulloch T, Prestwich BL, Taal MW, Selby NM and Francis ST. Quantitative assessment of renal structural and functional changes in chronic kidney disease using multi-parametric magnetic resonance imaging. Nephrol Dial Transplant. 2020;35(6):955-64.
3. Cox EF, Buchanan CE, Bradley CR, Prestwich B, Mahmoud H, Taal M, Selby NM and Francis ST. Multiparametric Renal Magnetic Resonance Imaging: Validation, Interventions, and Alterations in Chronic Kidney Disease. Front Physiol. 2017;8:696.
4. Lu H and Ge Y. Quantitative evaluation of oxygenation in venous vessels using T2-Relaxation-Under-Spin-Tagging MRI. Magn Reson Med. 2008 August ; 60(2): 357–363.
5. de Bazelaire CMJ, Duhamel GD, Rofsky NM and Alsop DC. MR Imaging Relaxation Times of Abdominal and Pelvic Tissues Measured in Vivo at 3.0 T: Preliminary Results. Radiology 2004; 230:652–659
6. Hultström M. Neurohormonal interactions on the renal oxygen delivery and consumption in haemorrhagic shock-induced acute kidney injury. Acta physiologica (Oxford, England) 2013; 209: 11-25.
7. Buchanan C, Mahmoud H, Cox E, Noble R ,Prestwich B , Kasmi I, Taal MW, Francis S and Selby NM. Multiparametric MRI assessment of renal structure and function in acute kidney injury and renal recovery. Clin Kidney J. 2021 Feb 10;14(8):1969-1976.
8. Hueper K, Rong S, Gutberlet M, Hartung D, Mengel M, Lu X, Haller H, Wacker F, Meier M and Gueler F. T2 relaxation time and apparent diffusion coefficient for noninvasive assessment of renal pathology after acute kidney injury in mice: comparison with histopathology. Invest Radiol. 2013 Dec;48(12):834-42.
Figures
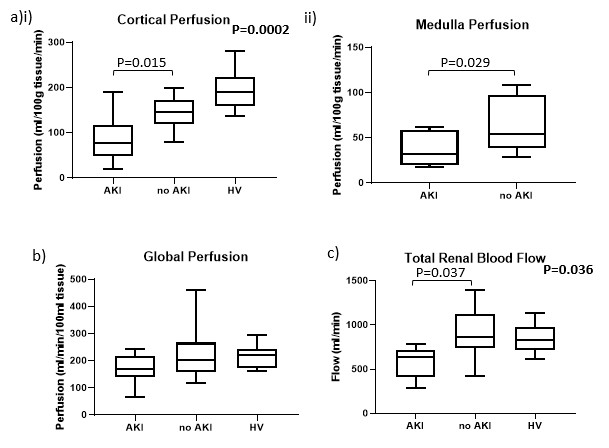
Figure 1: (a) Perfusion calculated from arterial spin labelling in the (i) cortex and (ii) medulla. (b) Global kidney perfusion calculated from the total renal blood flow divided by the total kidney volume. (c) Total renal blood flow calculated from right and left renal artery phase contrast MRI.
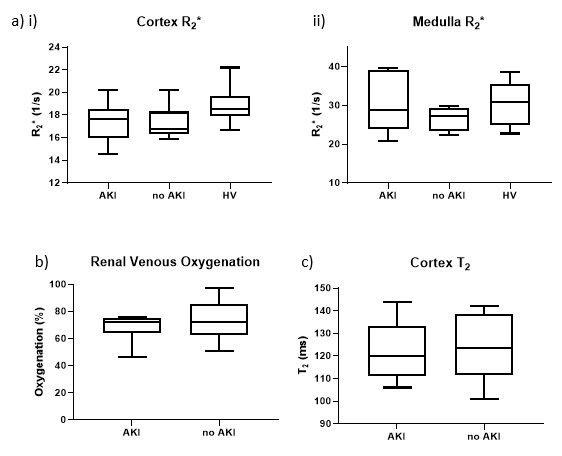
Figure 2: (a) R2* of the (i) cortex and (ii) medulla. (b) Renal vein oxygenation from TRUST. (c) Renal cortex T2.
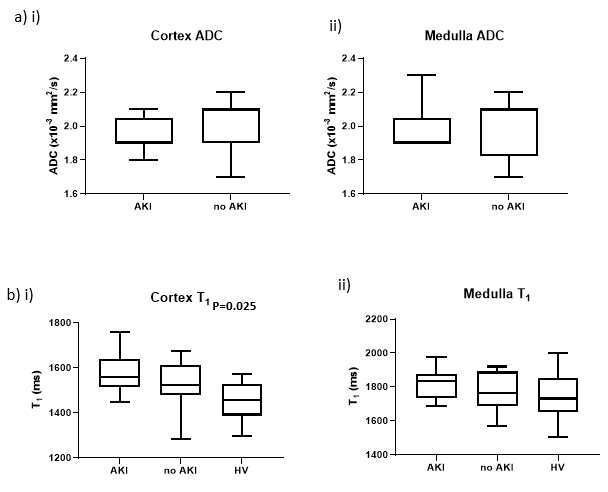
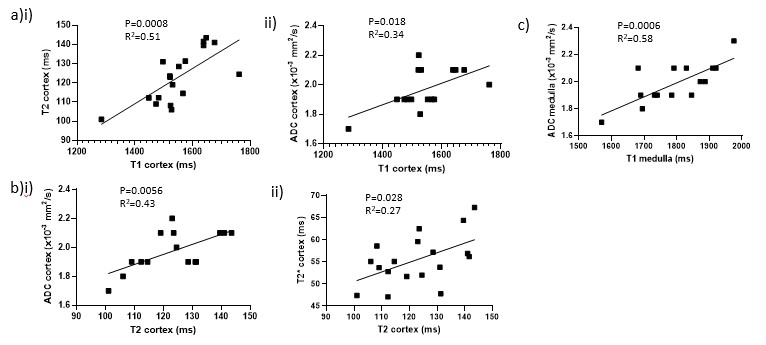
Figure 4: Correlations of (a) cortical T1 with (i) cortical T2 and (ii) cortical ADC, (b) cortical T2 with (i) cortical ADC and (ii) cortical T2*, and (c) medullary T1 with medulla ADC.