2204
Longitudinal brain imaging reveals brain white matter changes after COVID-19 in the UK Biobank1Western Norway University of Applied Sciences, Bergen, Norway, 2NORMENT, Oslo University Hospital, Oslo, Norway, 3University of Oslo, Oslo, Norway, 4Maastricht University, Maastricht, Netherlands, 5Lausanne University Hospital, Lausanne, Switzerland
Synopsis
The COVID-19 pandemic has caused a global health crisis. There are a few indications that this disease has harmful consequences on neurological functioning, besides brain changes following COVID-19 infection have not yet been fully understood. Here, we used UK Biobank (UKB) longitudinal diffusion MRI data acquired before and after COVID-19 tests along the ongoing UKB study. We evaluated brain age gap metrics for the participants with positive and negative test results in order to evaluate COVID-19 consequences on the brain.
Introduction
COVID-19 infection has been associated with several long-term cognitive and psychological consequences1. However, while studies showing effects on various brain imaging measures are emerging1, how and to which degree COVID-19 impacts the white matter (WM) architecture of the brain is still unclear. In the present work, we assessed the influence of COVID-19 disease on WM brain microstructure using UK Biobank (UKB) longitudinal brain diffusion MRI data. As powerful and sensitive measures of WM brain changes based on diffusion MRI2, we used diffusion and kurtosis tensors and a tissue proxy based on White Matter Tract Integrity model3. We used global and regional fractional anisotropy (FA), mean kurtosis (MK) and axonial water fraction (AWF) in a machine learning framework to predict the age of each individual and compute the difference between the true and predicted age, the brain age gap (BAG), which provides a sensitive proxy for general brain changes associated with various clinical conditions4.Methods
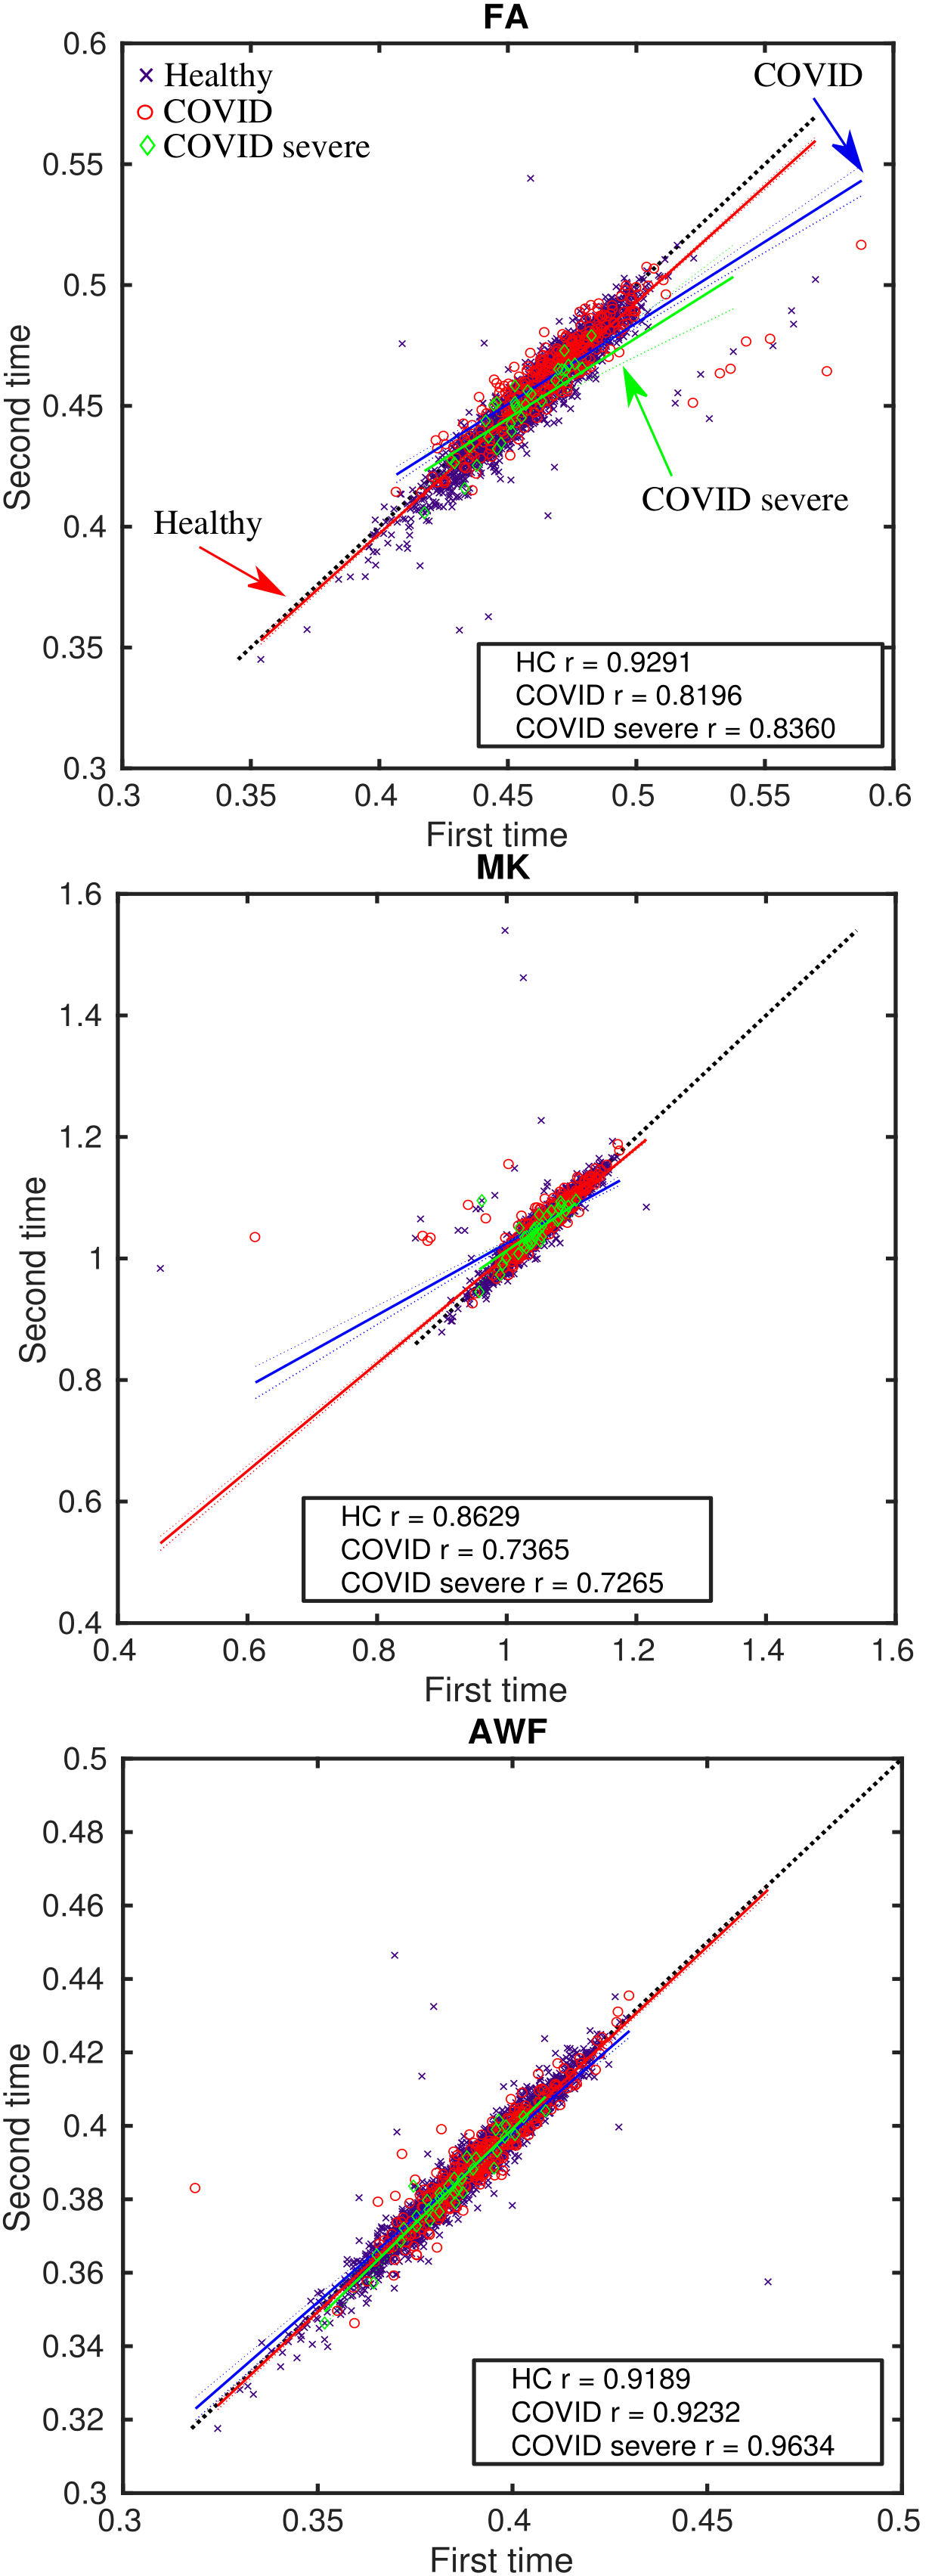
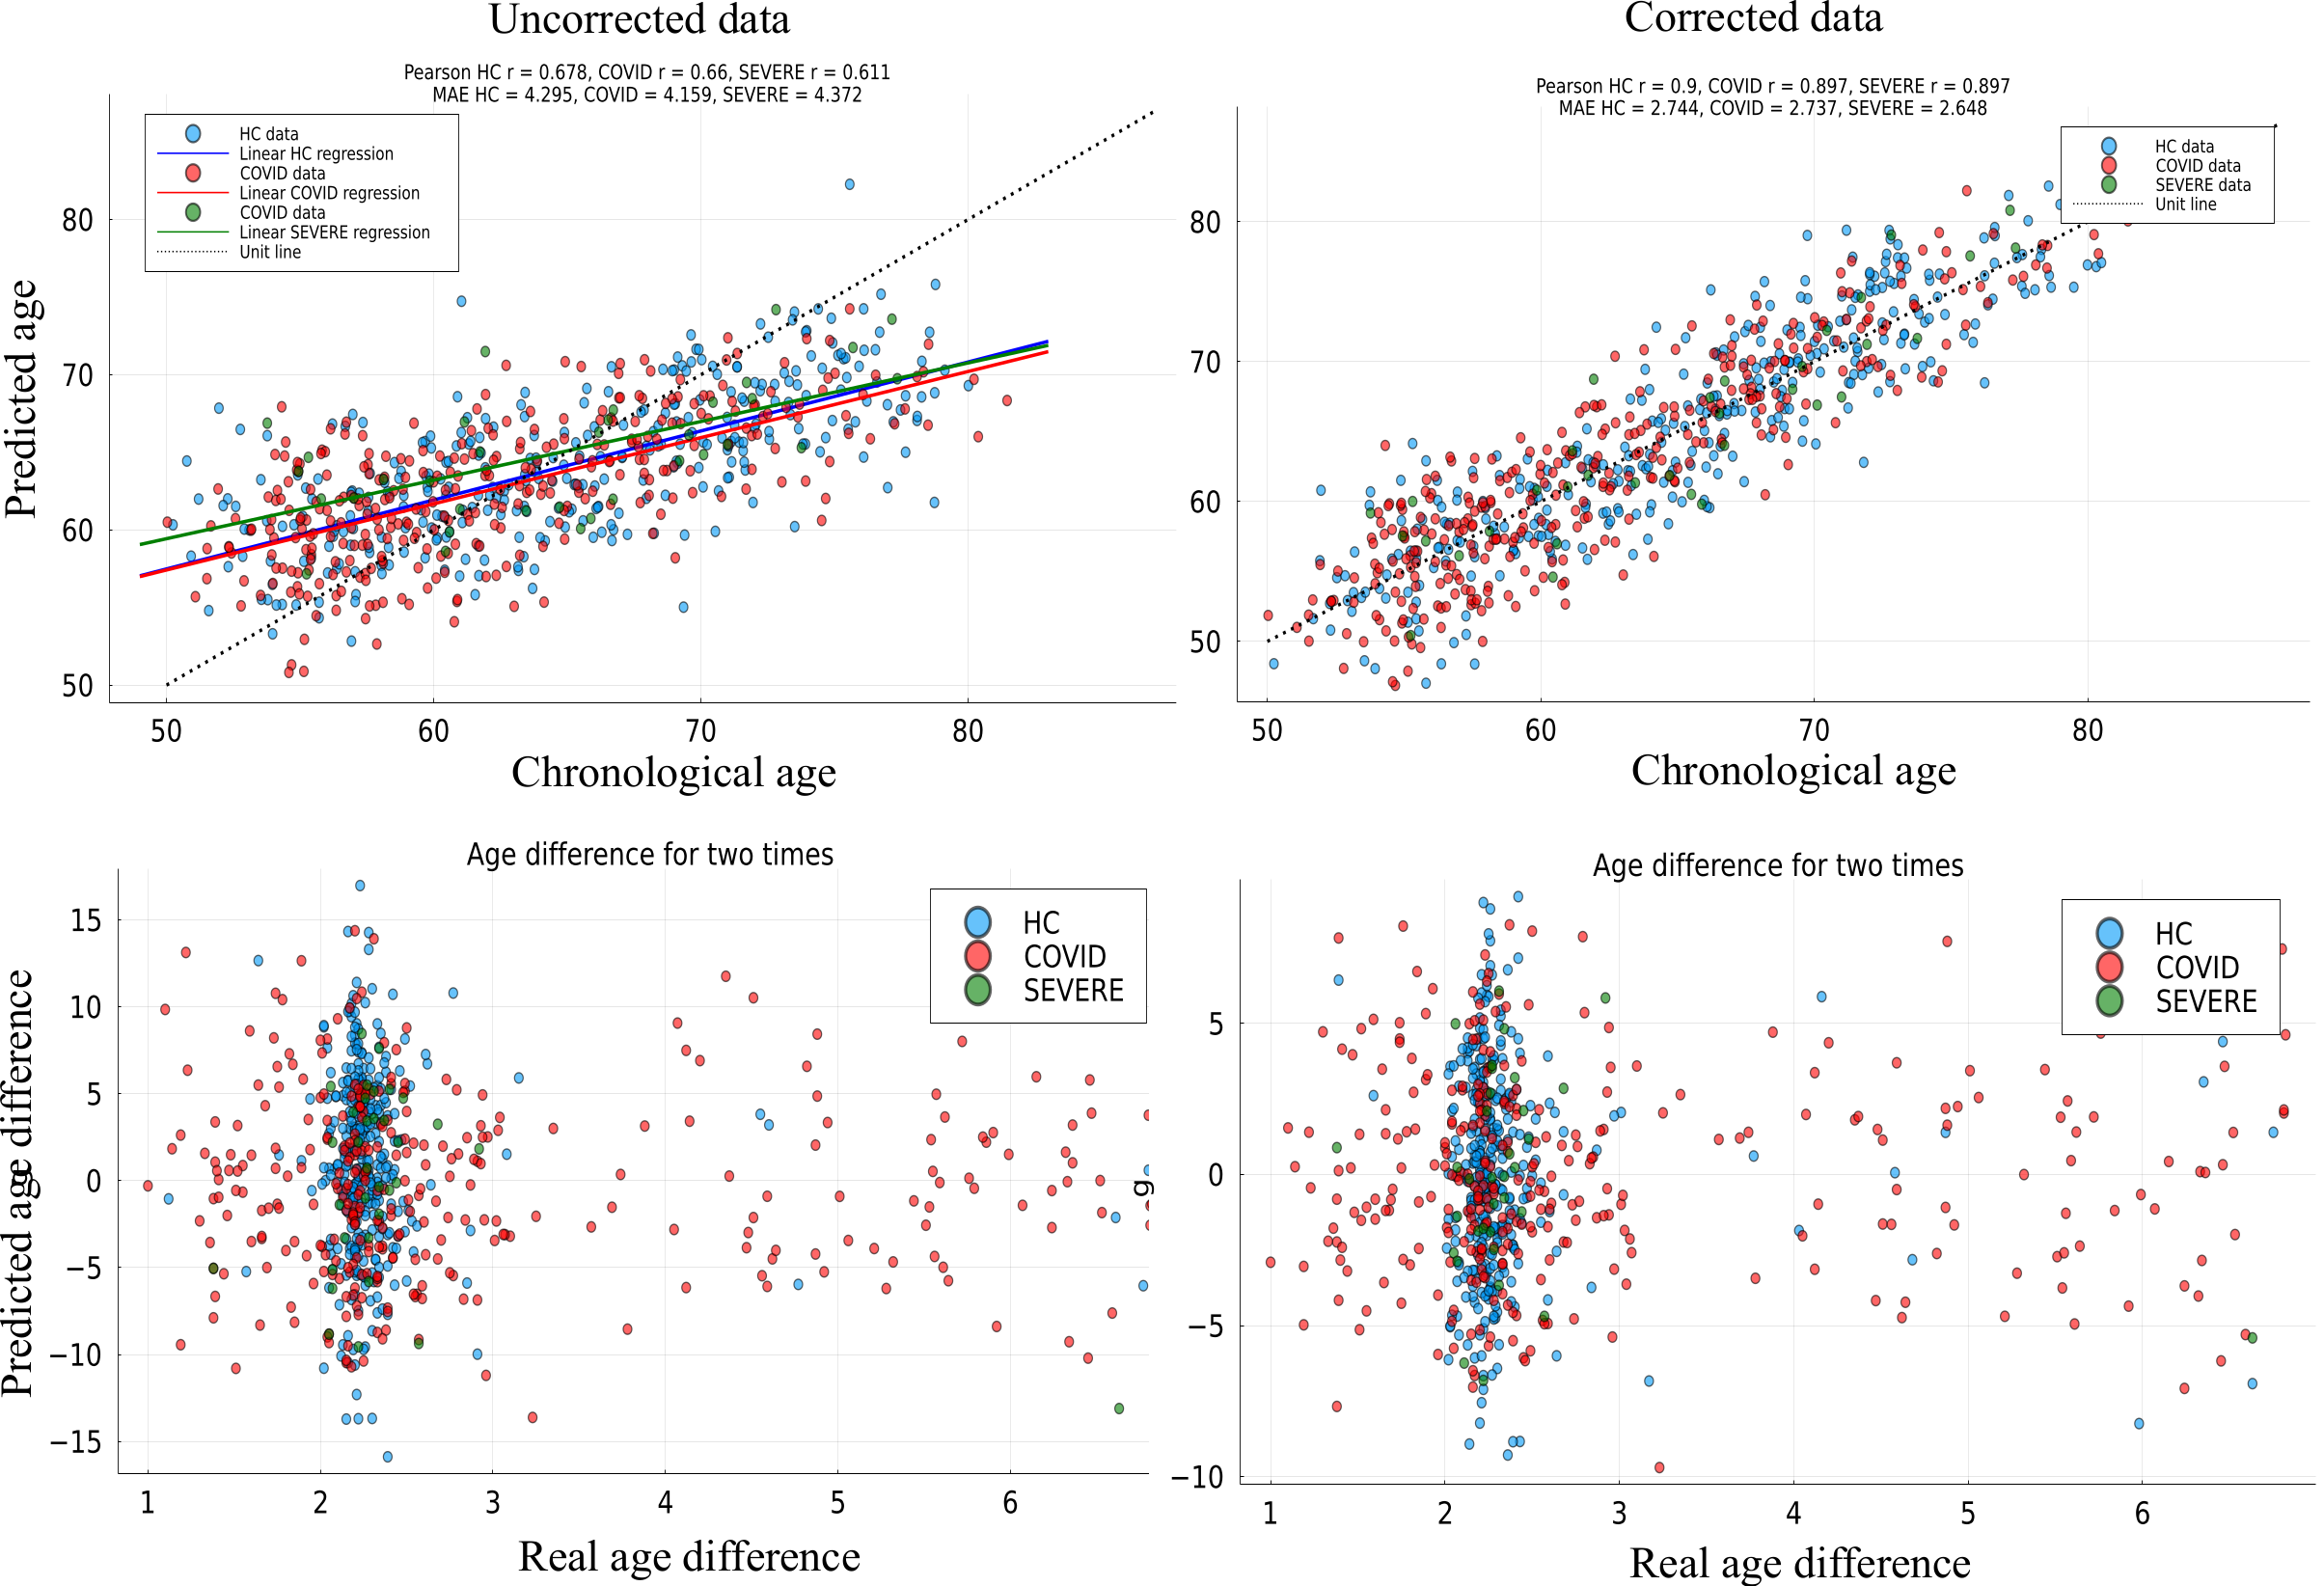
UKB diffusion MRI data consists of two b-shells with 1000 and 2000 mm2/s values with 60 non-coplanar diffusion directions per shell5. Initially, longitudinal (two time points) diffusion data of 3005 participants were processed using an optimised pipeline2. Based on information provided at the followup, the participants were divided into three groups: healthy participants (HC) (n = 2676), which were not infected by COVID-19 before the second time point; COVID infected participants (n = 329), as indicated by a COVID-positive test before the second scan; and COVID SEVERE subgroup (n = 34) which consists of hospitalised COVID patients. We used Tract-Based Spatial Statistics (TBSS)6 whereby all scalar diffusion maps were non-linearly aligned in MNI space and skeletonised. For each participant, we extracted global and regional diffusion metrics, based on the JHU atlas for each participant. A quality control algorithm was performed in accordance with the YTTRIUM method7. Brain age was predicted using the XGBoost algorithm implemented in Julia8, using the baseline data from all participants (n=3005) as training set. BAG was computed as the difference between true and predicted age, and the resulting BAG values were bias corrected using linear models9. The groups were compared using linear model, Pearson correlation and mean absolute error values. For the linear regressions we used cocor10 criterion for a comparison. In order to avoid a strong statistical bias for HC predictions, we used a few subgroups of randomly selected 329 subjects from 2676 participants at the second scanning time.Results
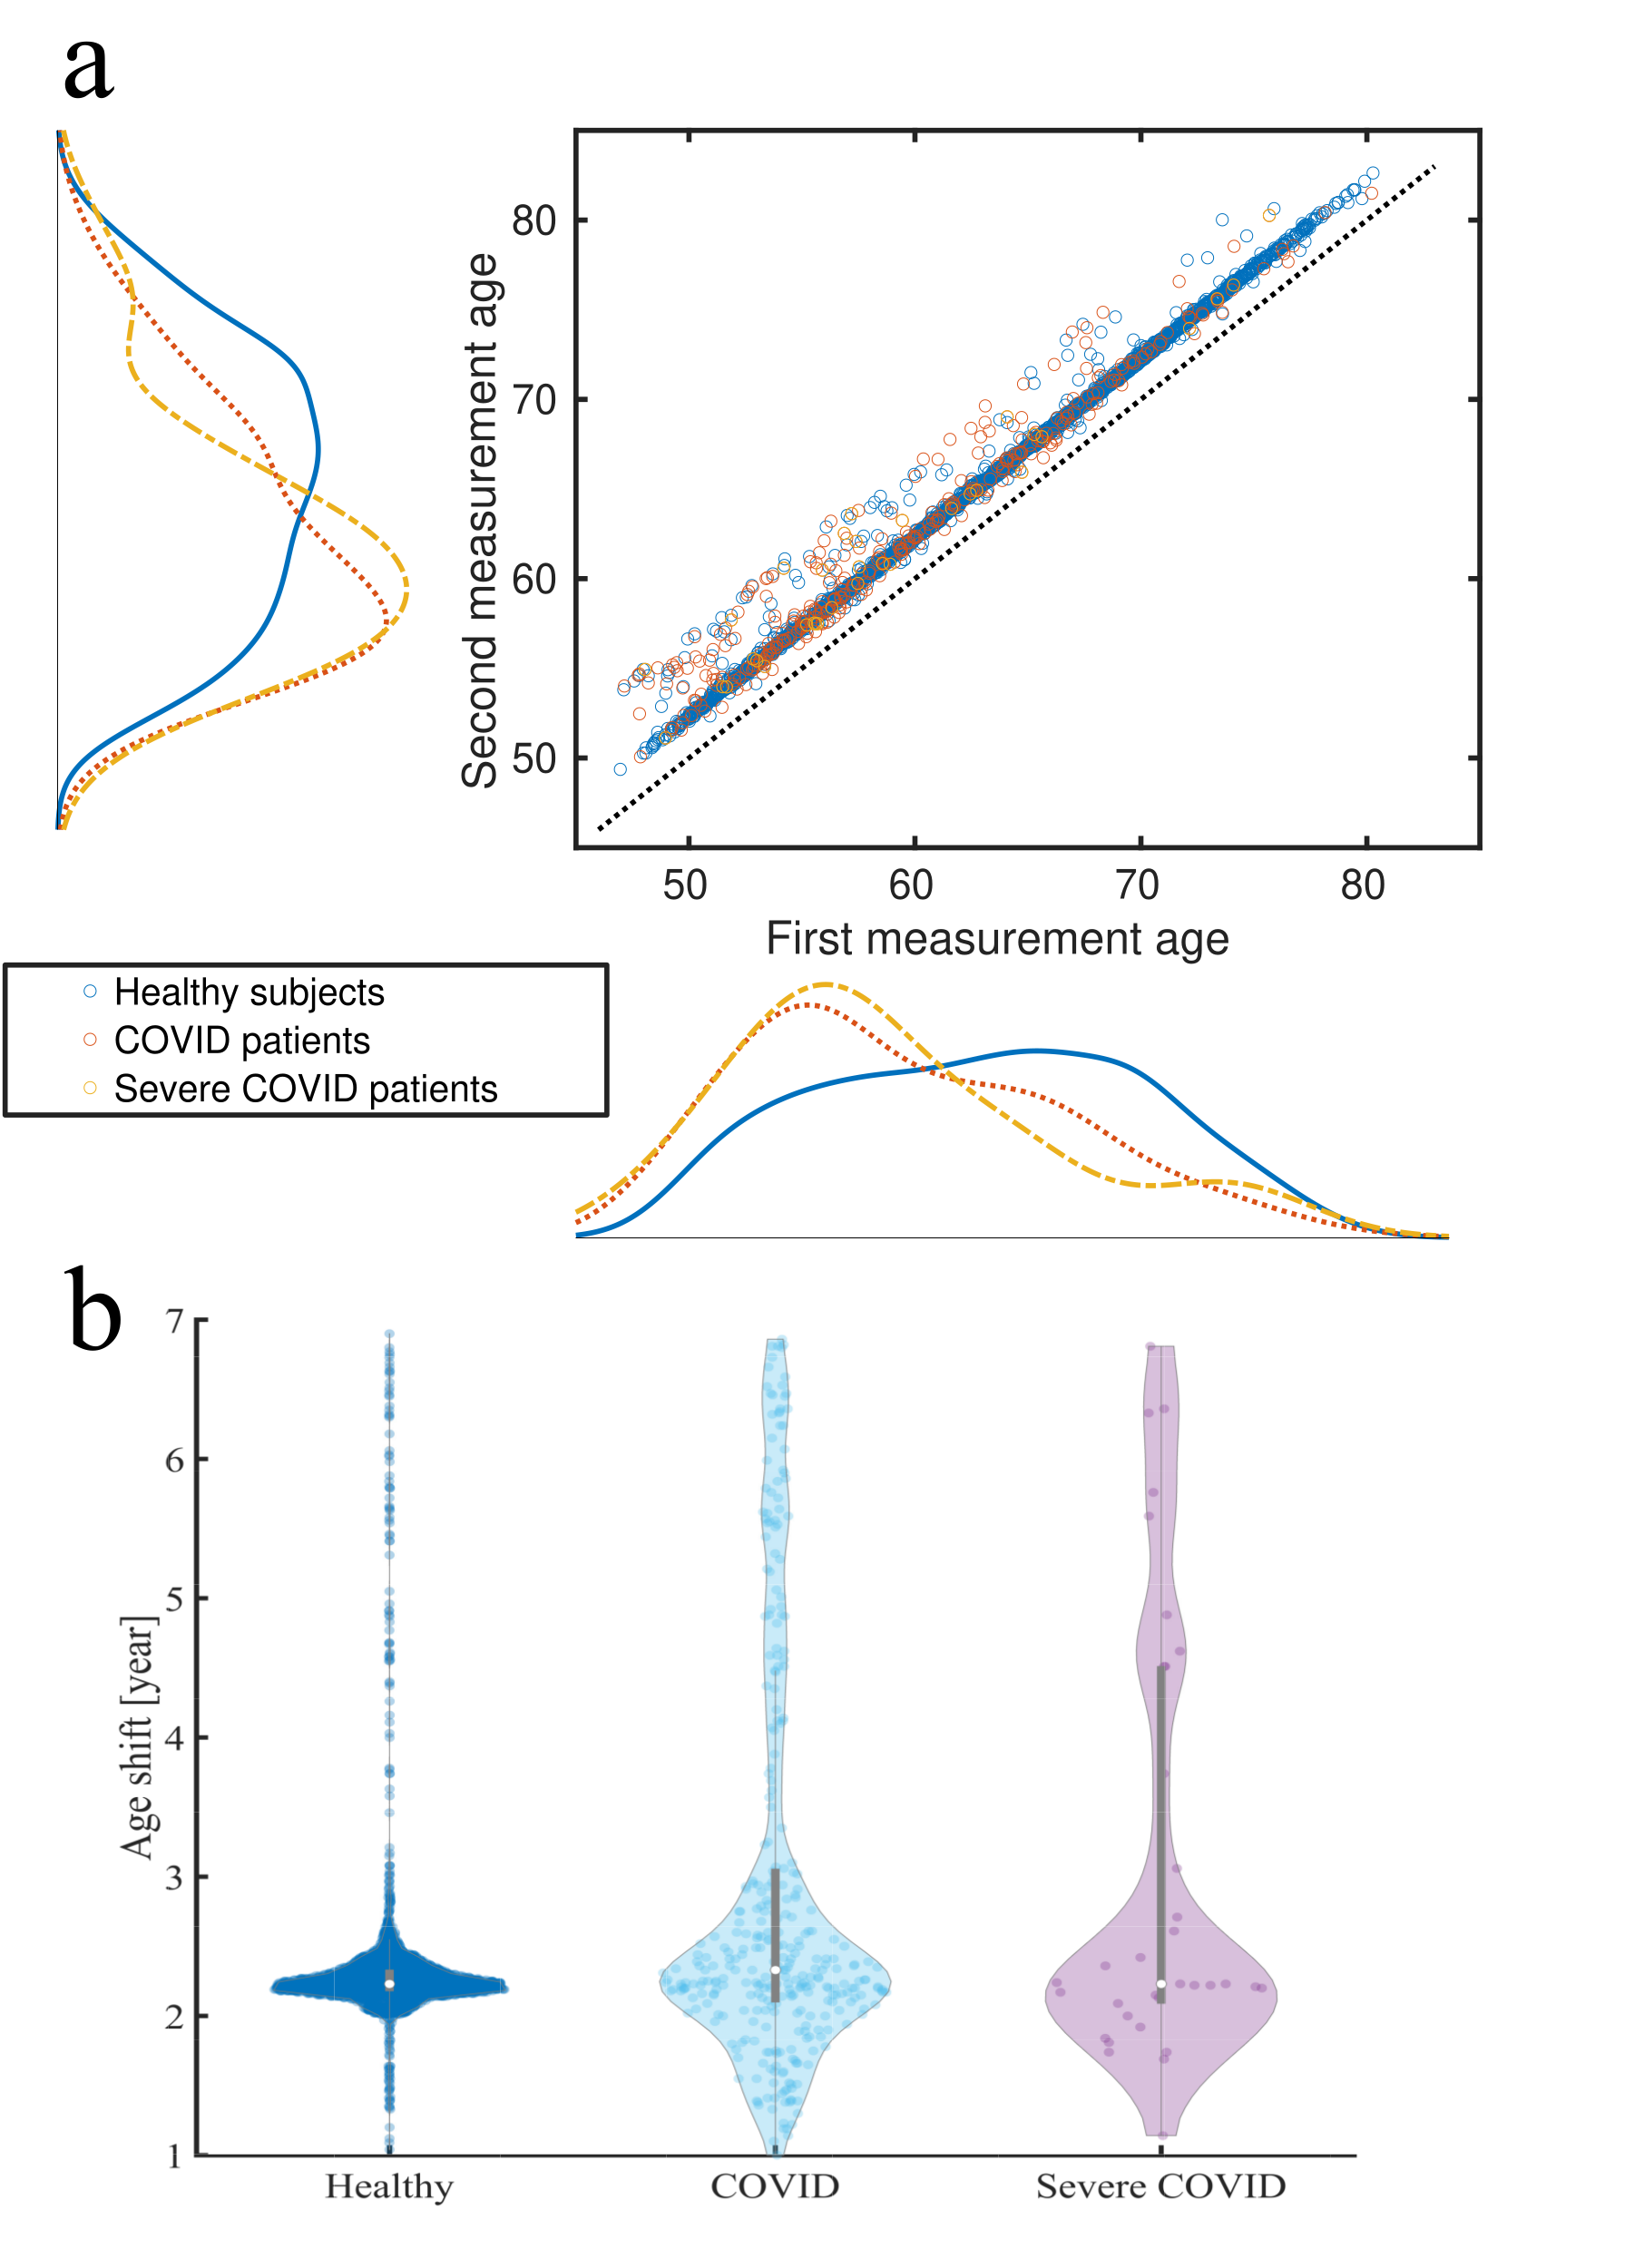
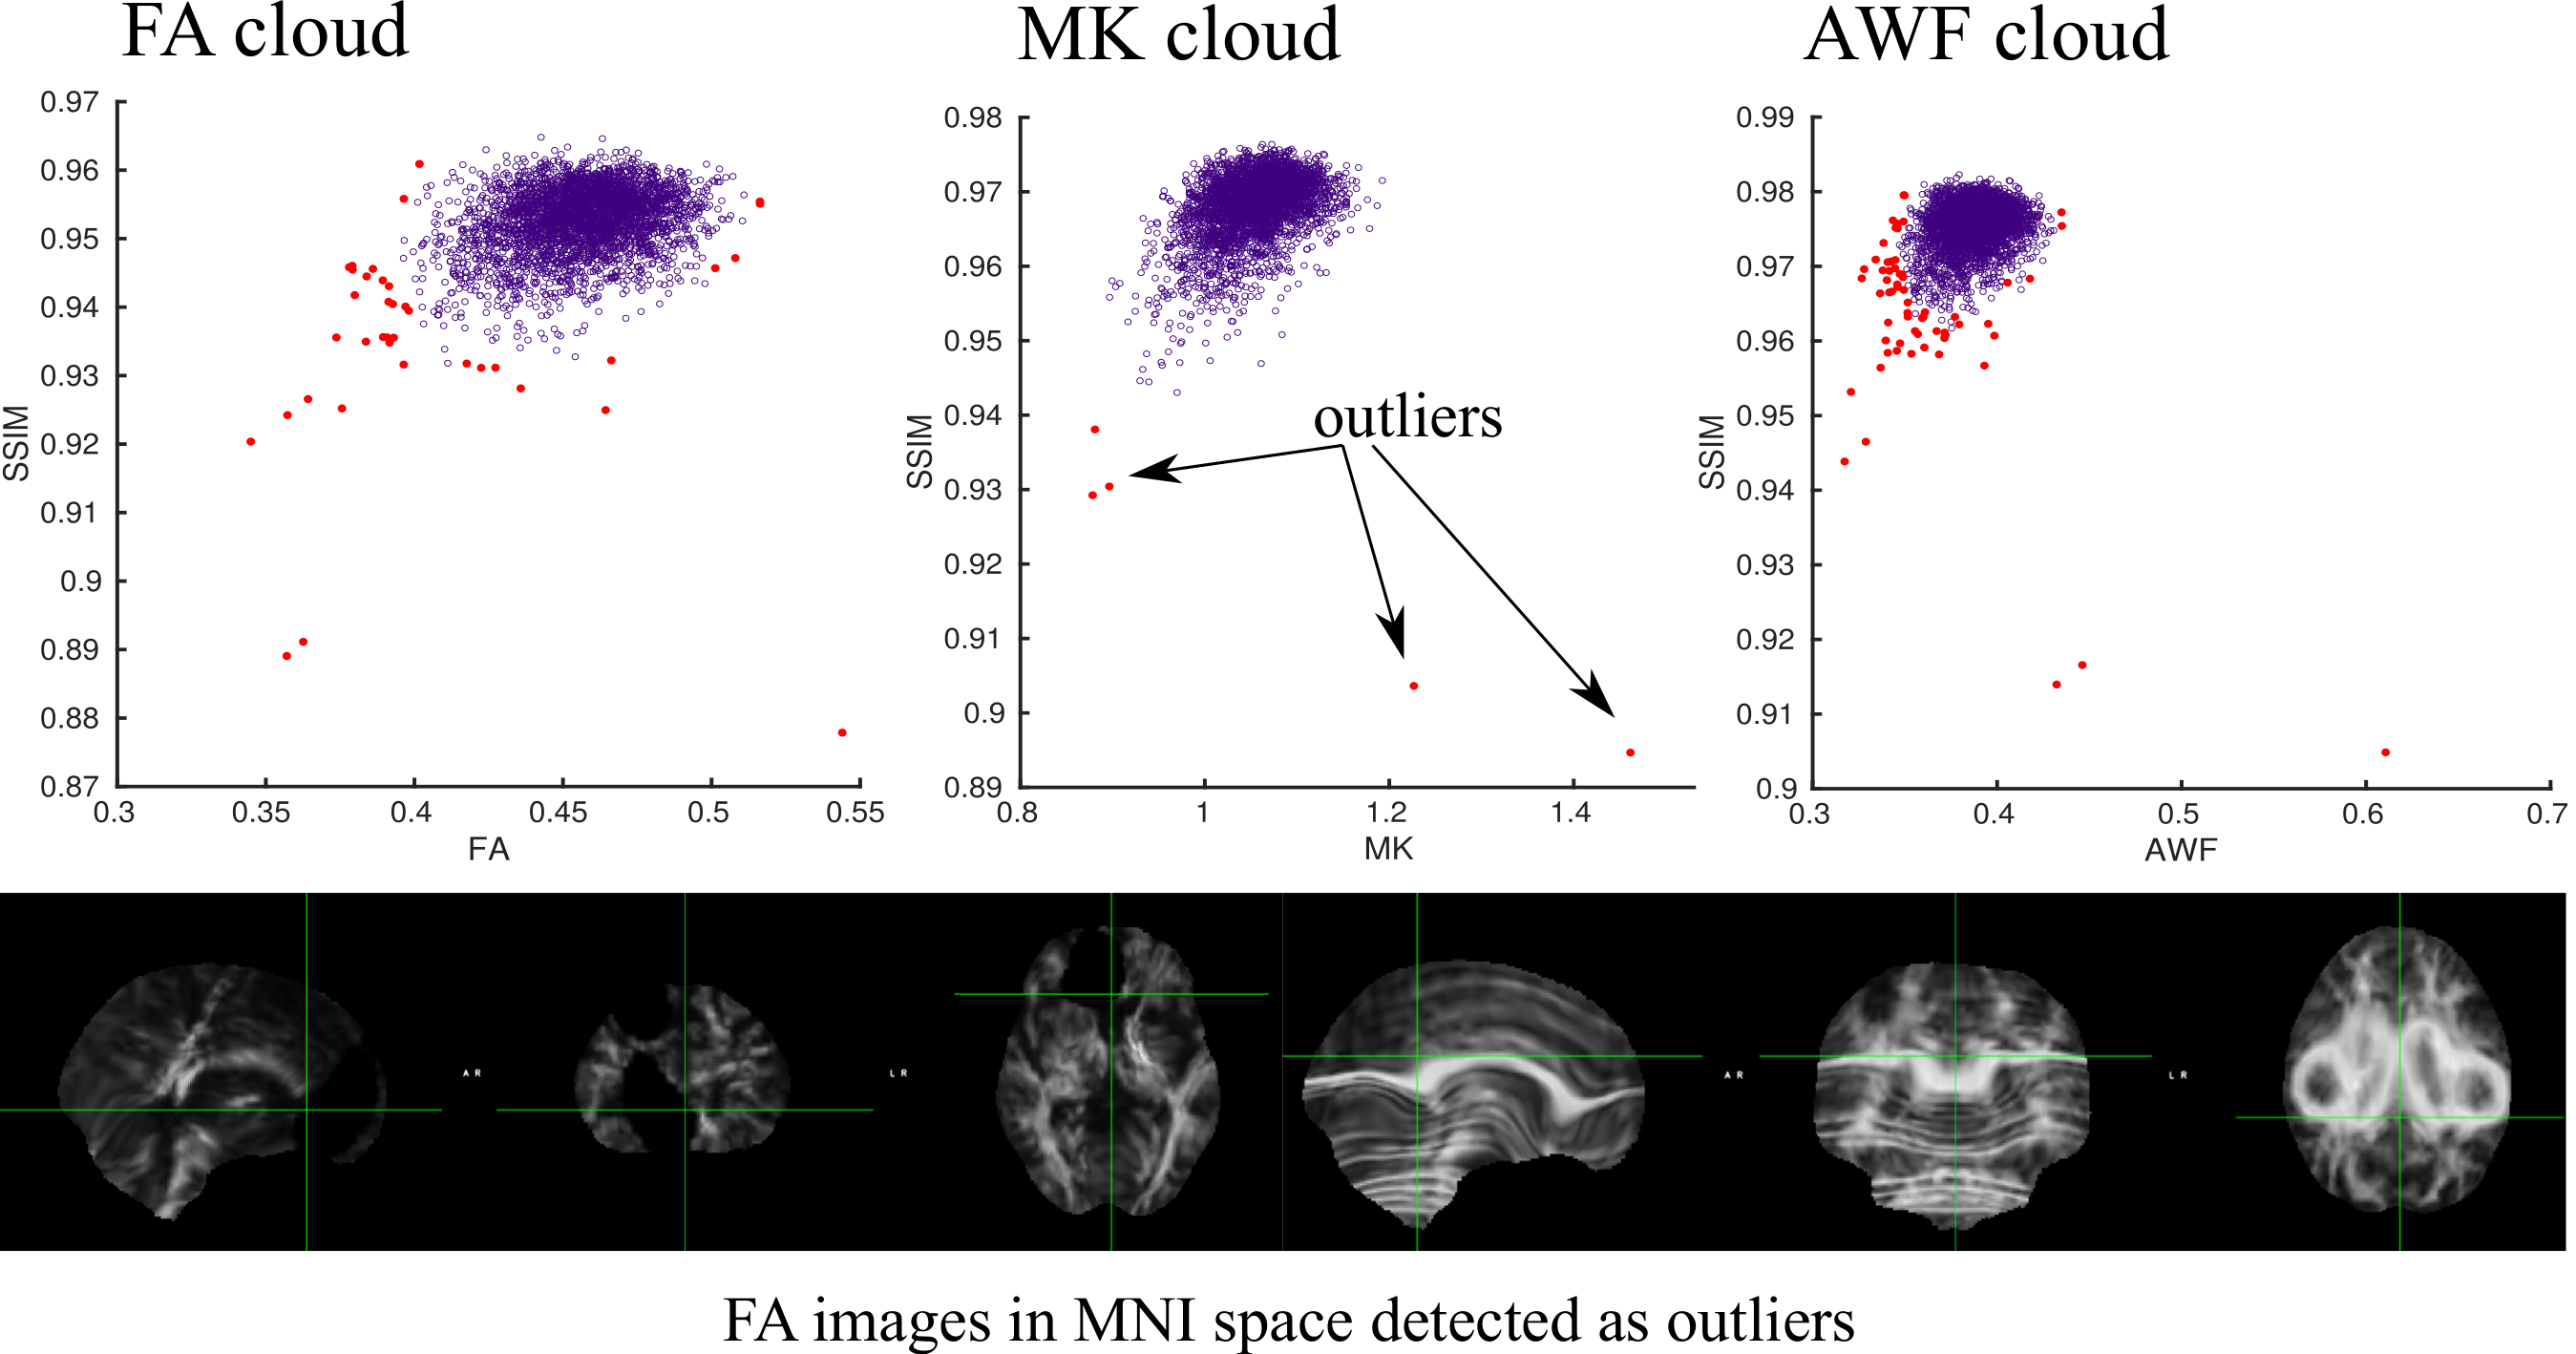
Fig. 1 shows age distributions at each time point for the three groups. Fig. 2 displays the results of the YTTRIUM algorithm for three diffusion metrics (FA, MK and AWF) and an example of the detected outliers. Fig. 3 shows scatter plots of diffusion metrics for the first and second scan and their corresponding age slopes derived from linear regressions. We found that, for the FA and MK metrics, the difference between linear regression lines for HC and COVID patients are significant (p < 10-5) (evaluated by cocor function10). In Fig. 4 we presented the results of XGBoost predictions for three groups: HC, COVID patients and COVID SEVERE patients. For a comparison, we presented the scatter plots with age differences between two scan times as well.Discussion and Conclusion
In the present work we assessed longitudinal changes in brain white matter microstructure in relation to COVID-19 infection. The results showed a significant global WM brain changes for COVID patients in contrast to the age associated maturation of the healthy participants. Diffusion metrics such as FA and MK are sensitive to WM changes, however, it could not shed light on a reason of such changes. In Fig. 3, we found that linear correlations between two MRI scan times are significantly different between those with and without COVID positive test results. At the same time, uncorrected BAG analysis and its linear regression exhibited the difference but without statistical significance, see Fig. 4. Moreover, the chronological age difference suggests that the most part of the participants have been scanned with 2 years shift, i.e. at the time shorter than mean absolute error of XGBoost predictions. Thus, we definitely could detect the WM brain changes after the COVID-19, however, localisation and specificity of the undergoing changes demand new data with higher statistical power. As a conclusion, we expect that an application of deep learning techniques might increase a sensitivity of the BAG analysis and provides an anatomical explanation of possible findings in accordance with advanced diffusion MRI phenotypes.Acknowledgements
This research has been conducted using the UK Biobank under Application 27412. The work was performed on the Service for Sensitive Data (TSD) platform, owned by the University of Oslo, operated and developed by the TSD service group at the University of Oslo IT-Department (USIT). Computations were also performed using resources provided by UNINETT Sigma2 – the National Infrastructure for High Performance Computing and Data Storage in Norway.References
1. Douaud at al., Brain imaging before and after COVID-19 in UK Biobank. MedRxiv: https://doi.org/10.1101/2021.06.11.21258690
2. Maximov et al., Towards an optimised processing pipeline for diffusion magnetic resonance imaging data: Effects of artefact corrections on diffusion metrics and their age associations in UK Biobank. Human Brain Mapping 40 (2019) 4146.
3. Fieremans et al., White matter characterization with diffusional kurtosis imaging. Neuroimage 58 (2011) 177.
4. Kaufmann et al., Common brain disorders are associated with heritable patterns of apparent aging of the brain. Nature Neuroscience 22 (2019) 1617.
5. Alfaro-Almagro et al., Image processing and Quality Control for the first 10,000 brain imaging datasets from UK Biobank. Neuroimage 166 (2016) 400.
6. Smith et al., Tract-based spatial statistics: voxelwise analysis of multi-subject diffusion data. Neuroimage 31 (2006) 1487.
7. Maximov et al., Fast qualitY conTrol meThod foR derIved diffUsion Metrics (YTTRIUM) in big data analysis: U.K. Biobank 18,608 example. Human Brain Mapping 42 (2021) 3141.
8. Tianqu and Guestrin. XGBoost: A Scalable Tree Boosting System. Proceedings of the 22nd ACM SIGKDD International Conference on Knowledge Discovery and Data Mining. 2016.
9. de Lange and Cole. Commentary: Correction procedures in brain-age prediction. Neuroimage: Clinical 26 (2020) 102229.
10. Diedenhoff et al., cocor: A Comprehensive Solution for the Statistical Comparison of Correlations. PLOS One 10 (2015) e0131499.
Figures