2202
Global network disruption in focal to bilateral tonic-clonic seizures.1Brain and Mind Centre, The University of Sydney, Sydney, Australia, 2School of Biomedical Engineering, Faculty of Engineering, University of Sydney, Sydney, Australia, 3Sydney Neuroimaging and Analysis Centre, Sydney, Australia, 4Department of Neurology, Royal Prince Alfred Hospital, Sydney, Australia, 5ARC Centre for Innovative Bioengineering, The University of Sydney, Sydney, Australia
Synopsis
Focal to bilateral tonic-clonic seizures (FBTCS) are a feature of focal epilepsy, characterised by seizures that spread contralaterally to the origin of ictal discharge. Widespread global network disruption has been shown in patients with FBTCS compared to those with focal epilepsy. A structure-function relationship has been proposed, suggesting the role of the underlying subcortical structures in network alterations. Disease duration has been associated with whole-brain network disruption. Global network disruption may be a subtle marker in differentiating the likelihood of developing FBTCS, allowing treatment to be tailored.
Introduction
Focal to bilateral tonic-clonic seizures (FBTCS) are a feature of focal epilepsy, characterised by ictal discharge that spreads contralateral to the ictal origin. Widespread global network disruption has been shown in patients with focal epilepsy1,2. The selective networks and cortical structures engaged in seizure spread is unclear. A structure-function relationship has been proposed, suggesting the role of the underlying subcortical structures in network alterations. Disease duration has been correlated with whole brain network disruption in focal epilepsy, yet its role remains unclear for those with FBTCS. The current study examined the integrity of the structural connectome of whole-brain white matter fibers in a clinically diagnosed cohort of patients with focal epilepsy and FBTCS.Methods
Twenty-five patients with focal epilepsy (17 with FBTCS) were scanned using a 3T scanner (GE Medical Systems, Milwaukee, WI). The imaging protocol included pre-contrast 3D high-resolution T1-weighted image (0.7mm isotropic, TE/TI/TR=2.8/900/7.1 ms, flip angle=12°); and a single-shell axial diffusion-weighted image (voxel size 2 mm isotropic, TE/TR=85/8325 ms, b=1000 s/mm2 with 64 directions and two b=0 s/mm2 volumes). An additional b0 DWI image with reverse-phase encoding was conducted to correct for distortions. Anatomical T1 images were processed and segmented into 84 nodes (Desikan-Killiany atlas3) using the standard recon-all pipeline in FreeSurfer4. Additionally, a 5-tissue-type image (HSVS5 algorithm) was generated using the processed T1 images. The parcellation image and 5-tissue-type image were registered to the mean b0 diffusion image. Diffusion processing was conducted using MRtrix36 and included standard DWI pre-processing (denoising, unringing, motion and distortion correction, and bias field correction), followed by response function estimation (dhollander7 algorithm) and multi-shell multi-tissue constrained-spherical-deconvolution to estimate the fibre orientation distribution in each voxel8. Ten million whole-brain streamlines were generated (iFOD29 algorithm) and filtered using SIFT210. The ten million streamlines and corresponding SIFT2 weights were used to create a weighted-undirected structural connectome using the registered Desikan-Killiany parcellation image. The following graph theory metrics were measured from connectomes using the Brain Connectivity Toolbox11: global efficiency, characteristic path length, betweenness centrality, strength, network degree, clustering coefficient, transitivity and density.Chi square tests were conducted to test for groups differences in age and disease duration. To test for group differences in brain network connectivity, analysis of covariance tests were conducted, with age and disease duration included as covariates (which are known to effect connectivity measures12).
Results
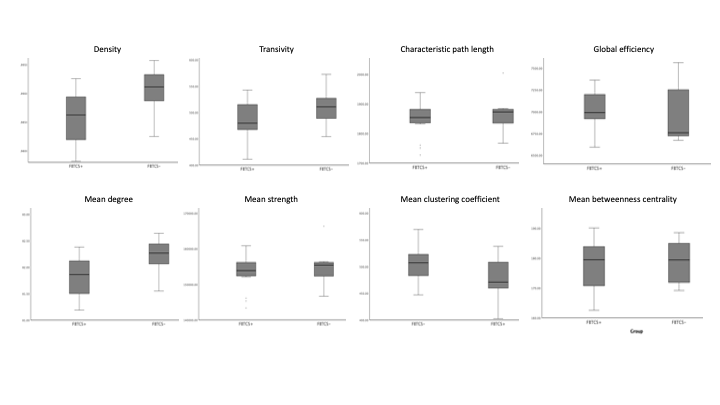
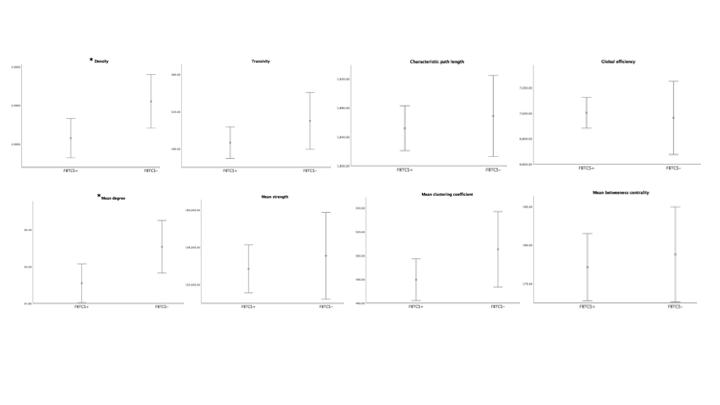
The patient groups were matched in age, and disease duration (p<0.05). Figure 1 shows the range for each network connectivity metric. When adding age and disease duration as a covariate, on average, density and mean degree were smaller in patients with FBTCS compared to patients without FBTCS (p=0.029 and p=0.029 respectively, Figure 2). Age and disease duration did not significantly impact the group differences in the model.Discussion and Conclusion
Our finding of altered mean network degree is concomitant with previous epilepsy research. Reduced global network degree can infer overall weak or spurious connections in an otherwise effective functional network11. In FBTCS, disrupted networks have been reported in circuits associated with information relay13. The role of network degree and density has been reported in focal epilepsy, where an increased network density confers a fully connected network2. In our patient cohort it is unclear whether the lower mean network degree and density in the FBTCS group is due to pathology or an adaptive mechanism to avert seizures. Our finding presents a potential marker for susceptibility to FBTCS, which further research could help elucidate.Acknowledgements
The authors thank the staff at the RPAH and i-Med Radiology for their assistance with this study. The authors would like to acknowledge the contributions from UCB Australia Pty Ltd.References
1. Sinha, N., Peternell, N., Schroeder, G. M., de Tisi, J., Vos, S. B., Winston, G. P., ... & Taylor, P. N. (2021). Focal to bilateral tonic–clonic seizures are associated with widespread network abnormality in temporal lobe epilepsy. Epilepsia, 62(3), 729-741.
2. Pedersen, M., Omidvarnia, A. H., Walz, J. M., & Jackson, G. D. (2015). Increased segregation of brain networks in focal epilepsy: an fMRI graph theory finding. NeuroImage: Clinical, 8, 536-542.
3. Desikan RS, Ségonne F, Fischl B, et al. An automated labeling system for subdividing the human cerebral cortex on MRI scans into gyral based regions of interest. NeuroImage. 2006;31(3):968-980
4. Fischl B. (2012). FreeSurfer. NeuroImage, 62(2), 774–781. https://doi.org/10.1016/j.neuroimage.2012.01.021
5. Smith, R.; Skoch, A.; Bajada, C.; Caspers, S.; Connelly, A. Hybrid Surface-Volume Segmentation for improved Anatomically-Constrained Tractography. In Proc OHBM 2020
6. Tournier J-D, Smith R, Raffelt D, et al. MRtrix3: A fast, flexible and open software framework for medical image processing and visualisation. NeuroImage. 2019;202:116137.
7. Dhollander, T.; Raffelt, D. & Connelly, A. Unsupervised 3-tissue response function estimation from single-shell or multi-shell diffusion MR data without a co-registered T1 image. ISMRM Workshop on Breaking the Barriers of Diffusion MRI, 2016, 5
8. Jeurissen, B; Tournier, J-D; Dhollander, T; Connelly, A & Sijbers, J. Multi-tissue constrained spherical deconvolution for improved analysis of multi-shell diffusion MRI data. NeuroImage, 2014, 103, 411-426
9. Tournier, J.-D.; Calamante, F. & Connelly, A. Improved probabilistic streamlines tractography by 2nd order integration over fibre orientation distributions. Proceedings of the International Society for Magnetic Resonance in Medicine, 2010, 1670
10. Smith, R. E.; Tournier, J.-D.; Calamante, F. & Connelly, A. SIFT2: Enabling dense quantitative assessment of brain white matter connectivity using streamlines tractography. NeuroImage, 2015, 119, 338-351
11. Rubinov, M., & Sporns, O. (2010). Complex network measures of brain connectivity: uses and interpretations. NeuroImage, 52(3), 1059-1069.
12. Park, K. M., Lee, B. I., Shin, K. J., Ha, S. Y., Park, J., Kim, S. E., & Kim, S. E. (2019). Pivotal role of subcortical structures as a network hub in focal epilepsy: evidence from graph theoretical analysis based on diffusion-tensor imaging. Journal of Clinical Neurology, 15(1), 68-76.
13. Blumenfeld H, Varghese GI, Purcaro MJ, Motelow JE, Enev M, McNally KA, et al. Cortical and subcortical networks in human secondarily generalized tonic–clonic seizures. Brain. 2009;132:999–1012.
Figures