2200
Thalamic and cortical input layers in the somatomotor cortex detected by laminar fMRI in non-human primates at 7T1IBS Center for Neuroscience Imaging Research, Sungkyunkwan University, Suwon, Korea, Republic of, 2Department of Biomedical Engineering, Sungkyunkwan University, Suwon, Korea, Republic of
Synopsis
Laminar fMRI has been increasingly used in humans, but its validity needs to be thoroughly confirmed in primate brains. Here, we investigated thalamic and cortical inputs to the somatomotor cortex in the rhesus monkey by adopting tactile stimulation and electrical microstimulation. Compared to 7T BOLD signals, MION-induced CBV-weighted fMRI faithfully captures input layer activities, like the sensory thalamus input to the middle layer and the dense cortical connections in the superficial layers. Taken together, our CBV-weighted fMRI signals revealed different input layers to the somatomotor cortex with high specificity and sensitivity.
Introduction
Laminar fMRI using the VASO technique in humans has proven to be robust and reliable by revealing laminar-level cognitive processing in motor, sensory, and frontal areas 1-3. However, due to cognitive complexity and experimental limitations in human studies, the signal source of laminar fMRI is unclear in primates. Due to the similarity of the functional and structural architecture of non-human primates (NHPs) with humans, extensive investigation of NHPs is an excellent alternative. Here we adopted BOLD and CBV-weighted fMRI of the somatomotor cortex in NHPs at an ultrahigh field of 7 Tesla to understand the input/output structure. Tactile electrical stimulation (TES) and electrical microstimulation (EM) in the motor cortex (M1) were used to mimic the feedforward sensory thalamic and cortical inputs to the somatosensory cortex (S1), respectively.Methods
Animals and experimental procedureWe used three healthy rhesus monkeys (Macaca mulatta, male, 9-12 kg, 9-11 years), conforming with the guidelines of the IACUC. The monkey was anesthetized and maintained with 1% isoflurane during scanning. MION (10 mg/kg, monocrystalline iron oxide nanoparticle) injection was conducted after BOLD fMRI runs in most sessions.
Electrical microstimulation and tactile stimulation
We used the customized MR-compatible microdrive system to conduct an EM fMRI experiment 4. Briefly, after making a hole at the skull with a hand drill at the beginning of each daily session, the electrodes were inserted into M1 that controls muscles of the lower arm. EM schedule consisted of 13 EM blocks, and each EM stimulation lasted 30 sec accompanied by 30 sec of a no-stimulation period 5. The biphasic currents of 130 Hz with 400 µsec duration were used for EM (current amplitude, 500 µA). TES was delivered with the pad electrodes that were attached to the lower arm. Onset and offset of stimulation were synchronized with the TTL pulses of the MR scanner.
MRI
Brain images were acquired with a 28-channel knee coil on a MAGNETOM 7T scanner (Siemens Healthcare). BOLD and MION-enhanced CBV fMRI signals were acquired by the multiband gradient-echo (GRE) echo-planar imaging (EPI) sequence with the generalized autocalibrating partially parallel acquisition technique (GRAPPA =3, TR = 2000 msec, TE = 26 msec, 0.6 x 0.6 x 0.7 mm3 resolution). Slices were tilted at 20-30° to the coronal plane to obtain orthogonally positioned images of the somatomotor cortical layers. T2*-weighted gradient echo images (GRE) were also acquired with the same geometric parameters as the functional images for distortion correction (TR = 2000 msec, TE = 4.29/8.64 msec).
Data analysis
Functional images were analyzed using AFNI, FSL, and LAYNII 6. Image preprocessing includes bias field correction using B0 field maps, motion correction, and high-pass temporal filtering. Statistical analyses were performed by fitting a general linear model with a predictor for the stimulation, six motion parameters, and removal of linear trends. All data analysis, including initial masking, was performed at an individual session. S1 and M1 ROIs were drawn manually using GRE images, and layers were calculated with the LAYNII program.
Results
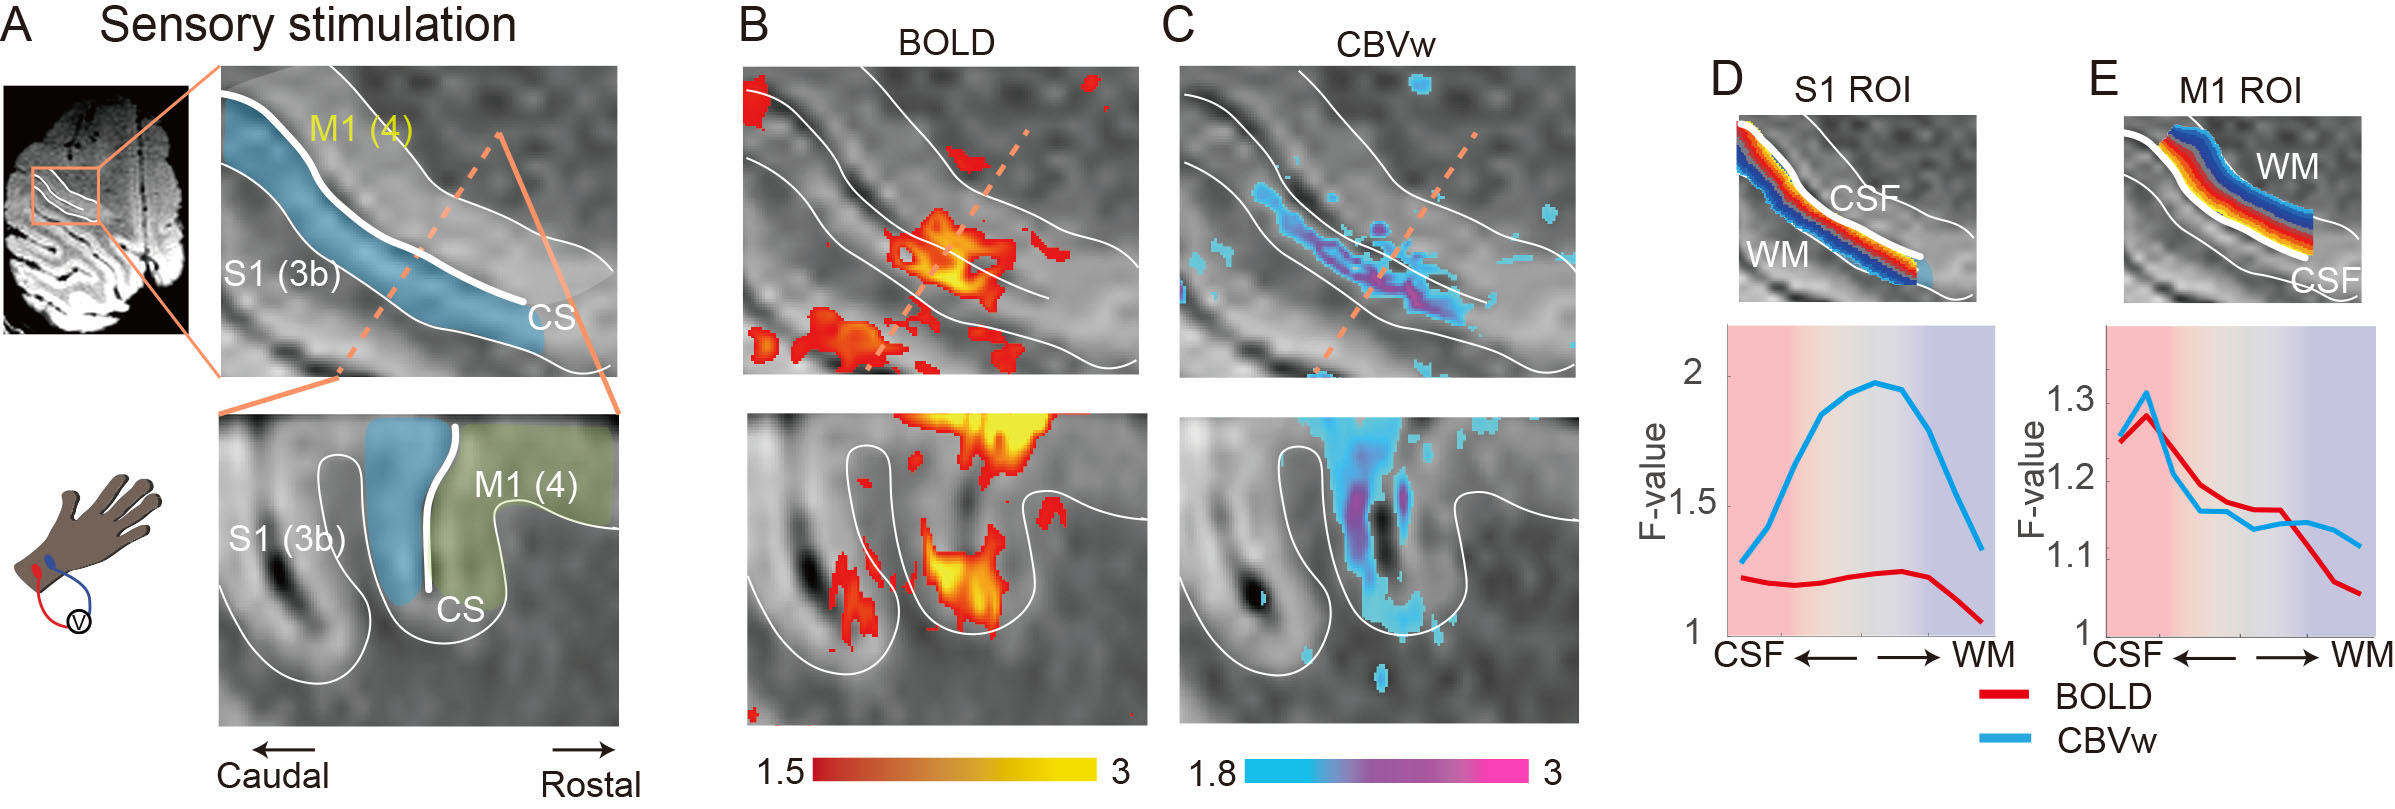
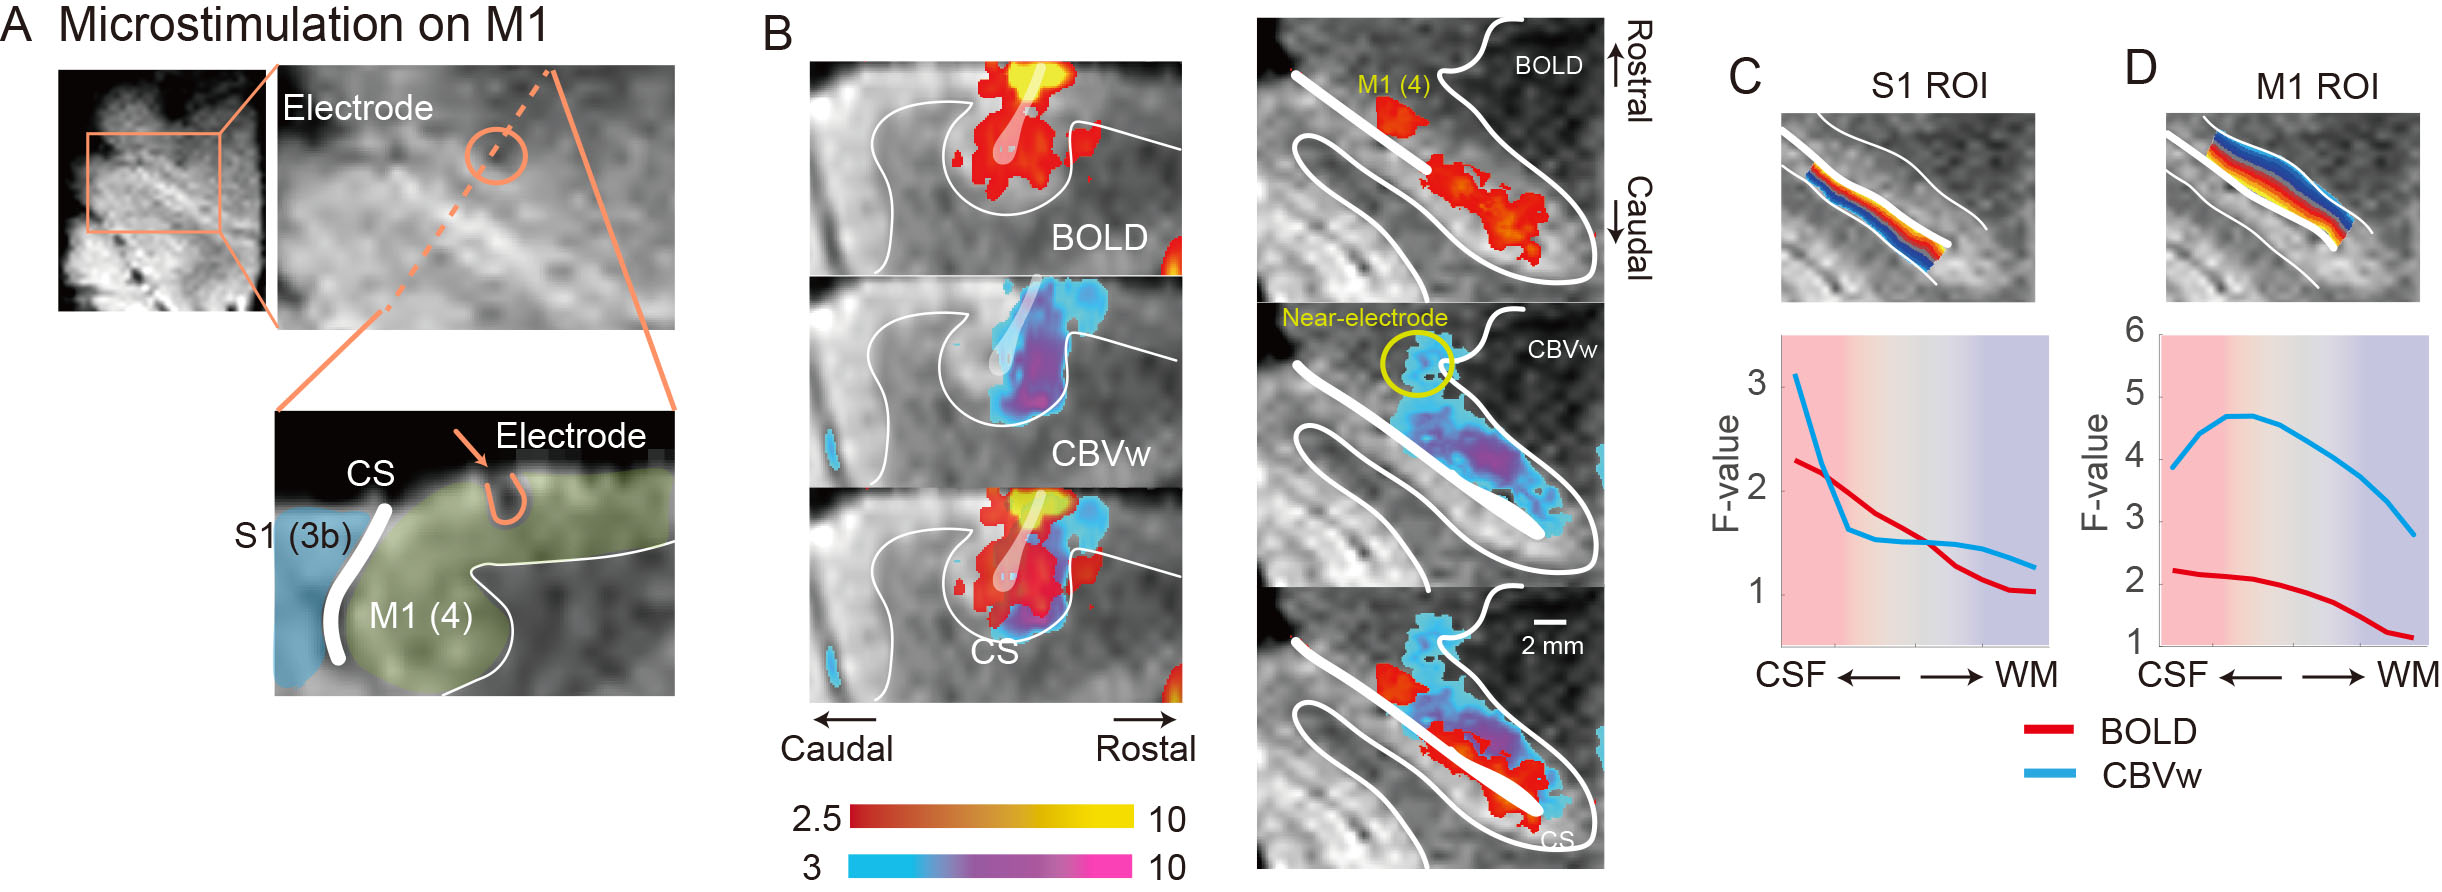
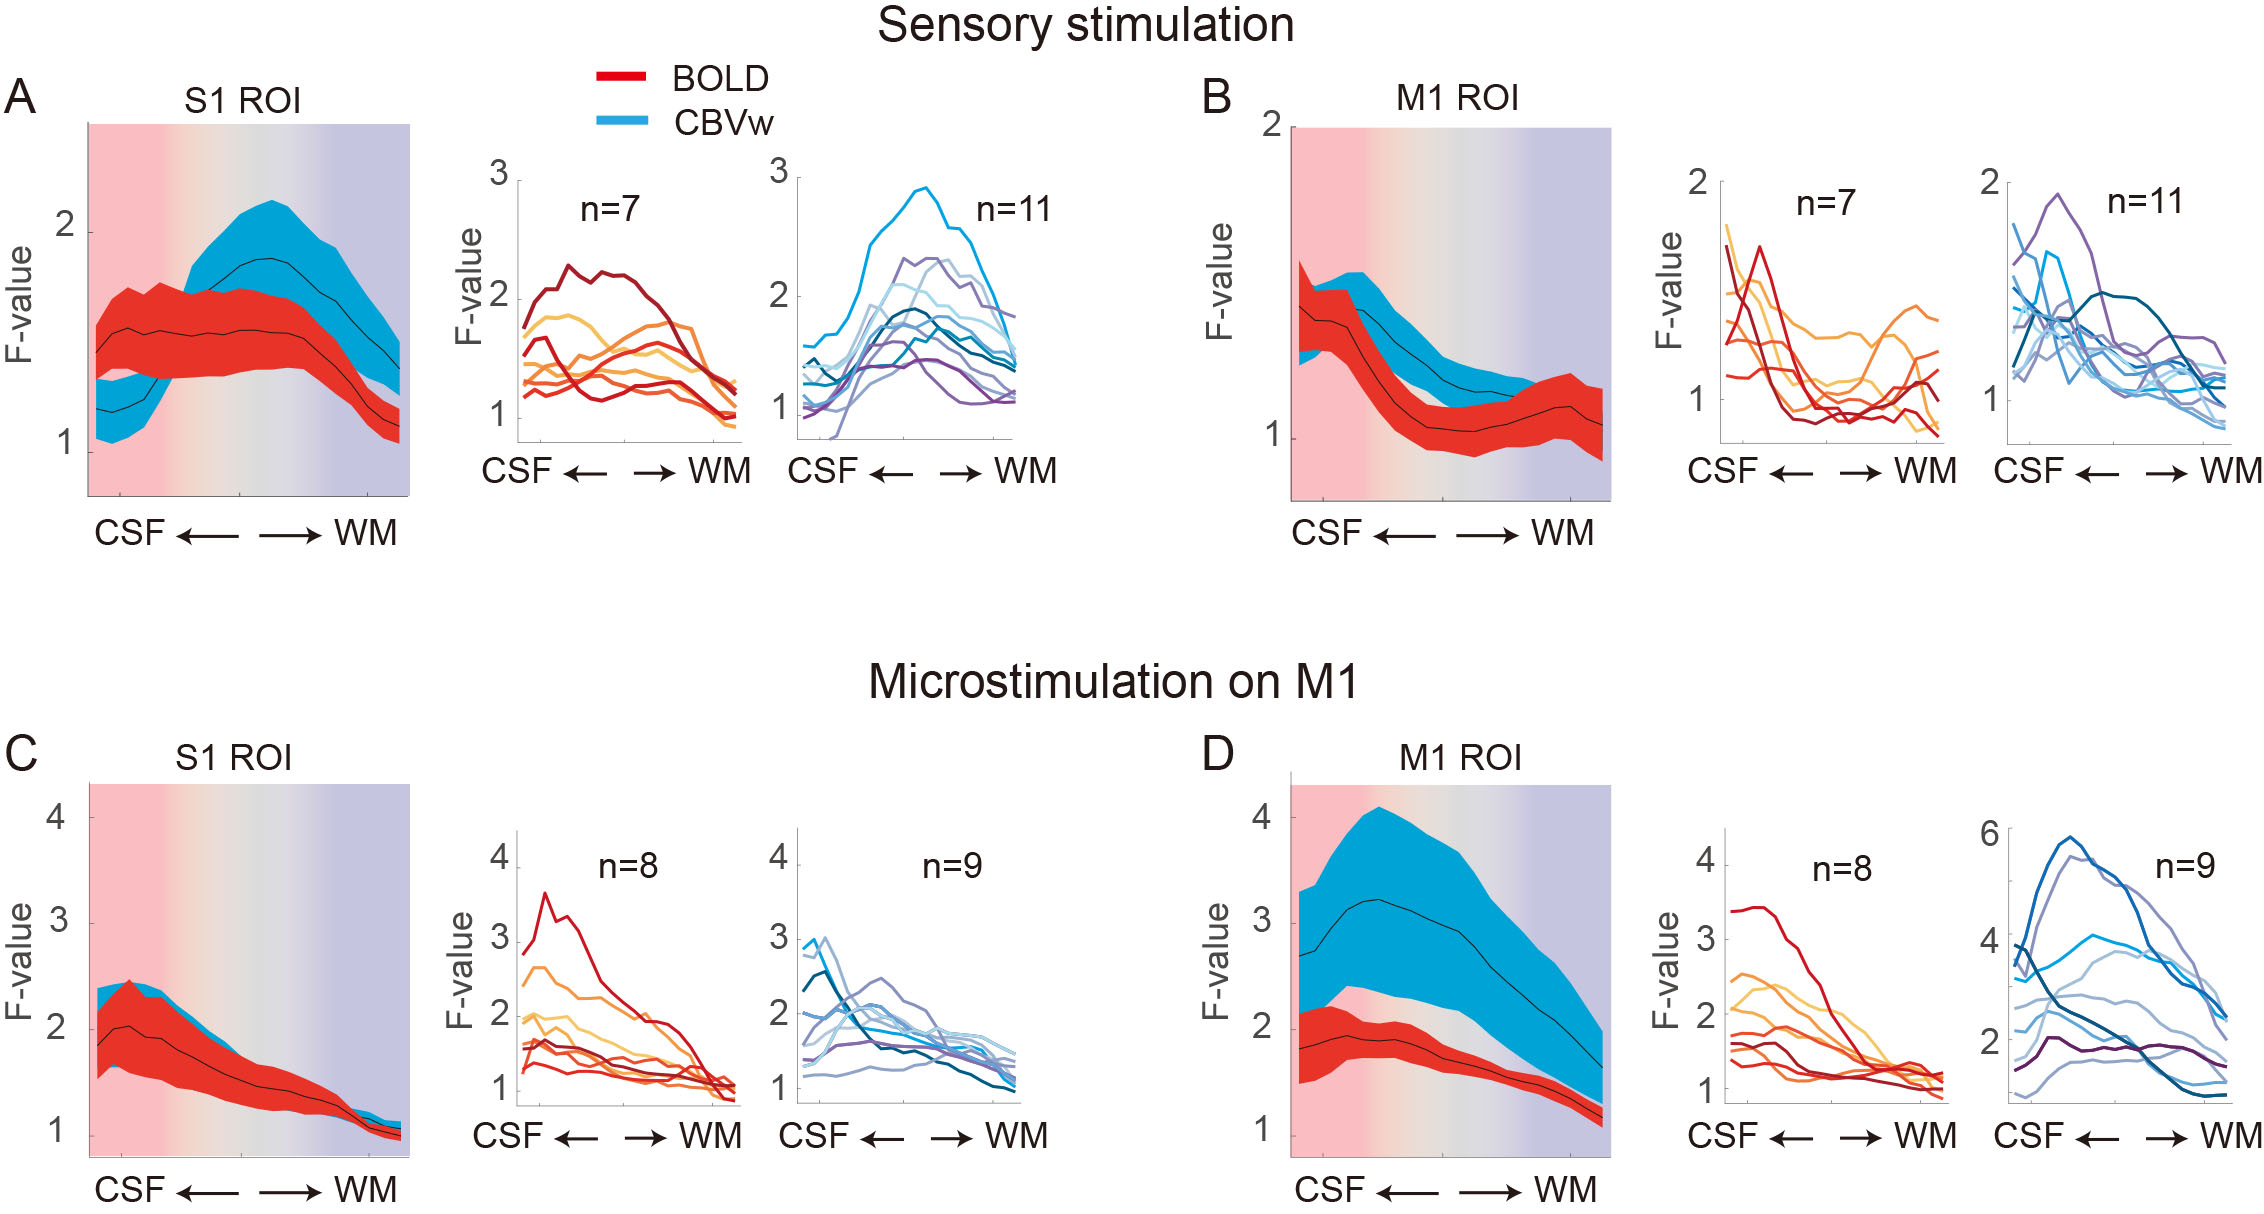
To investigate thalamic laminar input to S1, TES was applied on the arm of NHPs. Sixty-four percent of tactile data (7 out of 11) have both BOLD (n=7) and CBV (n=11) runs from the same session (Fig. 3A &3B). The group averages of CBV signals for the layer profiles (Fig. 3A) show middle-layer centered activation profiles in all data (see the individual example maps in Figure 1C&1D). In comparison, flat activation between the superficial and middle layers was observed in BOLD sessions (5 out of 7) (Fig. 3A; Fig. 1B&1D). The superficial layer activity is likely due to the draining effects of BOLD signals.EM on M1, which would convey M1 signal to S1, led to superficial layer activation of S1 regardless of the measurements (BOLD, n=8; CBV, n=9) (Fig. 2B&2C, 3C). About 89 % of sessions (8 out of 9) had both BOLD and CBV data. Similarly, TES evoked activation in the superficial layers of M1 (Fig. 1E), suggesting somatic information transfer in the superficial layer of M1. It should be noted that the size of M1 activation by EM was greater than the expected passive current spread (r=0.62 mm, K=1292 µA/mm2) 7,8. Thus, the EM-induced M1 activation might represent the responses by the intrinsic intra-cortical connection. There was a noteworthy difference in M1 activation between BOLD and CBV measurements (Fig. 3D). Monotonic decreases of BOLD signal from the superficial to deeper layers can be contrasted to CBV signals, in which most CBV peak responses were observed around layers of II and III. Considering the dense synaptic connection of superficial layers within M1, intrinsic functional relation was localized with CBV fMRI 9.
Disscustion & Conclusion
Considering the established anatomical knowledge, like the sensory thalamic input to the middle layer and the dense cortical connections in the superficial layers, our CBV-fMRI results revealed the different input sources to the S1 or M1. The high specificity and sensitivity of MION-induced CBV measurement were due to its high sensitivity to small vessels adjacent to active neurons 10. The results also support the recent human layer studies using CBV-weighted VASO fMRI measurement. CBV-weighted fMRI would provide valuable insights into cortical processes by layers.Acknowledgements
This work was supported by the Institute of Basic Science (IBS-R015-D1).References
1 Huber, L. et al. High-Resolution CBV-fMRI Allows Mapping of Laminar Activity and Connectivity of Cortical Input and Output in Human M1. Neuron 96, 1253-1263 e1257, doi:10.1016/j.neuron.2017.11.005 (2017).
2 Yu, Y. et al. Layer-specific activation of sensory input and predictive feedback in the human primary somatosensory cortex. Sci Adv 5, eaav9053, doi:10.1126/sciadv.aav9053 (2019).
3 Finn, E. S., Huber, L., Jangraw, D. C., Molfese, P. J. & Bandettini, P. A. Layer-dependent activity in human prefrontal cortex during working memory. Nature Neuroscience 22, 1687-+, doi:10.1038/s41593-019-0487-z (2019).
4 Baeg, E. et al. MRI Compatible, Customizable, and 3D Printable Microdrive for Neuroscience Research. eNeuro, doi:10.1523/ENEURO.0495-20.2021 (2021).
5 Han, M. J. et al. Mapping functional gradients of the striatal circuit using simultaneous microelectric stimulation and ultrahigh-field fMRI in non-human primates. Neuroimage 236, 118077, doi:10.1016/j.neuroimage.2021.118077 (2021).
6 Huber, L. R. et al. LayNii: A software suite for layer-fMRI. Neuroimage 237, 118091, doi:10.1016/j.neuroimage.2021.118091 (2021).
7 Tehovnik, E. J. Electrical stimulation of neural tissue to evoke behavioral responses. Journal of Neuroscience Methods 65, 1-17, doi:Doi 10.1016/0165-0270(95)00131-X (1996).
8 Tolias, A. S. et al. Mapping cortical activity elicited with electrical microstimulation using FMRI in the macaque. Neuron 48, 901-911, doi:10.1016/j.neuron.2005.11.034 (2005).
9 Hooks, B. M. et al. Laminar analysis of excitatory local circuits in vibrissal motor and sensory cortical areas. PLoS Biol 9, e1000572, doi:10.1371/journal.pbio.1000572 (2011).
10 Kim, S. G. et al. Cerebral blood volume MRI with intravascular superparamagnetic iron oxide nanoparticles. NMR Biomed 26, 949-962, doi:10.1002/nbm.2885 (2013).
Figures