2199
Neurophysiological source of laminar fMRI1Center for Neuroscience Imaging Research (CNIR), Suwon, Korea, Republic of, 2Department of Biomedical Engineering, Sungkyunkwan University, Suwon, Korea, Republic of
Synopsis
Layer-dependent fMRI mapping provides insights to understand the directional information flow within brain networks. However, it is unknown whether larimar fMRI responses allows discrimination of activation to cortical input and/or output. To determine neuronal source of hemodynamic fMRI signals, we investigated the somatosensory-evoked laminar fMRI responses and cortical depth-dependent electrophysiological activities in the mouse cortex.
Purpose
The mapping of brain activity across cortical layers is critical to investigate laminar processing (e.g., feedforward and/or feedback pathways) for understanding the information flow within brain functional network1. Unlike widely-used gradient-echo (GE)-BOLD fMRI, CBV-weighted fMRI is specific to the neuronally active site across the cortical depths2-4. However, its underlying neurophysiological source (local field potential or multi-unit activity) is unknown. Here, we investigated whether laminar fMRI responses reflect neuronal input- or output-driven activity by comparing somatosensory-evoked laminar CBV and BOLD activity with cortical depth-dependent electrophysiological data.Materials & Methods
To examine the laminar specific fMRI responses and neural activities in somatosensory cortex of mice, three different fMRI studies were designed: 1) CBV-weighted fMRI, 2) BOLD-fMRI, and 3) multi-channel electrophysiological recordings.All fMRI experiment were performed on 15.2T with high spatial resolution of 156×156×500μm3 under ketamine-xylazine anesthesia5. CBV-weighted fMRI data (n=22 mice) were acquired using gradient echo (GE)-based imaging (FLASH) with temporal resolution of 2s (TE=3ms) after the injection of monocrystalline iron oxide nanoparticles (MION, 45 mg/kg), while BOLD-fMRI data (n=7 mice) were acquired using single-shot GE-EPI sequence with temporal resolution of 250ms (TE=11ms)6.
To investigate the neural sources of laminar specific fMRI findings, electrophysiological data (n=6 mice) were recorded using a 16-channel electrode with 50μm inter-channel spacing. The electrode was inserted into the center of S1FL predefined by CBV-weighted optical imaging to a depth of 1 mm spanning most of the cortical depth.
For somatosensory stimulation, the left forepaws of the mice were electrically stimulated with current intensity of 0.5mA, pulse width of 0.5ms, and frequency of 4Hz. Functional trial consisted of a 60-s (30s for electrophysiology) prestimulus, 20-s stimulus, 60-s interstimulus, 20-s stimulus, and 60-s (30s for electrophysiology) poststimulus period, and 15 fMRI trials (5-8 trials for electrophysiology) were obtained for signal averaging.
To measure layer-specific fMRI responses, cortical areas responding to stimulation were flattened by radially projecting 22 lines perpendicular to the cortical edges7 (Fig.1A-i). The cortical depth profiles were resampled to double using bicubic interpolation, leading to a nominal resolution of 78µm (Fig.1A-ii). Group-averaged percent change maps were calculated, and cortical profile was obtained in the primary forelimb somatosensory area (S1FL) (bluish-ROI in Fig.1A-ii). Laminar boundaries were defined as a cortical thickness distribution based on the Allen mouse brain atlas.
To extract local field potential (LFP) and multiunit activity (MUA), the extracellular recording traces were band-pass filtered (1 < f < 280Hz) and high-pass filtered (> 300Hz), respectively. Then, LFP waveforms and spike trains during stimulation were aligned with a 250-ms moving window and then averaged (Fig.2A). To determine the location of layer 4 (L4), inversion current source density (iCSD) analysis was performed with LFP waveforms (Fig.2B).
Results
In the cortical depth-dependent fMRI responses, somatosensory-evoked CBV-weighted response peaked at input layer 4 (L4) of S1FL (≈ depth of 390~546µm; Fig.1B), while BOLD response peaked at the cortical surface (Fig.1C). CBV-weighted response became increasingly specific to L4 over time (Fig.1B-ii and iii), whereas the BOLD response first appeared in L4 (Fig.1C-ii and iii).In the spatiotemporal dynamics of sensory-evoked neural activity, the synaptic inputs were observed as an evident current sink at depths of 0.4-0.56 mm from the surface (Fig.2B), indicating L4. The sensory-evoked LFPs showed the highest changes at L4 (Fig.2C), which is expected for thalamocortical inputs, while the earliest MUA responses occurred ~15ms after stimulus onset at L4 but were stronger in L5 later (Fig.2D).
To compare laminar fMRI responses with neurophysiology data, average magnitude of supragranular (L2/3), granular (L4) and infragranular (L5/6) responses were determined (Fig.3). CBV changes were the strongest at L4 (Fig.3A), which is somewhat consistent with synaptic input LFPs (Fig.3C), but not with spiking output activity MUA (Fig.3D). The BOLD changes were highest in the upper layer, where large draining veins are concentrated (Fig.3B), while the strongest MUA was observed at L5/6 (Fig.3D).
Discussion & Conclusion
We demonstrated laminar specific fMRI responses (CBV-weighted and BOLD) and cortical depth-dependent neural activity (LPF and MUA) in the mouse S1FL to investigate neuronal source of hemodynamic fMRI signals. Sensory neural information generated by forepaw stimulation are first projected through the ventral thalamus into L4 of S1FL and then rapidly spread to other layers8. In this study, somatosensory-evoked CBV responses peaked at thalamocortical input layer (L4) with high specificity over stimulus time, while early BOLD response was observed in L4, but later showed poor layer specificity on the cortical surface due to the spreading of non-specific pial vein contributions. This is consistent with previous fMRI observations that CBV responses were preferentially peaked in the layers in which synaptic activity is selectively induced, independent of the baseline blood volume3. Laminar profile of LFP showed the greatest response to sensory stimulation in L4, whereas the evoked MUA showed highest neuronal firing in L5/6, where the thick-tufted pyramidal cells are located9 and provide the major cortical output10. Since LFP and MUA reflects the input to neuronal network and spiking output, respectively11, the laminar specific CBV results suggest that the blood supply is tightly regulated by microvessels coupled to synaptic input-driven activity, rather than the output response.Acknowledgements
This work was supported by IBS-R015-D1.References
1. Lawrence SJD, Formisano E, Muckli L, de Lange FP. Laminar fMRI: Applications for cognitive neuroscience. Neuroimage. 2019;197:785-791.
2. Jin T, Kim SG. Cortical layer-dependent dynamic blood oxygenation, cerebral blood flow and cerebral blood volume responses during visual stimulation. Neuroimage. 2008;43(1):1-9.
3. Poplawsky AJ, Fukuda M, Murphy M, Kim SG. Layer-Specific fMRI Responses to Excitatory and Inhibitory Neuronal Activities in the Olfactory Bulb. J Neurosci. 2015;35(46):15263-15275.
4. Huber L, Handwerker DA, Jangraw DC, et al. High-Resolution CBV-fMRI Allows Mapping of Laminar Activity and Connectivity of Cortical Input and Output in Human M1. Neuron. 2017;96(6):1253-1263.e7.
5. Jung WB, Shim HJ, Kim SG, Mouse BOLD fMRI at ultrahigh field detects somatosensory networks including thalamic nuclei. Neuroimage. 2019;195:203-214.
6. Jung WB, Im GH, Jiang H, Kim SG. Early fMRI responses to somatosensory and optogenetic stimulation reflect neural information flow. Proc Natl Acad Sci U S A. 2021;118(11):e2023265118.
7. Shih YY, Chen YY, Lai HY, Kao YC, Shyu BC, Duong TQ. Ultra high-resolution fMRI and electrophysiology of the rat primary somatosensory cortex. Neuroimage. 2013;73:113-120.
8. Paxinos G. The rata nervous system, 4th ed. Academic press; 2014.
9. de Kock CP, Bruno RM, Spors H, Sakmann B. Layer- and cell-type-specific suprathreshold stimulus representation in rat primary somatosensory cortex. J Physiol. 2007;581(Pt 1):139-154.
10. Larkum M. A cellular mechanism for cortical associations: an organizing principle for the cerebral cortex. Trends Neurosci. 2013;36(3):141-151.
11. Logothetis NK, Pauls J, Augath M, Trinath T, Oeltermann A. Neurophysiological investigation of the basis of the fMRI signal. Nature. 2001;412(6843):150-157.
Figures
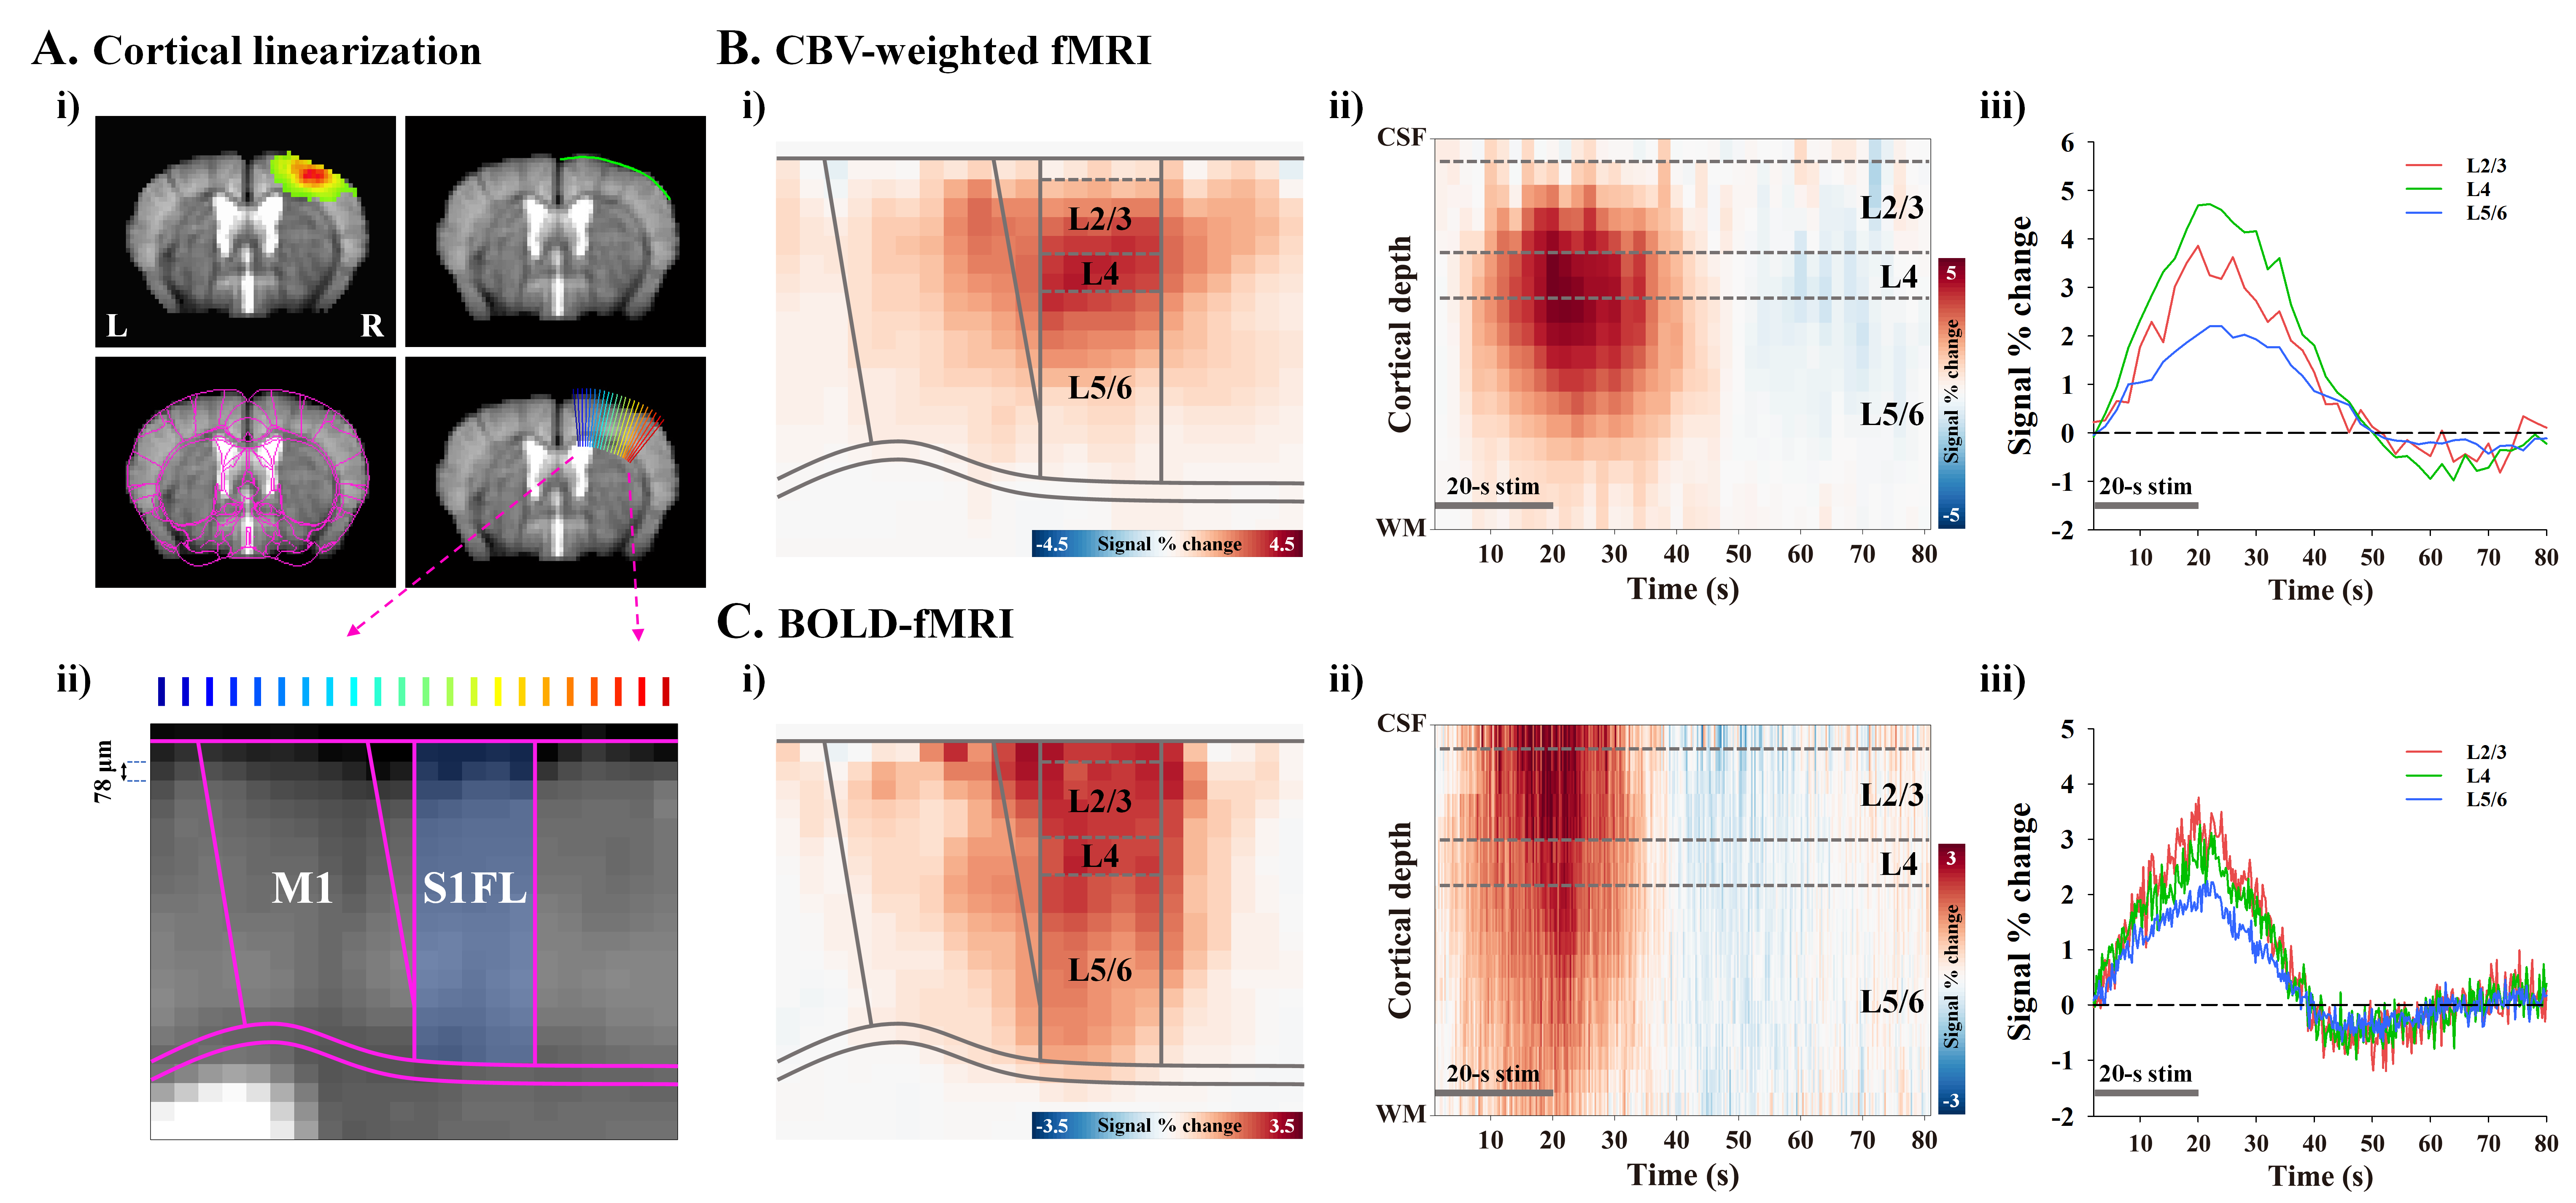
Figure 1. Laminar-dependent CBV and BOLD fMRI responses to somatosensory stimulation
A) Cortical flattening to achieve laminar analysis in S1FL.
B-C) Cortical depth-dependent averaged fMRI maps (i), time-dependent S1FL depth profiles (ii), and time courses of supragranular (L2/3), granular (L4), and infragranular layers (L5/6) (iii).
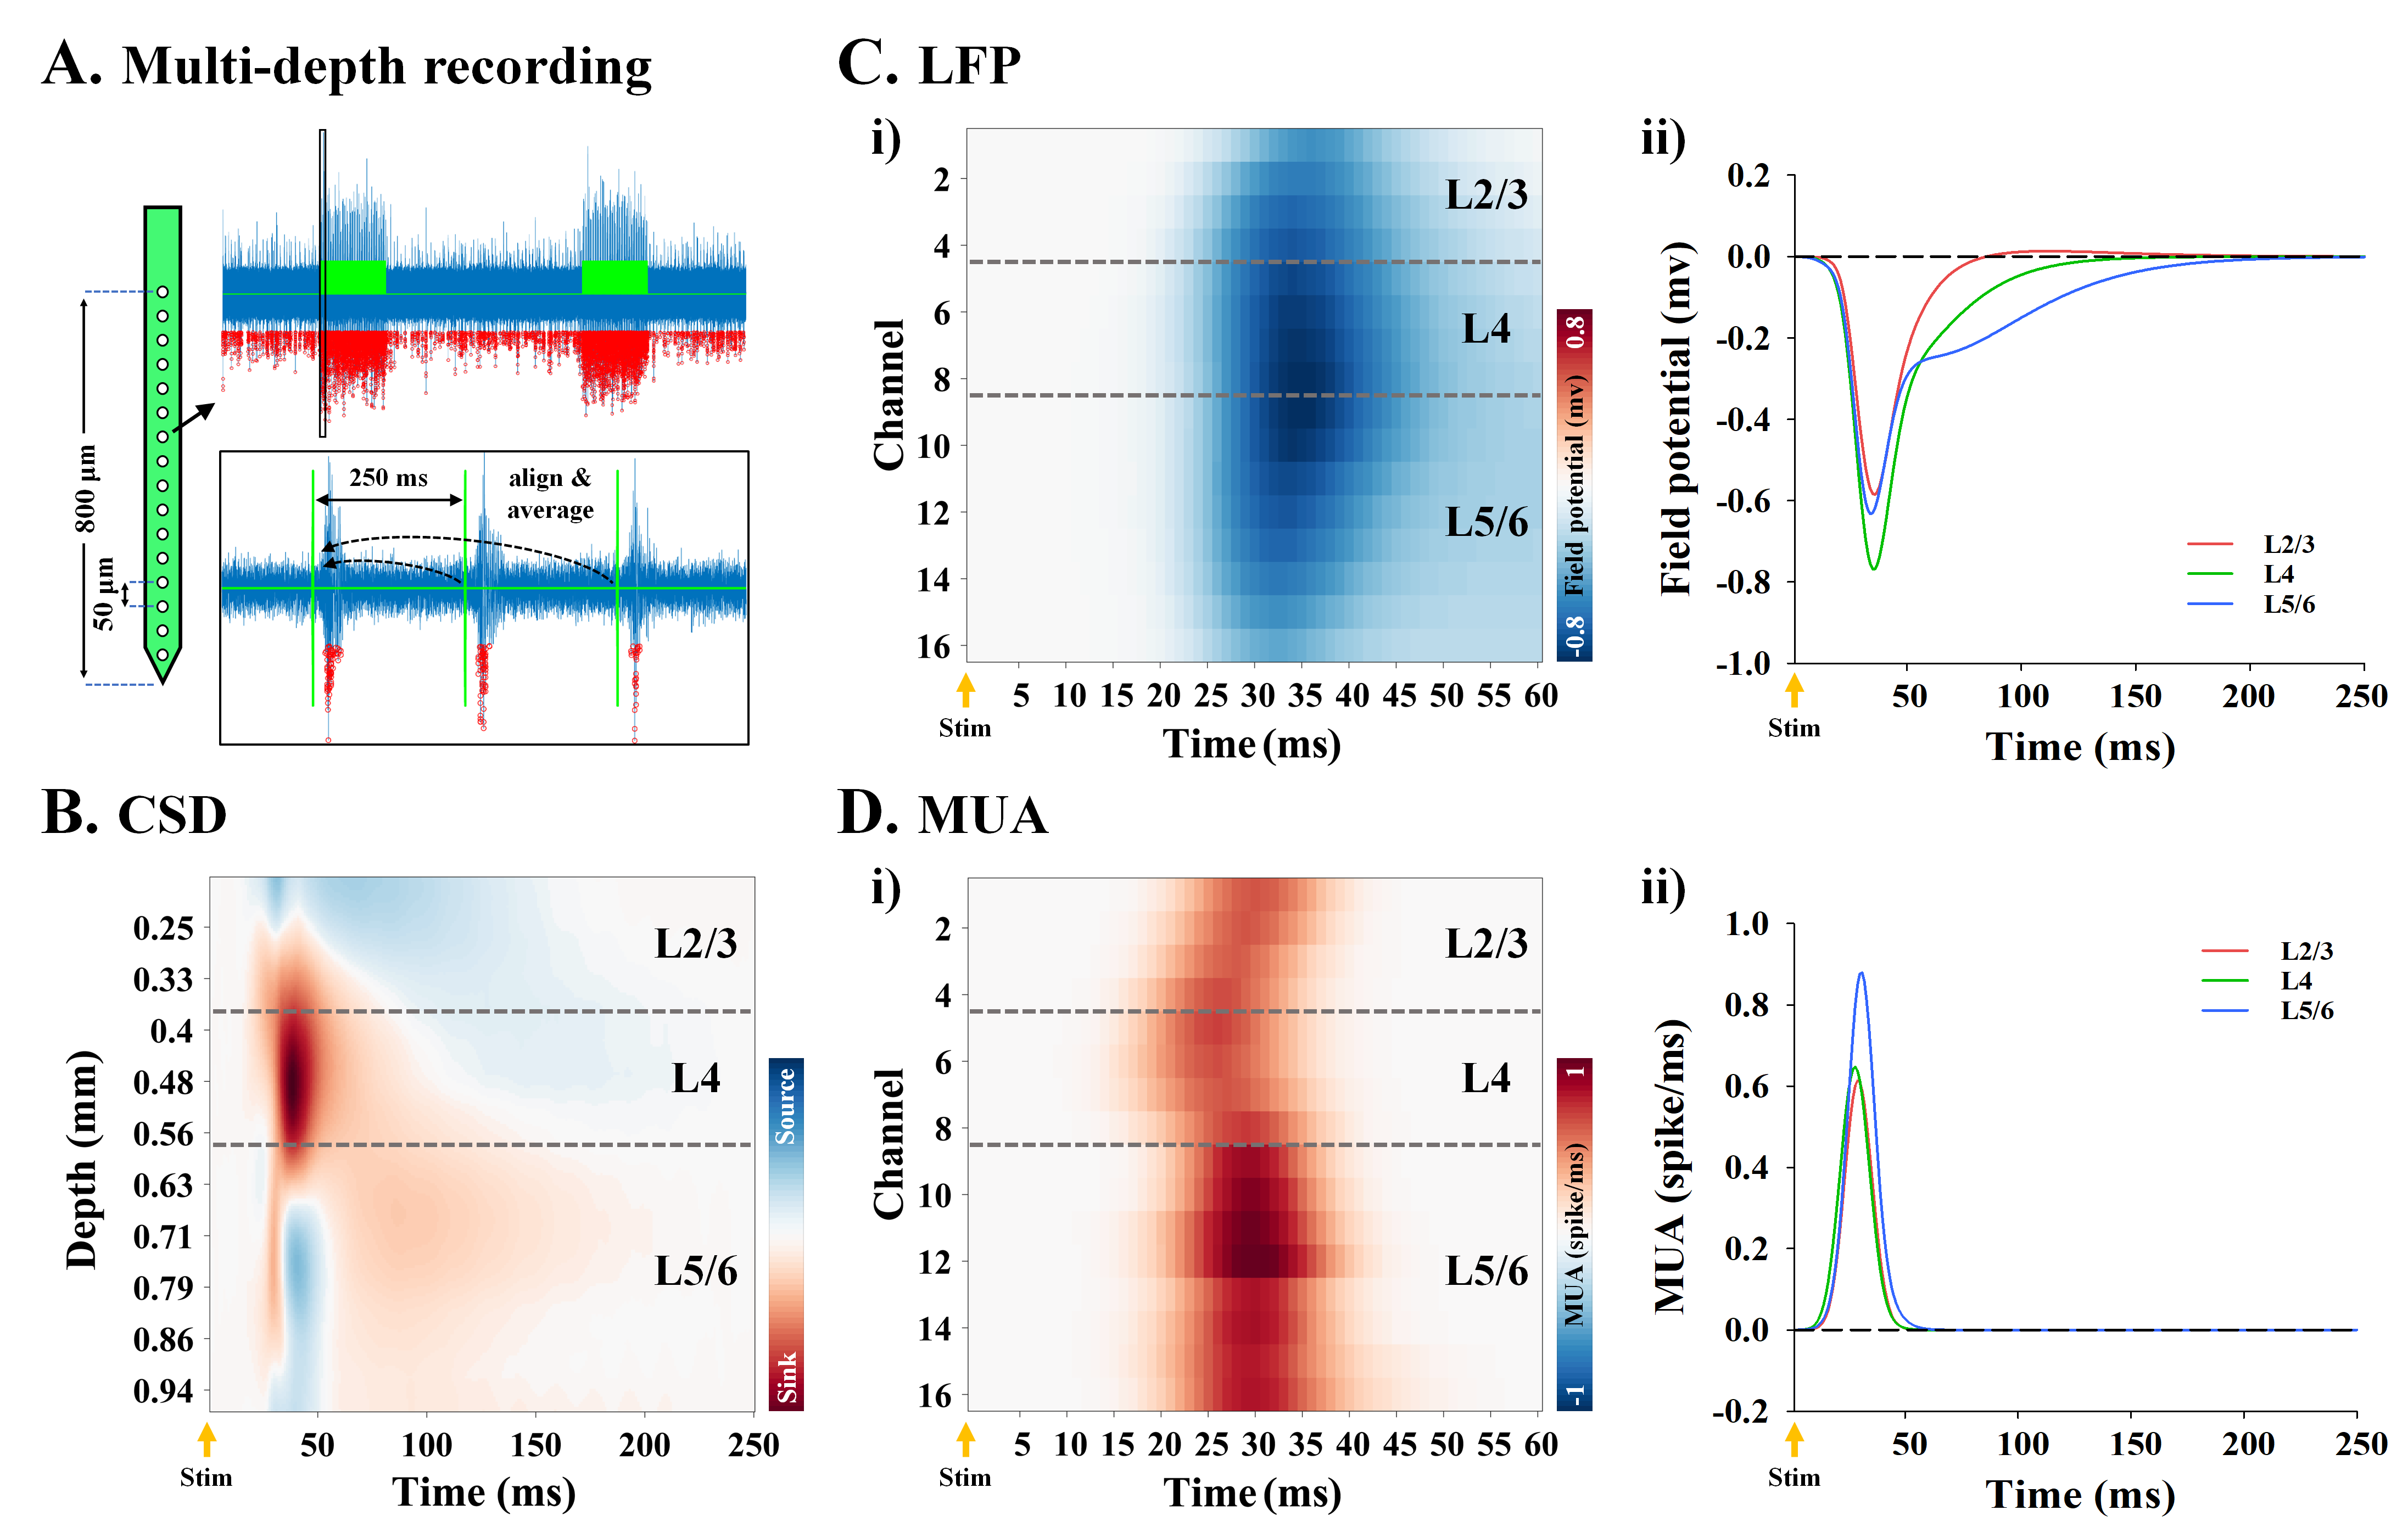
Figure 2. S1FL depth-dependent LFP and MUA to somatosensory stimulation
A) Quantification of neuronal activity changes during stimulation. The traces during two 20-s stimulus periods (green line) were aligned with a 250-ms window and spike activities (red dot) from repeated MUA trains (or LFP waveforms) were then averaged.
B) Current source density depth profile to identify the location of L4.
C-D) Time-dependent MUA and LFP depth profile (i), and time courses of supragranular (L2/3), granular (L4), and infragranular layers (L5/6) (ii).
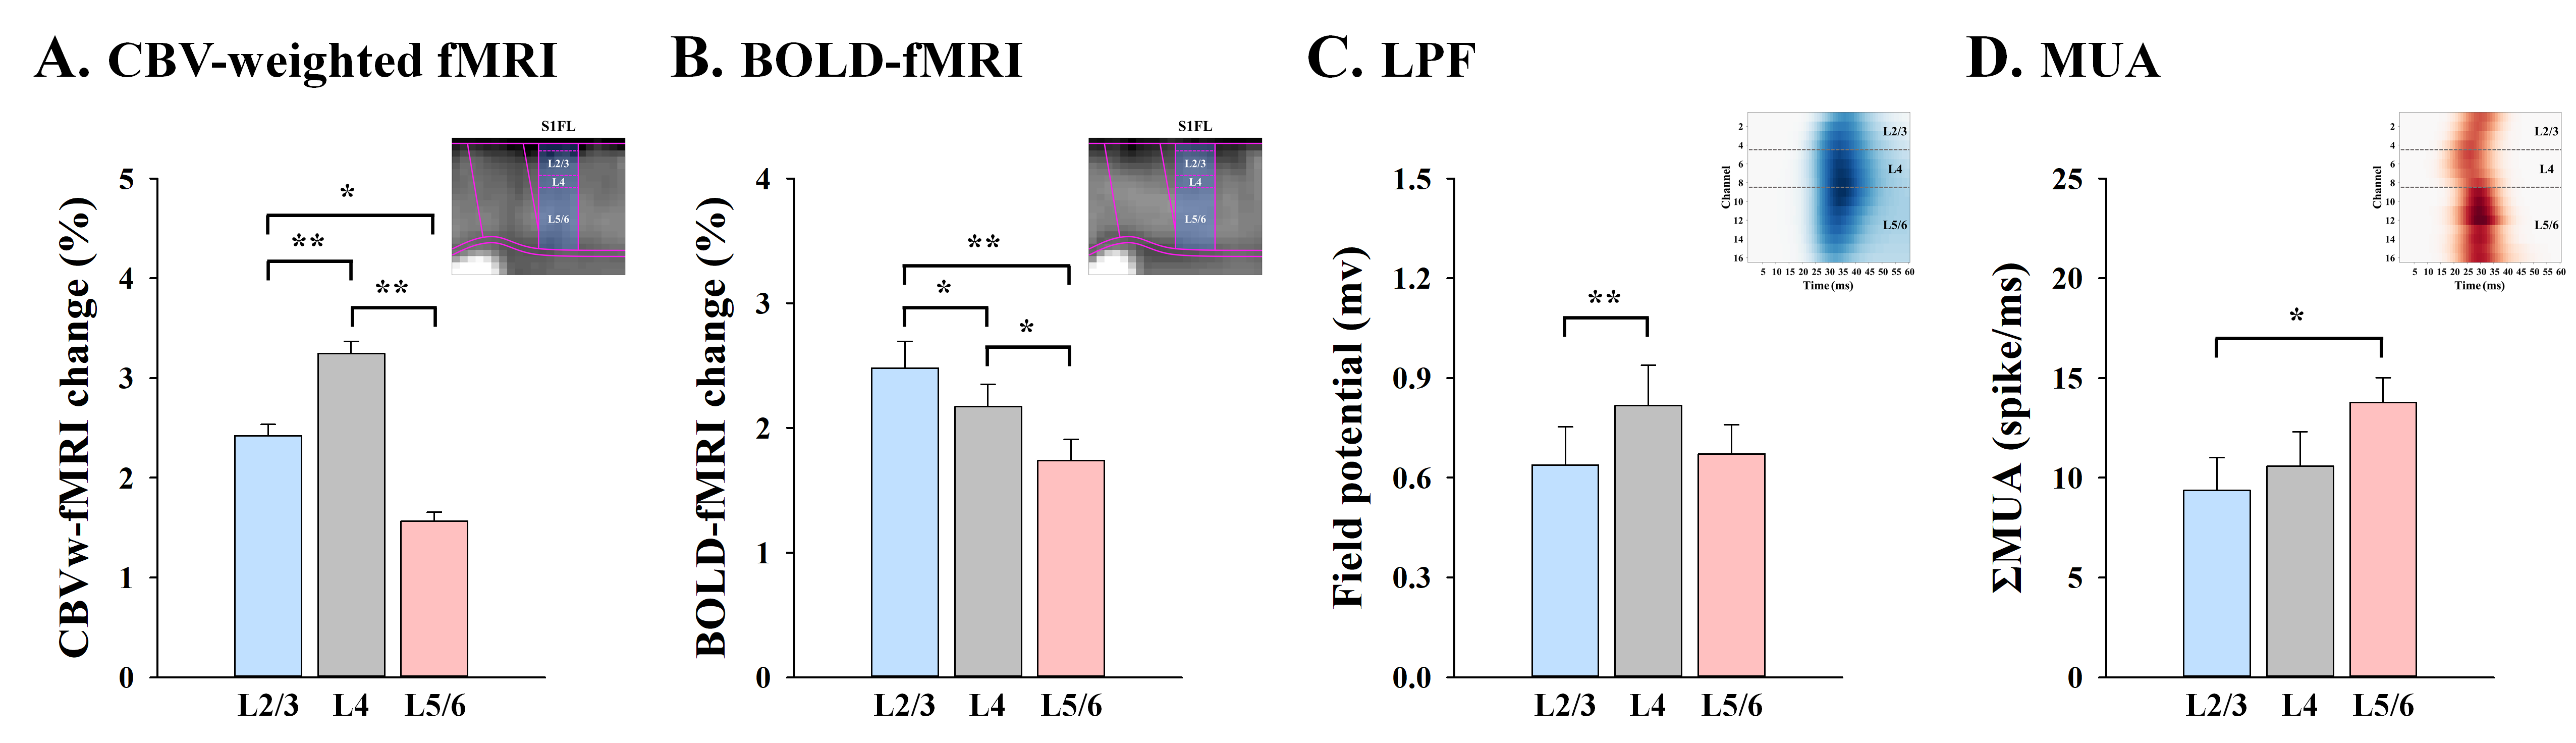
Figure 3. Cortical depth-dependent fMRI response and neuronal activity
Somatosensory-evoked CBV fMRI response is highly specific to synaptic input layer (L4) measured by LFP, not the spiking output of MUA, whereas BOLD response shows the poor spatial specificity for laminar activation. *p<0.05, **p<0.01.