2197
Cortical-depth dependent functional connectivity at the human auditory cortex during the resting state and under complex naturalistic stimuli1Physical Sciences Platform, Sunnybrook Research Institute, Toronto, ON, Canada, 2Department of Medical Biophysics, University of Toronto, Toronto, ON, Canada, 3Center for Neuroscience Imaging Research, Institute for Basic Science, Suwon, Korea, Republic of, 4Techna Institute & Koerner Scientist in MR Imaging, Joint Department of Medical Imaging and Krembil Brain Institute, University Health Network, Toronto, ON, Canada, 5A. A. Martinos Center for Biomedical Imaging, Massachusetts General Hospital, Charlestown, MA, United States
Synopsis
We explored the functional connectivity of the human auditory cortex with cortical depth analysis and compared music listening and the resting state using 7T fMRI with 0.8 mm isotropic resolution. Tonotopic maps, principal component analysis, and seed-based correlation revealed network topologies and suggested functions supporting feed-forward and feed-back processing. The feed-forward process is manifested by the reduced correlation to the contralateral auditory cortex during music-listening at the intermediate cortical depths. The feed-back processing is associated with a network like the tonotopic organization, which was stable between the resting and music listening but more correlated with the contralateral auditory cortex.
Introduction
The neural dynamics at bi-hemispheric auditory cortices have been shown to be correlated with each other [1]. This functional connectivity was prominent during either engaging auditory stimuli or resting state without explicit acoustic inputs [2]. Changes in the auditory functional connectivity have been found associated with psychiatric disorders [3]. Details about the neural orchestration within the auditory cortex, particularly across cortical depths [4], are less known. Here we use cortical-depth dependent fMRI [5-7] to reveal functional connectivity networks across cortical depths during music listening and compare those during the resting state.Methods
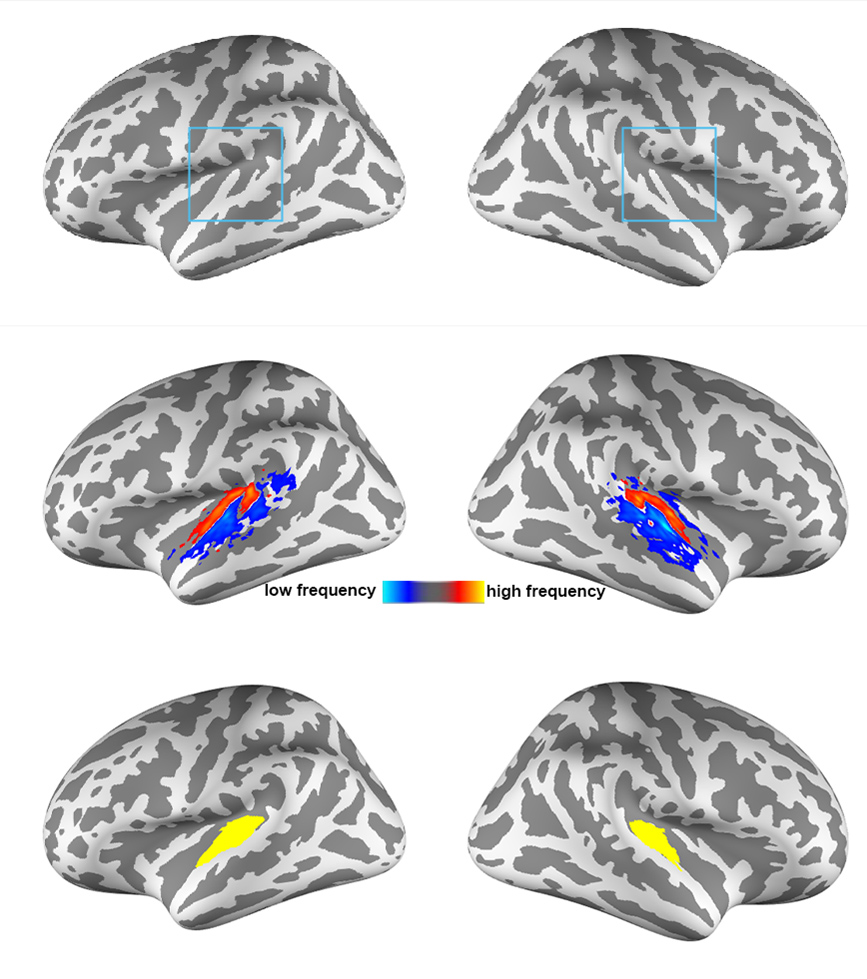
All participants joined this study with written informed consents after the approval of the Institute Review Boards. Functional MRI data were acquired on a 7T (Terra, Siemens) with a 32-channel whole-head coil array. Structural and functional images were acquired with MP2RAGE and a 0.8-mm isotropic resolution EPI, respectively. Nine cortical surfaces with equally spaced cortical thickness were reconstructed from the structural images using FreeSurfer [8, 9]. The auditory stimulus were three songs (Song 1: “Doraemon” theme song, Song 2: “Brahms Piano Concerto No. 1”, and Song 3: “Lost stars” from Adam Levine). Each participant listened to each song twice in a randomized order. We also measured the fMRI signals during the resting state using the same protocol. Data preprocessing included the use of the topup function in FSL to correct the EPI geometric distortion. Confound in the fMRI time series included dynamics of the head motion and signals averaged across the white matter and ventricles.At each cortical depth, Principal Component Analysis (PCA) was first used to decompose the spatiotemporal fMRI signals within the auditory cortex into the spatial distributions and the dynamics of networks during music listening and the resting state. The auditory cortex was anatomically defined by the Human Connectome Project data (Figure 1). A permutation test based on 100 repetitions of phase scrambled fMRI time series was used to assess the statistical significance of the PCA analysis. Second, we compared the spatial distributions of singular vectors to group-average tonotopic maps defined in a separate study (Figure 1) [10] to better understand their physiological correlates to the processing of basic auditory information. Third, we calculated the correlation coefficient at each cortical depth with the seed at the contralateral hemisphere and the same cortical depth to reveal inter-hemispherical functional connectivity (ihFC). The comparison of ihFC was quantified by taking the Fisher’s Z-transform on the effects.
Results
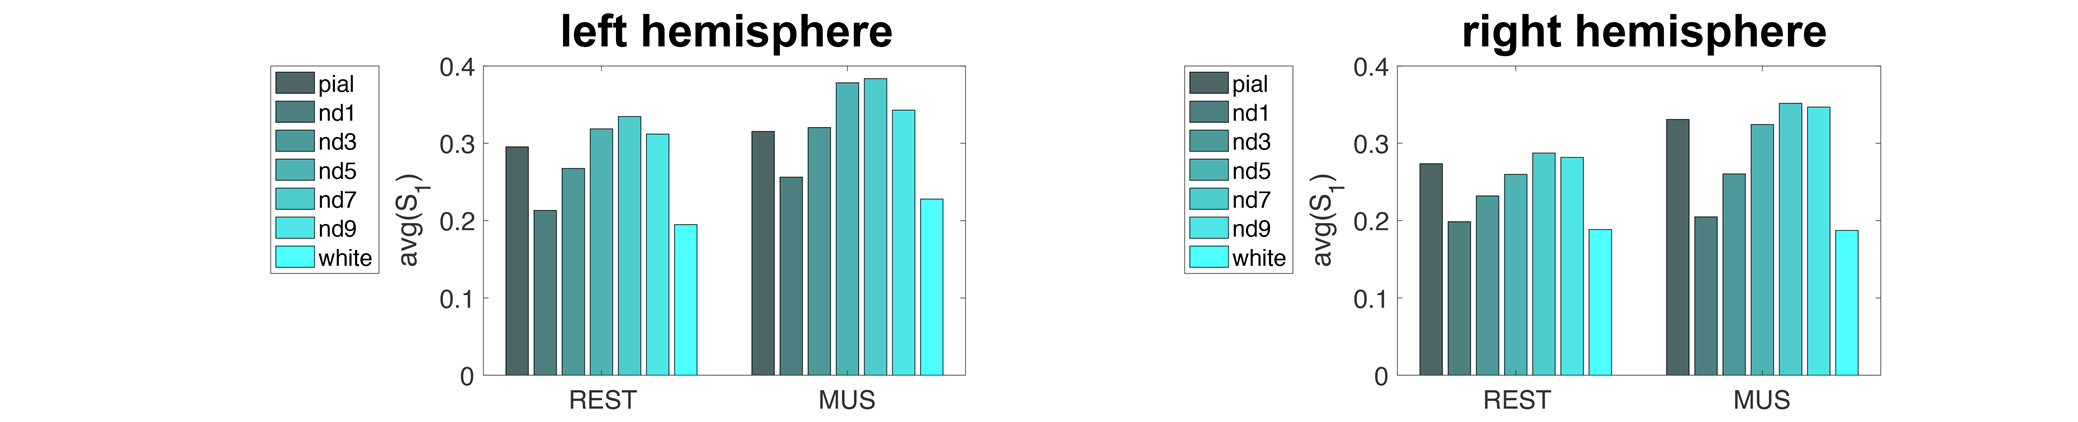
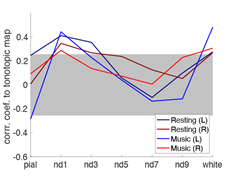
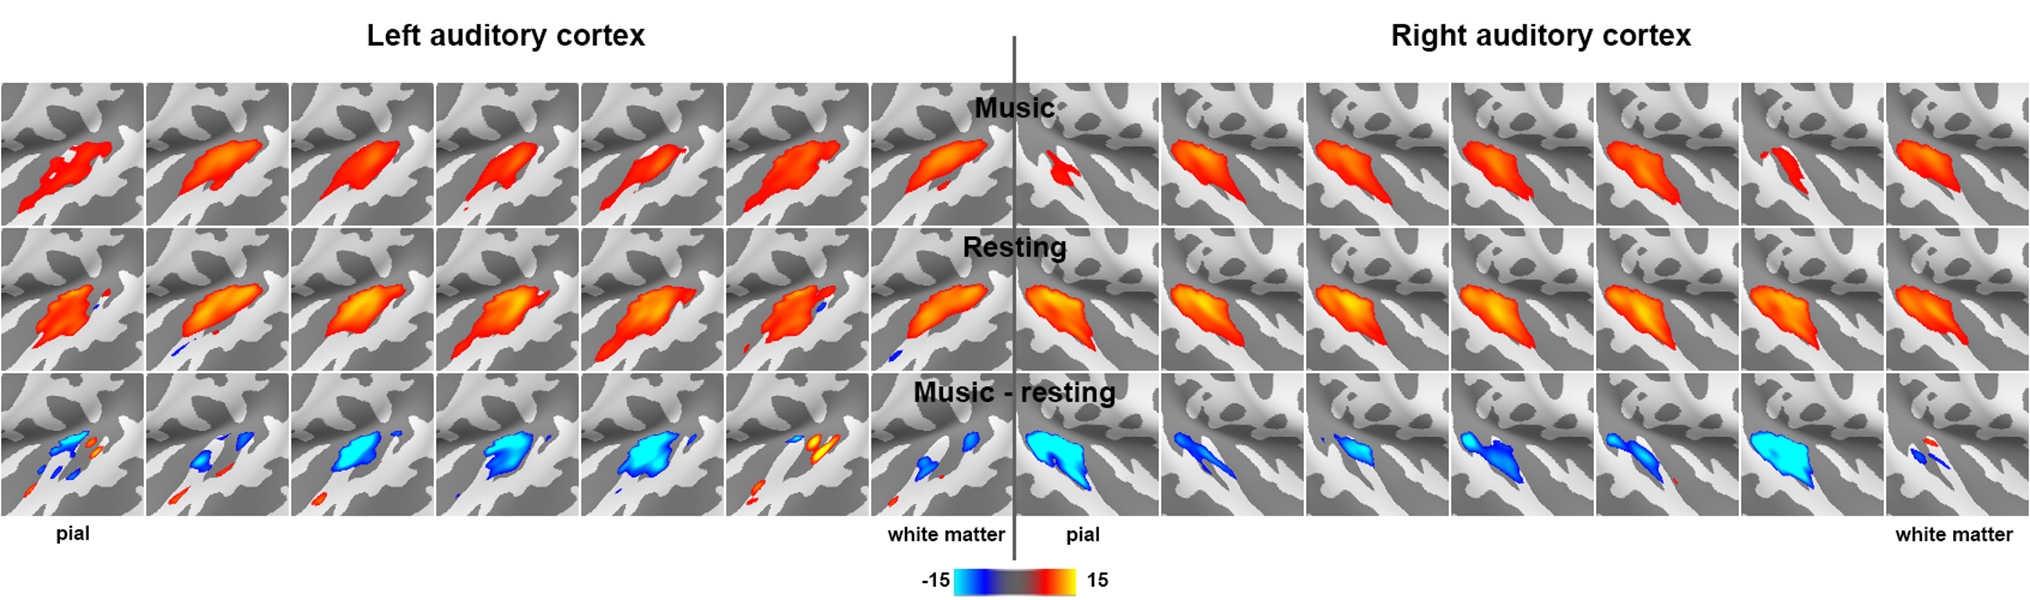
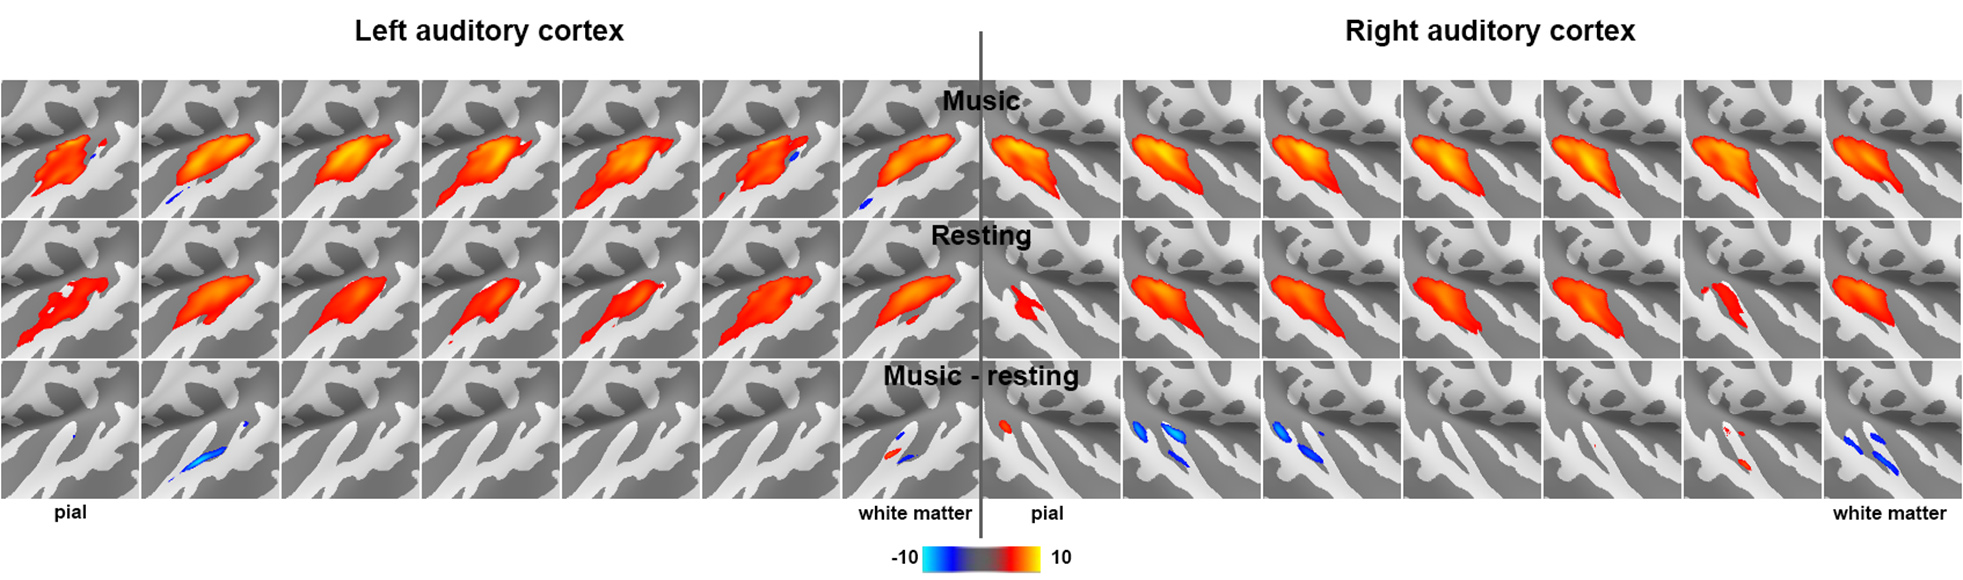
Figure 2 shows the proportion of the first singular values in the resting and music listening conditions across cortical depths at left and right auditory cortices. The first component had a larger proportion of total power of singular values at the intermediate cortical depths. The pial surface also shows a large proportion. No significant difference was found between the resting state and music listening. The following analysis focused on the first principal components. The spatial distributions of the first principal components at the superficial depths were similar to tonotopic maps (Figure 3). This similarity does not change between the resting state and the music listening. Figure 4 shows maps of the first principal components and their differences across cortical depths at the left and right auditory cortices during the resting and music listening conditions. Stronger and more focal fMRI signals around Heschl’s gyrus were found in the resting state than music listening. The differences were more prominent at the intermediate cortical depths. Finally, we examined spatial distributions of correlation coefficients and their differences with respect to the contralateral auditory cortex activity at the same cortical depth during the resting and music listening conditions (Figure 5). These correlations were stronger during music listening. The differences of these correlations were found at superficial and deep cortical depths.Discussion
Preferential anatomical feed-forward connections are found at the intermediate cortical depth in the primary sensory regions [11, 12]. The feed-forward mechanism can be supported by fewer “modes” (Figure 2) with a spatial distribution different from the tonotopic map (Figure 3) with more activity during the resting state and focal activity around the Heschl’s gyrus (Figure 4) at the intermediate depths. The feed-forward process is also manifested by the reduced correlation to the neural activity at the contralateral auditory cortex during music-listening at the intermediate cortical depths (Figure 5). The feedback processing from other brain areas to the auditory cortex is likely associated with a network similar to the tonotopic organization (Figure 3), which was relatively stable between the resting and music-listening (Figure 4) but more correlated with the contralateral auditory cortex (Figure 5). Further electrophysiological experiments will provide more direct evidence about the neural basis of the functional connectivity within the auditory cortex.Acknowledgements
This study was supported by Canadian Institutes of Health Research (202104PJT-463545-MPI-CEAF-293013), Natural Sciences and Engineering Research Council of Canada (RGPIN-2020-05927), MITACS (IT25405), Sunnybrook Research Institute, Canadian Foundation for Innovation, Ministry of Science and Technology, Taiwan (108-2410-H-010-006-MY2 and 109-2314-B-075 -053), National Health Research Institutes, Taiwan (NHRI-EX109-10905NI), and NIDCD (R01DC017991, R01DC016765).References
1. Damoiseaux, J.S., et al., Proc Natl Acad Sci U S A, 2006. 103(37): p. 13848-53.
2. Lumaca, M., et al., Elife, 2019. 8.
3. Lawrie, S.M., et al., Biol Psychiatry, 2002. 51(12): p. 1008-11.
4. De Martino, F., et al., Proc Natl Acad Sci U S A, 2015. 112(52): p. 16036-41.
5. Ress, D., et al., Neuroimage, 2007. 34(1): p. 74-84.
6. Koopmans, P.J., M. Barth, and D.G. Norris, Hum Brain Mapp, 2010. 31(9): p. 1297-1304.
7. Scheeringa, R., et al., Proc Natl Acad Sci USA, 2016. 113(24): p. 6761-6766.
8. Dale, A.M., B. Fischl, and M.I. Sereno, Neuroimage, 1999. 9(2): p. 179-194.
9. Fischl, B., M.I. Sereno, and A.M. Dale, Neuroimage, 1999. 9(2): p. 195-207.
10. Ahveninen J., et al., Neuroimage, 2016. 143: p. 116-127.
11. Felleman, D.J. and D.C. Van Essen, Cereb Cortex, 1991. 1(1): p. 1-47.
12. Harris, K.D. and T.D. Mrsic-Flogel, Nature, 2013. 503(7474): p. 51-8.
Figures