2196
Laminar layer 7T fMRI-EEG reveals human alpha oscillations are predominately from superficial and deep layers
Daniel C. Marsh1, Rodika Sokoliuk2, Kevin M. Aquino3,4, Daisie O. Pakenham5, Ross Wilson2, Rosa Sanchez Panchuelo6, Sebastian C. Coleman1, Matthew J Brookes1, Simon Hanslmayr7, Stephen D. Mayhew2, Susan T Francis1, and Karen J Mullinger1,2
1Sir Peter Mansfield Imaging Centre, School of Physics and Astronomy, University of Nottingham, Nottingham, United Kingdom, 2Centre for Human Brain Health, School of Psychology, University of Birmingham, Birmingham, United Kingdom, 3School of Physics, University of Sydney, Sydney, Australia, 4Turner Institute, Monash University, Melbourne, Australia, 5Clinical Neurophysiology, Queens Medical Centre, Nottingham University Hospitals NHS Trust, Nottingham, United Kingdom, 6Queen Elizabeth Hospital, University Hospitals Birmingham NHS Foundation Trust, Birmingham, United Kingdom, 7Centre for Cognitive Neuroimaging,College of Medical, Veterinary and Life Sciences, University of Glasgow, Glasgow, United Kingdom
1Sir Peter Mansfield Imaging Centre, School of Physics and Astronomy, University of Nottingham, Nottingham, United Kingdom, 2Centre for Human Brain Health, School of Psychology, University of Birmingham, Birmingham, United Kingdom, 3School of Physics, University of Sydney, Sydney, Australia, 4Turner Institute, Monash University, Melbourne, Australia, 5Clinical Neurophysiology, Queens Medical Centre, Nottingham University Hospitals NHS Trust, Nottingham, United Kingdom, 6Queen Elizabeth Hospital, University Hospitals Birmingham NHS Foundation Trust, Birmingham, United Kingdom, 7Centre for Cognitive Neuroimaging,College of Medical, Veterinary and Life Sciences, University of Glasgow, Glasgow, United Kingdom
Synopsis
EEG alpha (8-13Hz) oscillations occur throughout the cortex but the generating mechanisms are poorly understood. Opinion is divided between alpha being driven by bottom-up, top-down or both of these processes. Using simultaneous 7T-fMRI-EEG with an eyes open/closed paradigm, we assess the generator of alpha by performing layer-fMRI analysis of GE-BOLD data to determine the strongest BOLD-alpha negative layer correlations. We show that, after accounting for draining vein effects using spatial deconvolution, alpha-BOLD correlations are strongest in the superficial and deep layers suggesting they are predominately driven by top-down processes.
Introduction
EEG alpha (8-13Hz) oscillations occur throughout the cortex. Alpha power fluctuations occur spontaneously but can be strongly modulated by passively opening/closing the eyes as well as with performance during cognitive tasks[1-5]. The generating mechanisms of alpha are poorly understood, with opinion divided between whether alpha is primarily driven by (i) bottom-up thalamic sources[6,7], (ii) top-down cortical sources[8-10], or (iii) both of these processes[1,11].Simultaneous EEG-fMRI using high spatial resolution fMRI at ultra-high field (7T) provides a unique method to study bottom-up and top-down mechanisms to provide new insight into the origin of alpha oscillations. Here we investigate EEG-fMRI correlations during periods of eyes open/closed to modulate resting-state activity.
Methods: Data Acquisition
The acquisition methods have been presented previously[12]. In brief; EEG-fMRI data were acquired on 10 healthy volunteers (4F, 28±5yrs) using a 64-channel EEG system (Brain Products) in a 7T Philips Achieva MR scanner. fMRI data were acquired using 3D GE-EPI (0.8mm3 isotropic resolution, TE/TRvol = 32/3800ms, two 16-channel high-density array receive coils), a partial head T1-weighted anatomical (PSIR, 0.8mm3) was acquired with matching geometry. The paradigm consisted of alternating 30s blocks of eyes open/closed, with 4 blocks/run and 4-5 runs/subject. In a separate session visual retinotopic mapping data (1.5mm3) were acquired (32-channel NOVA coil).Methods: Analysis
EEG data were analysed as described previously[12]. A virtual electrode (VE) time-course of alpha power (Hilbert envelop of the response) was derived from the site of maximum alpha power change in the occipital cortex for each fMRI run during eyes open/closed. One subject was excluded due to poor EEG quality.3D GE-EPI BOLD data were pre-processed for physiological noise, distortion and motion correction[12]. The EEG alpha power VE-time-course was convolved with a HRF (double gamma, time-to-peak 6s) and downsampled to the fMRI TR with motion realignment parameters input as regressors into an individual subject fixed effects GLM (FEAT, FSL).
PSIR data were used to manually define a grey matter mask which was combined with V1, V2 and V3 regions of interest (ROIs) defined from retinotopic mapping (mrTools). The grey matter mask was used to define 6 equivolume layers across the cortex and generate 20000 cortical columns (mean column diameter 0.8-1cm and height 1-2cm) within the visual cortex (using LAYNII[13]). Only columns which lay entirely within V1, V2 or V3 and contained voxels with significant BOLD-alpha correlation (Z < -2.3) were included.
For V1, V2 and V3, the beta weights within the columns were constrained to a threshold of 5% of the absolute maximum beta weight. To remove noise, any voxels where the beta weights had a magnitude lower than the threshold were excluded from further analysis (as shown in Fig 1).
Draining vein effects were corrected using a spatial deconvolution[14] (‘deveining’) implemented in LAYNII. The CBVv estimate for this analysis was calculated from the mean variance of the BOLD signal during the eyes closed periods for each run, which was averaged across all runs. All calculated layer profiles for each subject were normalised to their mean beta weight at depth 1 (CSF boundary) measured from before deveining. Before and following ‘deveining’, the beta weights from the active columns were averaged for each layer within V1, V2 and V3. The weighted mean (according to number of active voxels) layer profile across V1, V2 and V3 was also calculated for each subject and averaged over subjects.
Results
Figure 2 shows the results of the GLM analysis to model the EEG alpha power for each subject. Areas with high negative alpha-BOLD correlation are localised to the grey matter of the visual cortex. In all subjects significant (Z<-2.3) negative alpha-BOLD correlations were seen. Figure 3 illustrates the variation in the spatial extent and magnitude of the activation across subjects.Figure 4 shows the mean percentage of voxels classified as below the noise threshold (and so excluded) within each layer. As expected, for negative correlations (Fig 4a) there is a lower percentage of voxels below the threshold than for positive correlations (Fig 4b). The least voxels were excluded from the negative correlations in superficial layers at the CSF boundary.
Figure 5 shows the mean layer profiles averaged across V1-V3 for each subject (a) before deveining and (b) after deveining. Across V1, V2, V3, a dip in the middle layers is revealed after deveining (Fig 5c). A Repeat Measures ANOVA on averaged V1-V3 data (Fig 5b) showed a trend (p=0.095) for change in beta weight with cortical depth. Post-hoc t-tests revealed this is driven by cortical depth 4 being significantly lower than depths 1 (p=0.01), 2 (p=0.02) and 6 (p=0.02).
Discussion
7T EEG-fMRI layer profiles relating to alpha power modulations have been obtained non-invasively. After accounting for draining vein effects a reduction in the magnitude alpha-BOLD signal correlation is seen in the mid-layers (Fig 5). Further work is still needed to determine the robustness of the deveining to the CBVv estimation input.Conclusion
Our findings suggest that alpha power is primarily originating in superficial and deep layers, likely through top-down processing at rest. This finding is in agreement with monkey recordings which have shown a similar profile of alpha variation across layers[15].Acknowledgements
This work was funded by Leverhulme Trust [grant number RPG-2014-369], EPSRC and MRC Doctoral Training grant to DCM [grant number EP/L016052/1]. We thank Laurentius Huber and Omer Faruk Gulban for helpful discussions on using LAYNII.References
- Hanslmayr S, et al., The role of alpha oscillations in temporal attention. Brain Res Rev, 2011. 67(1-2): p. 331-43.
- Jensen O, et al., Oscillations in the alpha band (9-12 Hz) increase with memory load during retention in a short-term memory task. Cereb Cortex, 2002. 12(8): p. 877-82.
- Klimesch W, et al., 'Paradoxical' alpha synchronization in a memory task. Brain Res Cogn Brain Res, 1999. 7(4): p. 493-501.
- Romei V, Gross J, and Thut G, On the role of prestimulus alpha rhythms over occipito-parietal areas in visual input regulation: correlation or causation? J Neurosci, 2010. 30(25): p. 8692-7.
- Berger H, Uber das elektroenkephalogram des menschen. Arch Psychiatr Nevenkr, 1929. 87: p. 527-570
- Hughes S.W, et al., Synchronized oscillations at alpha and theta frequencies in the lateral geniculate nucleus. Neuron, 2004. 42(2): p. 253-68.
- Lopes da Silva F, Neural mechanisms underlying brain waves: from neural membranes to networks. Electroencephalogr Clin Neurophysiol, 1991. 79(2): p. 81-93.
- Buffalo, E.A, et al., Laminar differences in gamma and alpha coherence in the ventral stream. Proc Natl Acad Sci USA, 2011. 108(27): p. 11262-7.
- von Stein A, Chiang C, and Konig P, Top-down processing mediated by interareal synchronisation. Proc Natl Acad Sci USA, 2000. 97(26): p. 14748-53.
- Scheeringa R, et al., The relationship between oscillatory EEG activity and the laminar-specific BOLD signal. Proc Natl Acad Sci USA, 2016. 113 (24): p. 6761-6766.
- Klimesch W, Sauseng P, and Hanslmayr S, EEG alpha oscillations: the inhibition-timing hypothesis. Brain Res Rev, 2007. 53(1): p. 63-88.
- Marsh D. C, et al., Assessing the origin of human alpha oscillations using laminar layer 7T fMRI-EEG [abstract]. Proceedings of the International Society for Magnetic Resonance in Medicine 2020, Online.
- Huber, L, et al. LayNii: A software suite for layer-fMRI. NeuroImage. 2021, 237:118091.
- Havlicek M, Uludağ K, A dynamical model of the laminar BOLD response. Neuroimage. 2020, 204:116209.
- van Kerkoerle T, et al., Alpha and gamma propagate in opposite directions. Proc Natl Acad Sci USA, 2014. 111 (40): p. 14332-14341
Figures
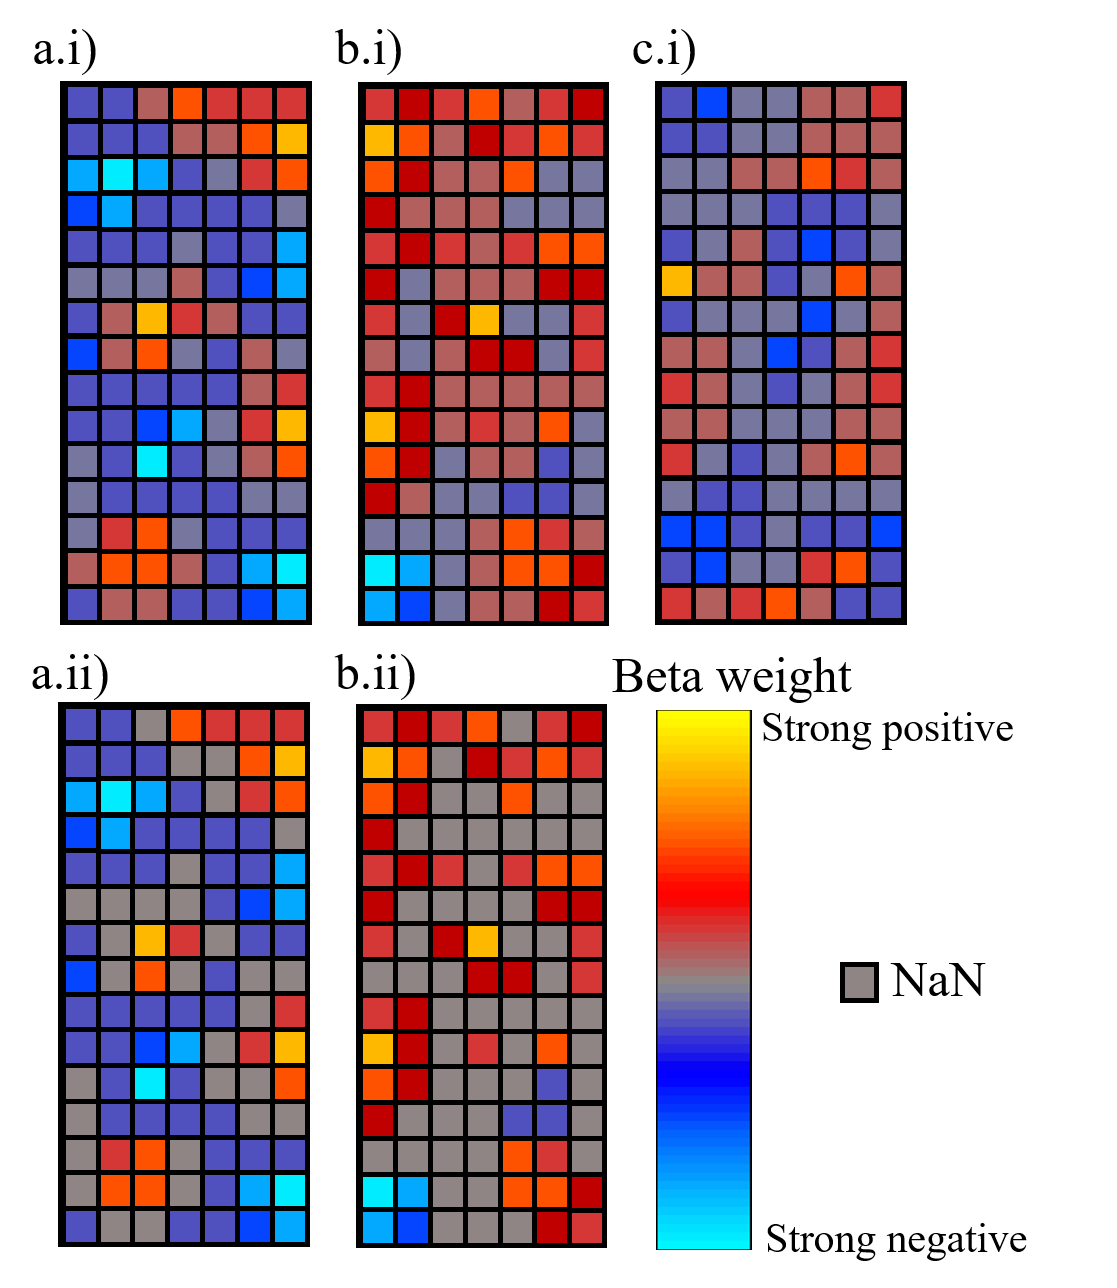
Figure 1: Illustration of
sample voxel signals within columns. a.i) Column with a large number of
significant negative correlations and a small number of positive correlations.
b.i) Column with a large number of positive correlation which is included in
further analysis due to a patch of significant negative correlation (bottom
left). c.i) Column with non-significant negative correlations: excluded from
analysis. a.ii) and b.ii) Result of 5% threshold of the maximum beta weight
applied to column a.i) and b.i), respectively.
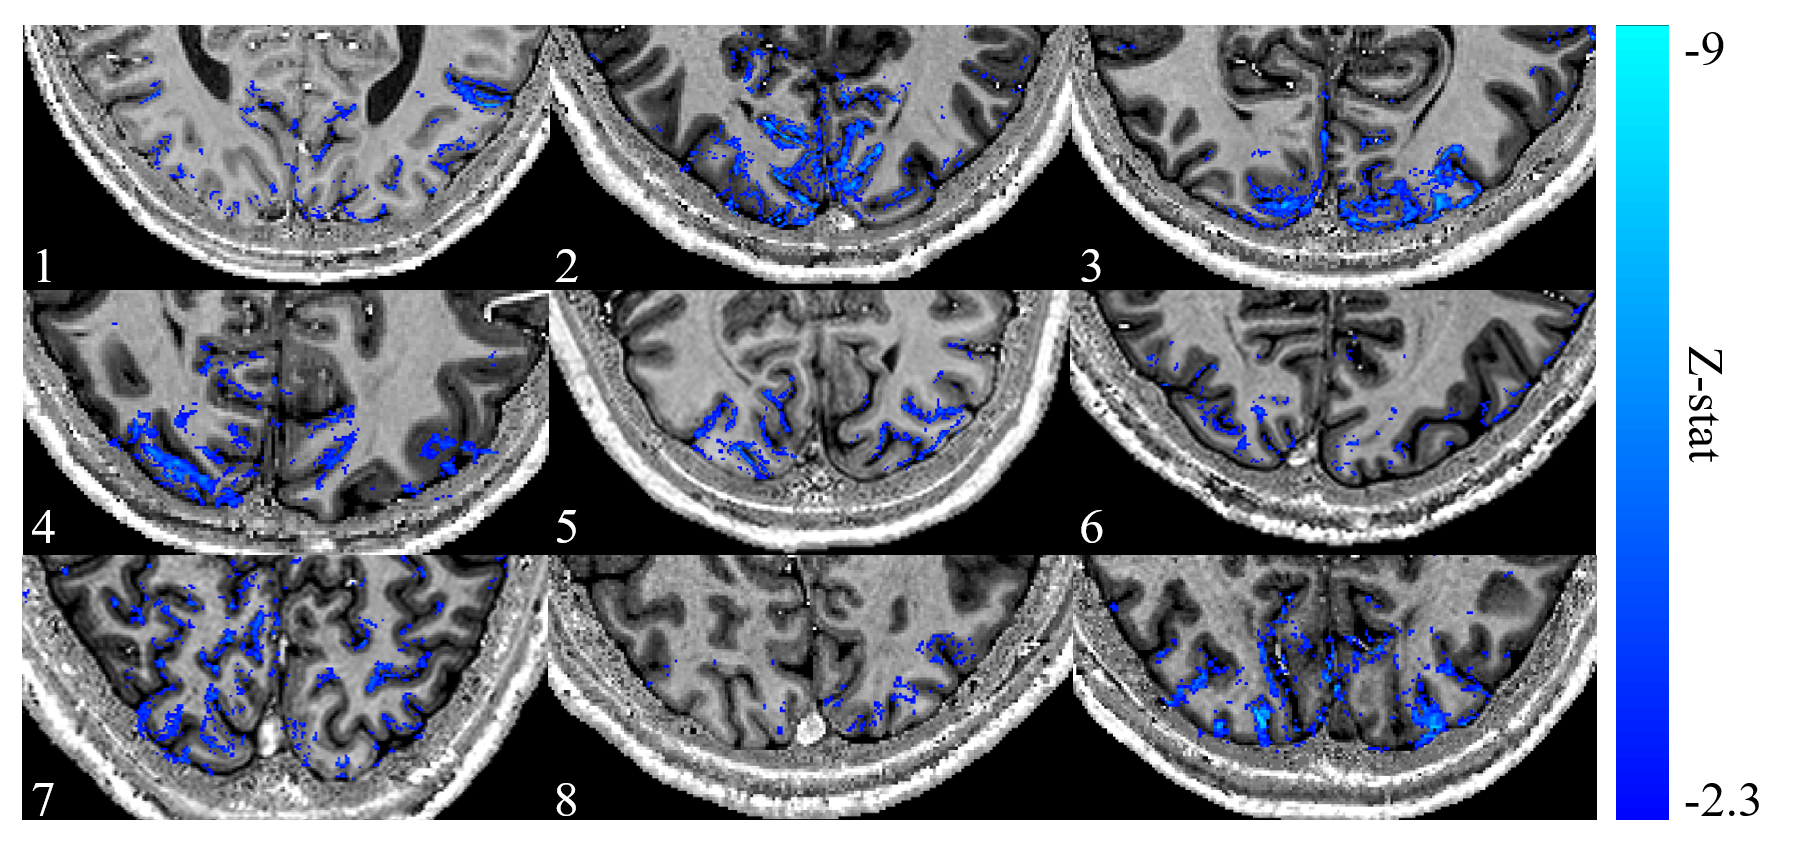
Figure 2: Average
z-stat map across all runs for each subject overlaid onto their corresponding
PSIR (0.8 mm isotropic). Subject numbers are given in the bottom left of each
panel. The significant (Z<-2.3) z-stats are localised to the grey matter of
the visual cortex.
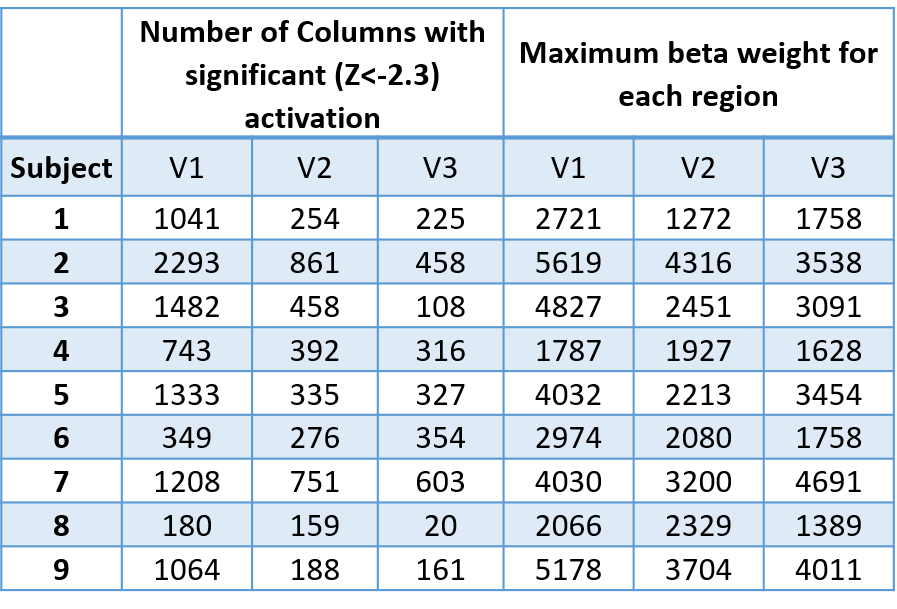
Figure 3: The number of columns where significant (Z<-2.3)
activation (Fig 1) was detected in each ROI and the variation in the maximum
beta weights between subjects and ROIs.
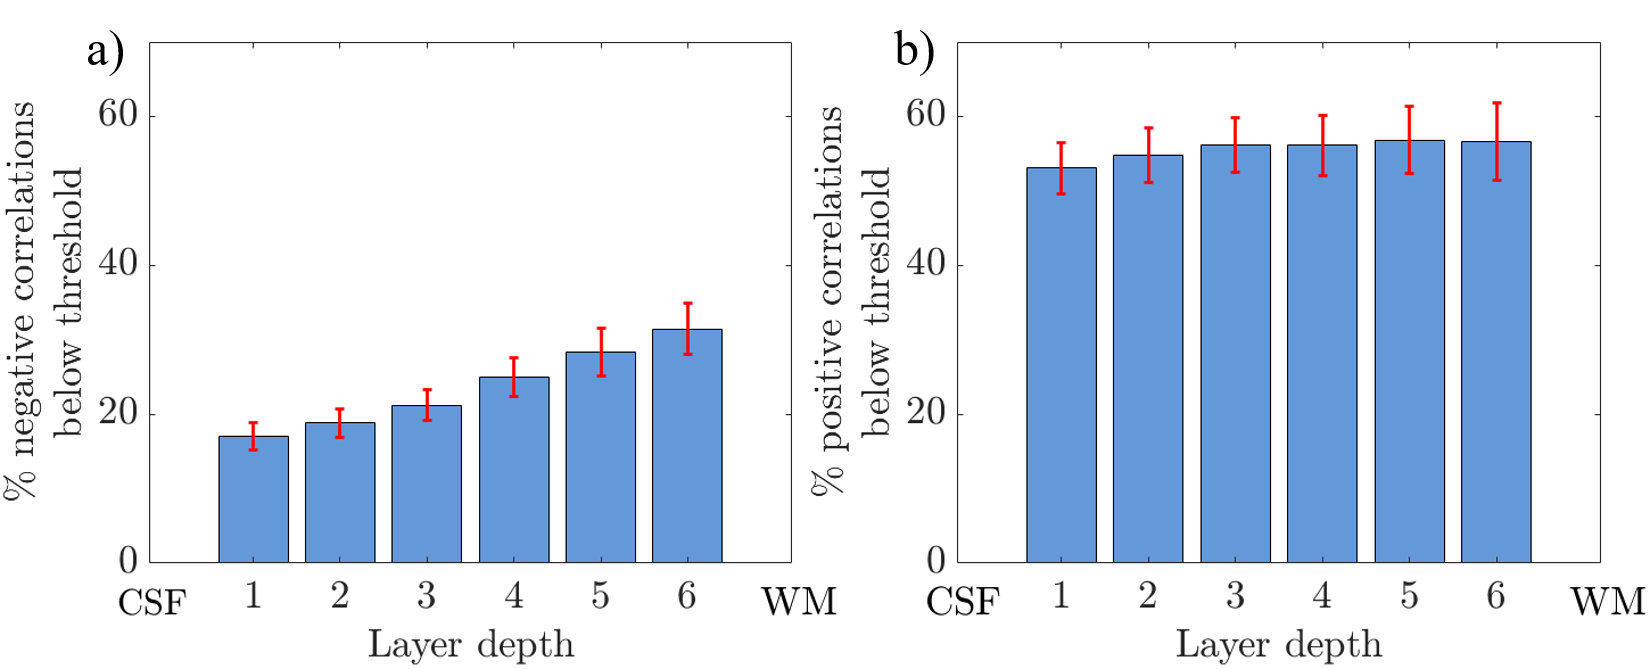
Figure 4: Histograms showing
the percentage of voxels containing negative (a) and positive (b) correlations
that fell below the noise threshold of 5% of the maximum beta weight for each layer calculated for each subject and averaged over subjects. Error
bars show standard error over subjects. CSF = cerebrospinal fluid; WM = white
matter.
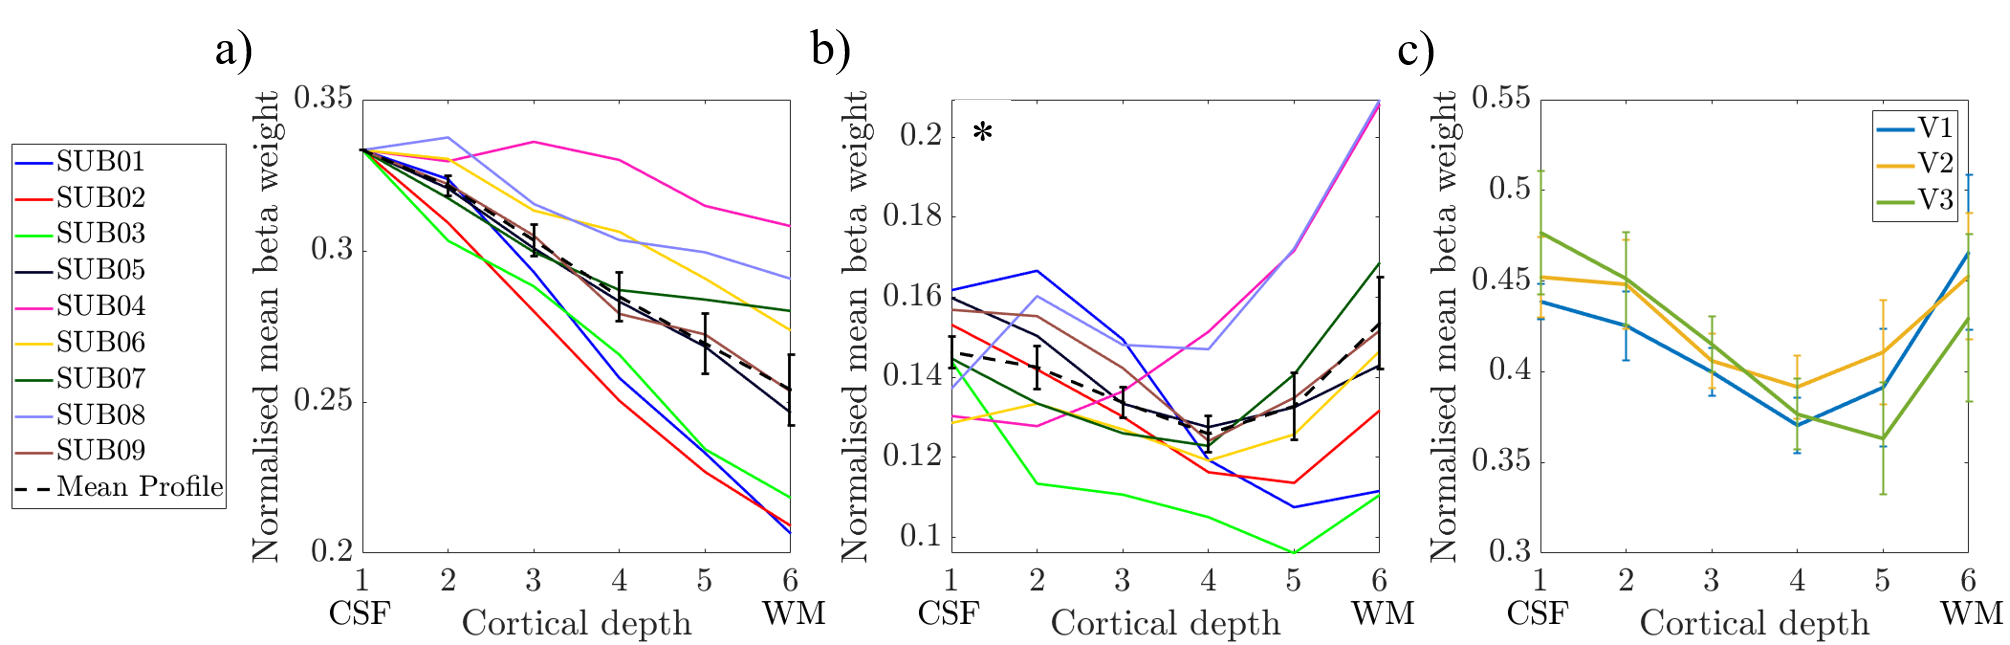
Figure 5: The weighted average
over V1-3 of the variation in normalised beta weights over layers for a) uncorrected layer profiles and b) deveined layer profiles. Individual
subject profiles are shown with the mean over all subjects in black. Error bars
showing the standard error over subjects. c) The variation in normalised beta
weights over layers for V1, V2 and V3 separately after deveining. Layer
profiles averaged over subjects; error
bars show the standard error over subjects. * p<0.1 main effect of
alpha-BOLD correlations over layers. CSF = cerebrospinal fluid; WM = white
matter.
DOI: https://doi.org/10.58530/2022/2196