2173
Fast T1-based MR Thermometry at Low Magnetic Field1Department of Biomedical Engineering, University of Basel, Allschwil, Switzerland, 2Department of Physics, University of Pavia, Pavia, Italy
Synopsis
Thanks to the enhanced T1 dispersion and its linear dependence on temperature over the typical hyperthermia range, T1 mapping represents a serious candidate for temperature mapping at low magnetic fields. Nonetheless, T1 acquisitions are typically long and sensitivity if further reduced at low field regimes. Here we propose a Look-Locker-based temperature mapping sequence that takes advantage of the inherently higher signal gathered using a bSSFP approach. Temperatures spanning from 25 to 50°C could be mapped in doped-water samples with a temporal resolution of 20s/slice and with a precision of 2.6±1.9°C.
Introduction
Despite MR-guided thermometry (MRgT) currently being the sole non-invasive method to provide three-dimensional thermal dose information, the use of one or multiple temperature probes is still the preferred method for temperature monitoring in hyperthermia treatments1. This is mainly caused by the elevated costs associated to conventional MR scanners, the challenges encountered to integrate heat applicators into clinical MR systems2,3, as well as the technique limitations in adipose tissues or moving organs4. Thanks to the reduced economic footprint and increased flexibility, but also the enhanced T1 dispersion5–7 and the linear dependence on temperature over the typical hyperthermia range8, low field scanners could represent a valid alternative for MRgT. Yet, T1 mapping takes time and is even more challenging in low-SNR regimes. Building on a previously presented work9, we propose a fast Look-Locker temperature mapping method based on T1, using a bSSFP sequence.Methods
The proposed T1-mapping approach relies on a saturation-recovery Look-Locker method with a 3D bSSFP sequence. Unlike conventional Look-Locker sequences, a train of alternating ±α pulses spaced by a time interval TRα was used to probe the transient phase of the bSSFP signal. Prior to that, one α/2 preparation pulse was used to have the magnetisation vector oscillate around the z-axis. The signal recovery was modelled using Eq.110$$M(nTR_\alpha) = M_0^{**}\left[1-e^{-\frac{nTR\alpha}{T_1^*}}\right],$$
where M(nTRα) represents the longitudinal magnetisation at the nth measured TRα, while M0** and T1* are the parameters that describe the exponential trend. When TRα<<T1,2, T1* can be expressed through Eq.210:
$$T_1^* = \left(\frac{1}{T_1}cos^2\frac{\alpha}{2} + \frac{1}{T_2}sin^2\frac{\alpha}{2}\right)^{-1}.$$
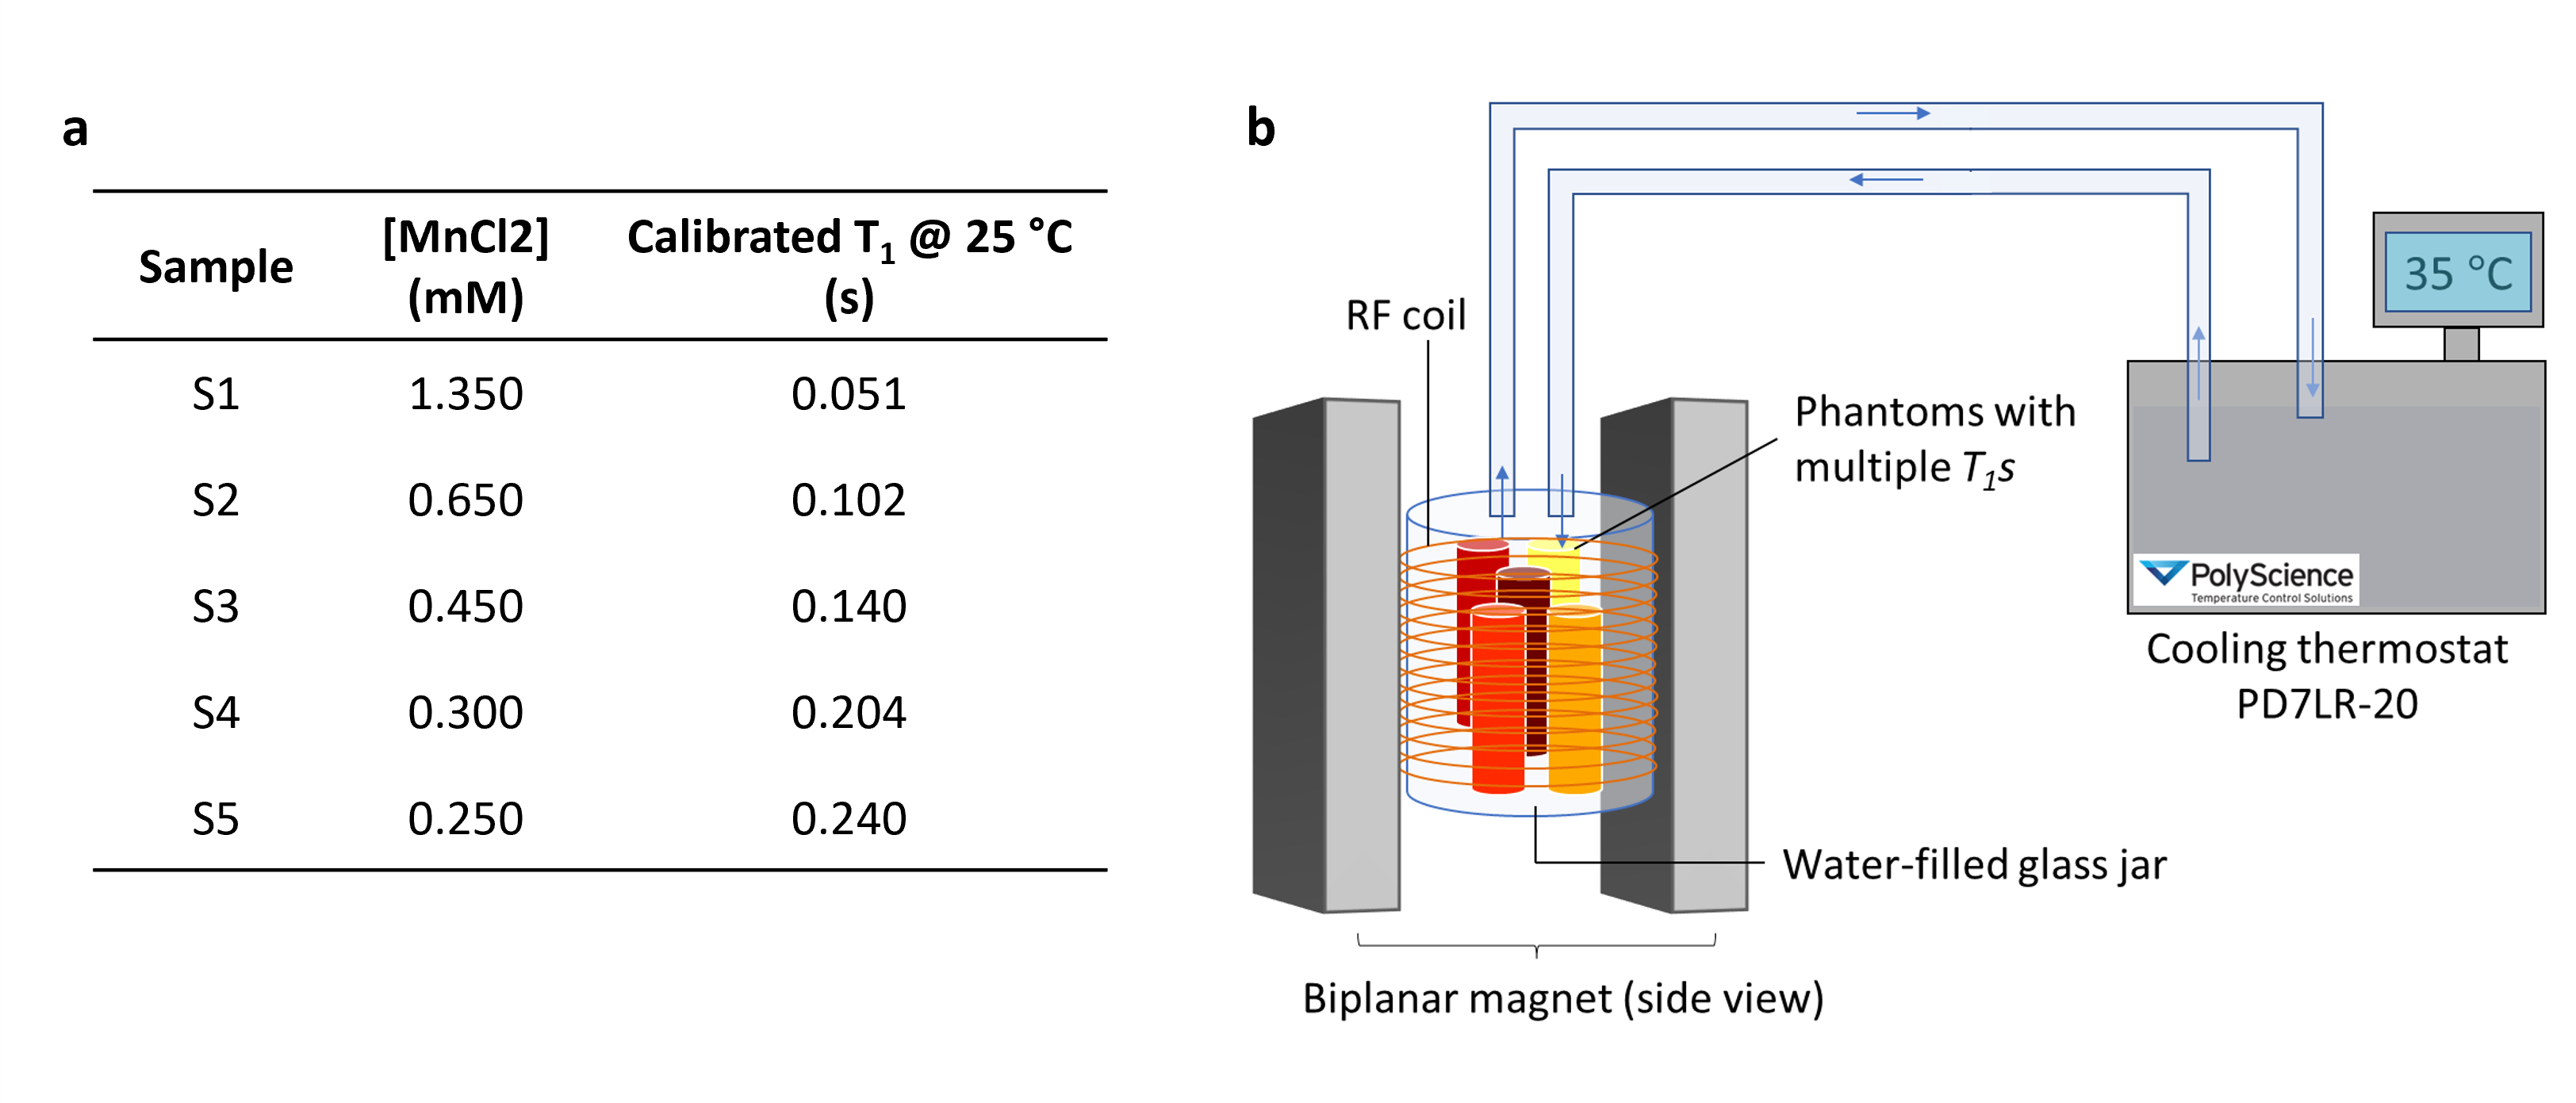
Using α=5°, we approximated the condition . Temperature maps were estimated from the T1 maps exploiting the linearity between spectroscopic T1 measures and temperature for the investigated samples. The accuracy and precision of the maps were assessed in five calibrated water samples (Fig.1a) placed in a custom solenoid RF coil wound around a water-filled glass-jar11. Temperature was controlled using the connected water circulating system (PD7LR-20, PolyScience AG, Switzerland) depicted in Fig.1b. Seven nominal temperatures were investigated: 25°C, 30°C, 35°C, 40°C, 43°C, 45°C, 50°C. A 10 min delay was applied prior to each scan to allow for temperature stabilisation. During each MR acquisition, the ground-truth temperature was assessed through a thermal camera (Testo 865, Testo SE & Co. KGaA, Germany). MR data were obtained using a resistive 0.1T-biplanar scanner (EAR54L, Drusch & Cie, France). Setting TRα=8ms and TR=2s, a stack of 246 3D-images was acquired at each temperature points (TE=4.1ms, resolution=3x3x20mm3, matrix=64x35x3, 50% sampling, pixel bandwidth=312Hz). 1 signal average was employed, leading to an acquisition time of 2min56s. A Bland-Altman plot provides a comparison between the proposed temperature mapping method and ground truth measurements.
Results
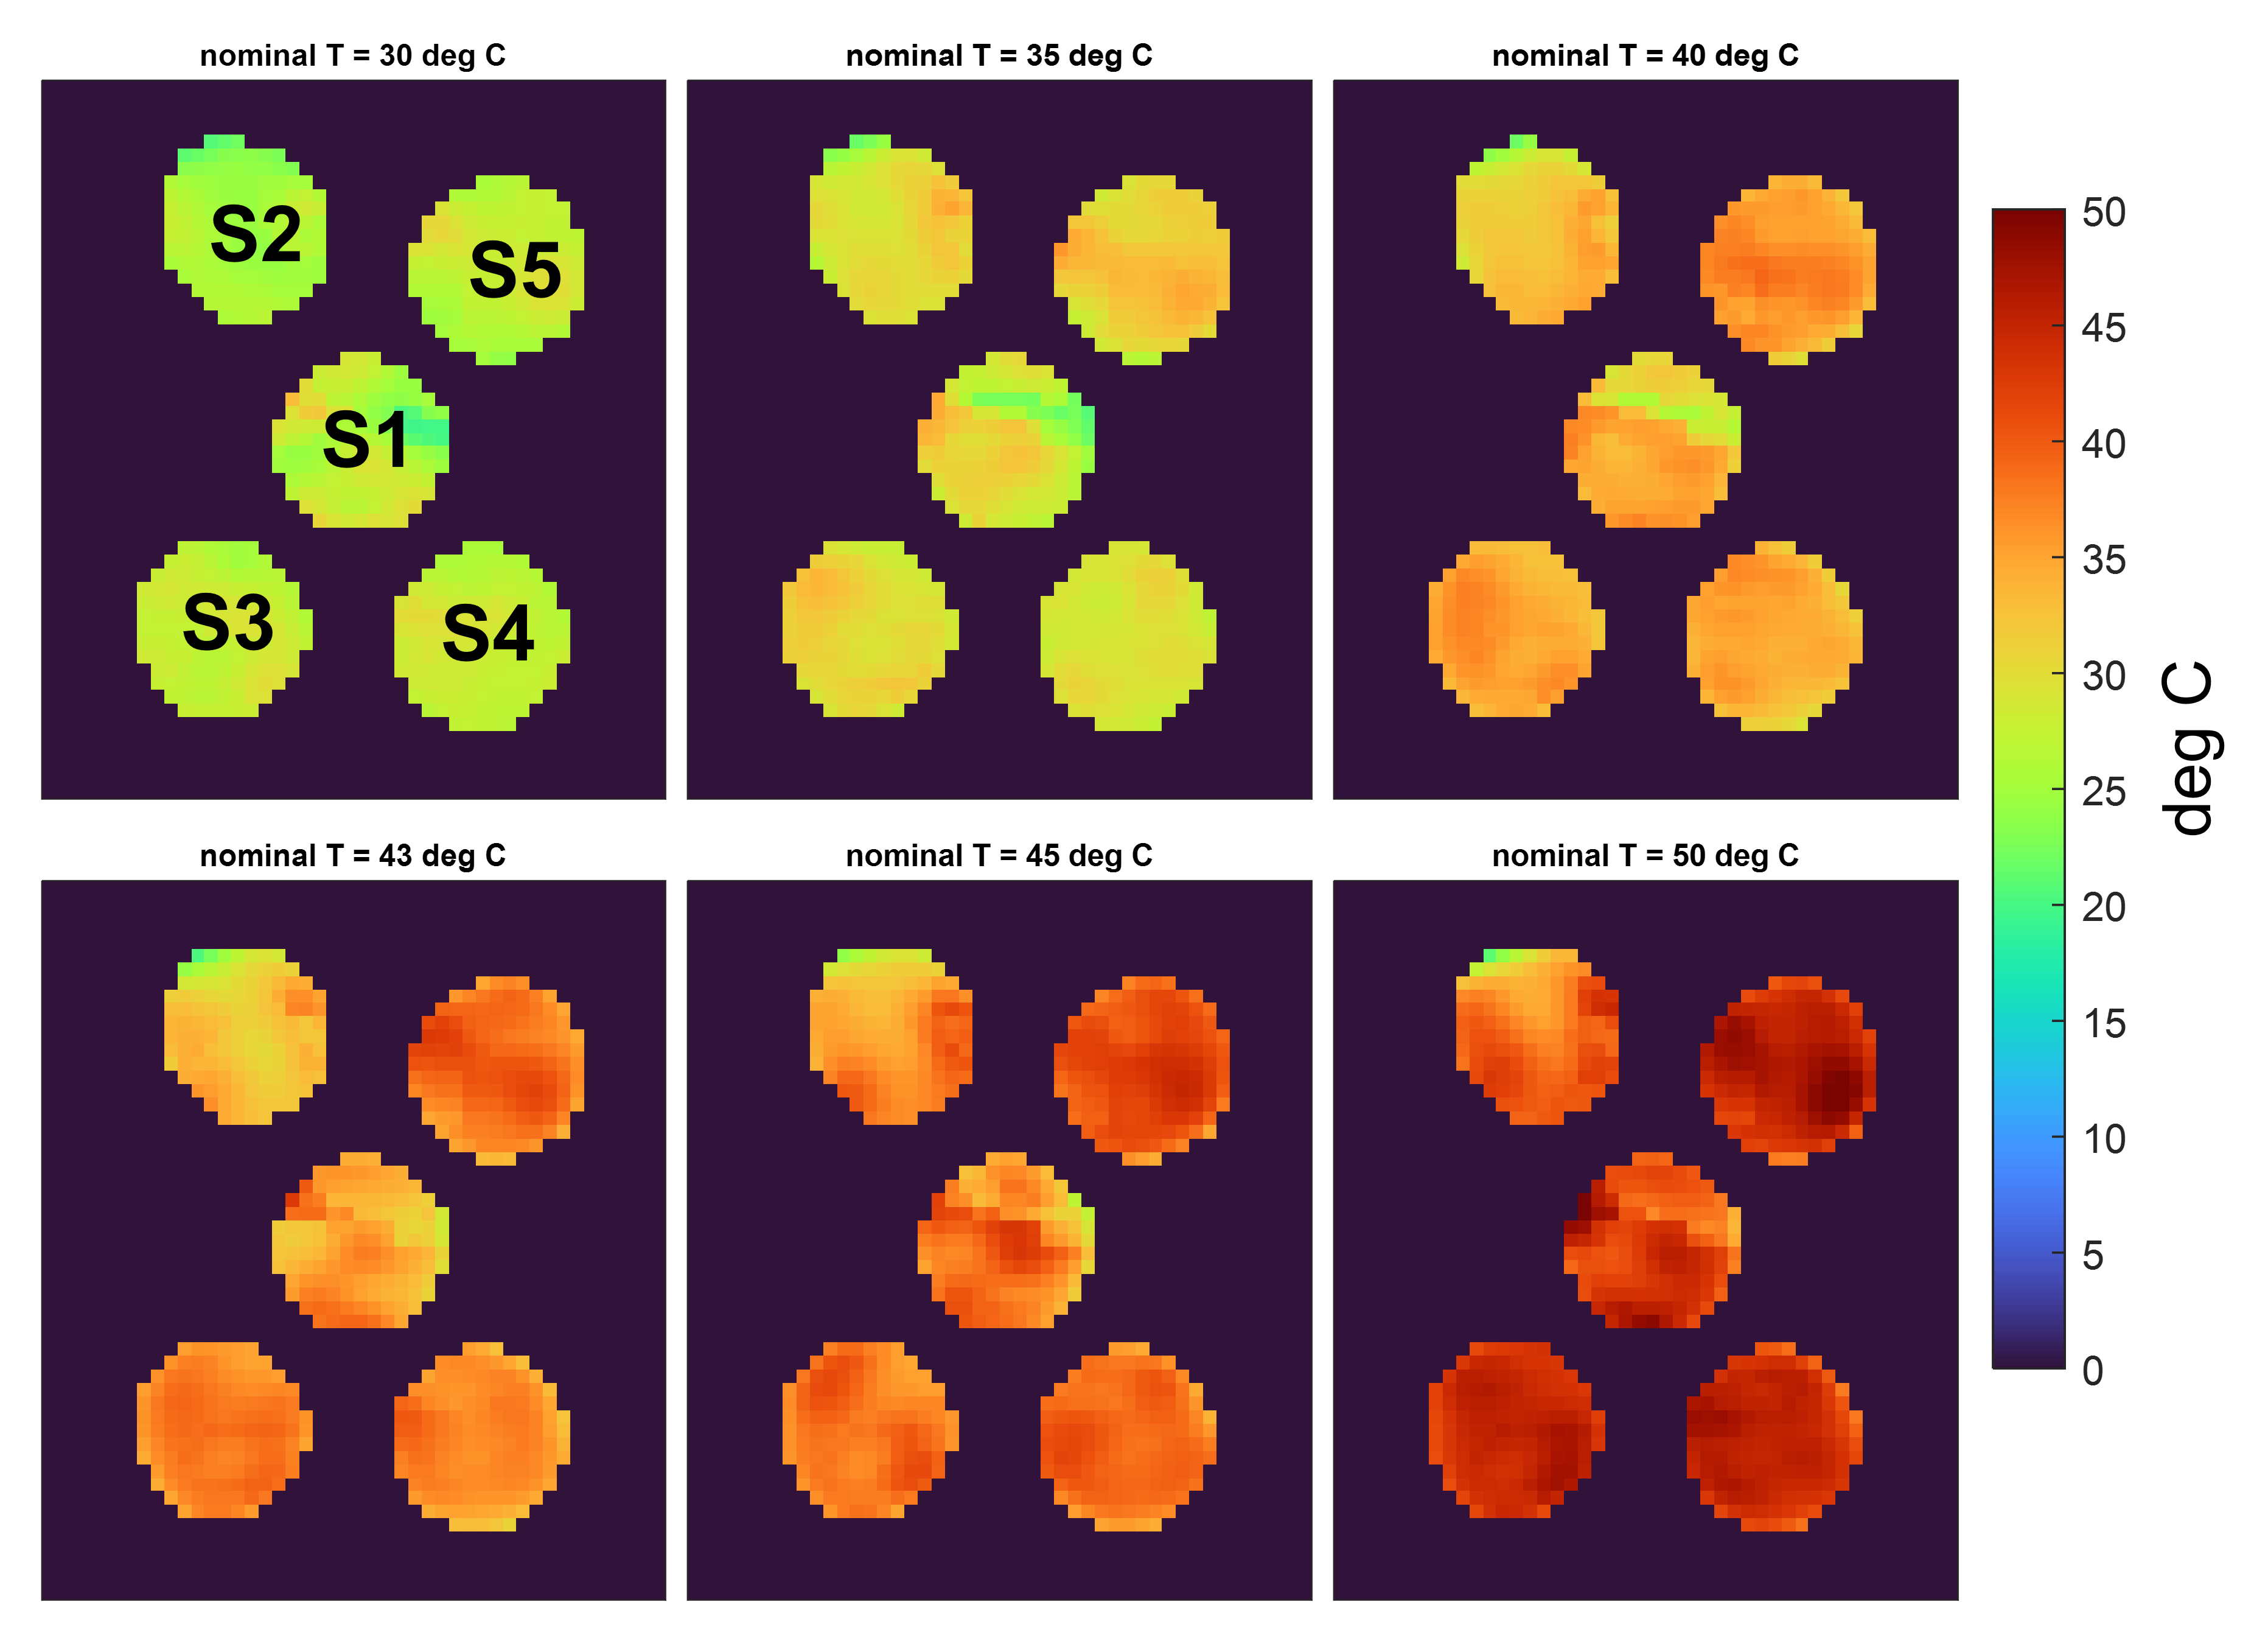
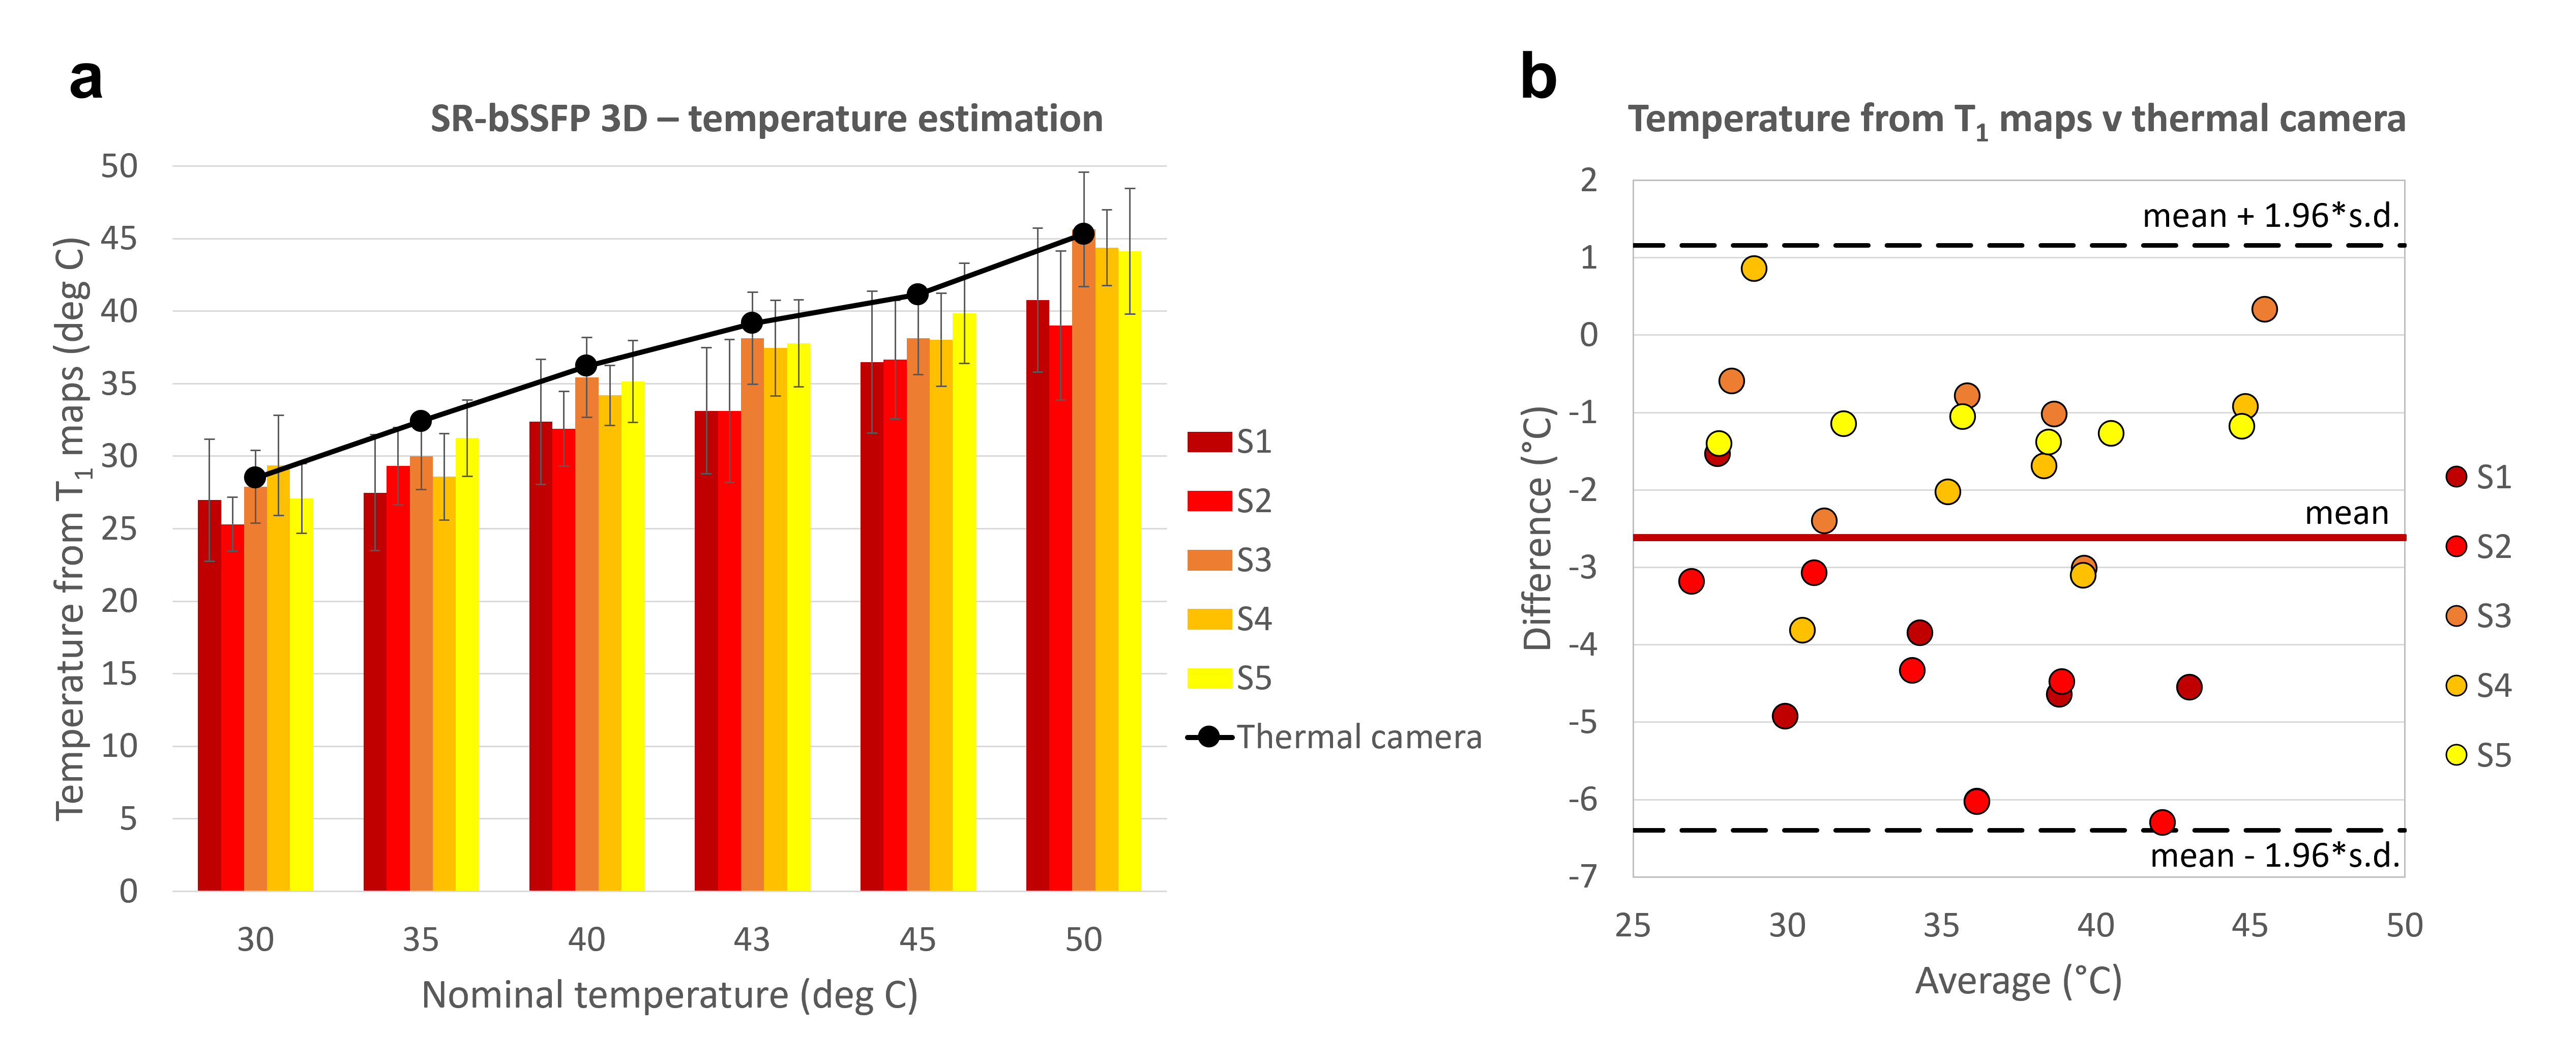
The estimated temperature maps are presented in Fig.2. An average intra-vial dispersion of 3.4±0.9°C was measured. Fig.3a shows the mean temperature calculated for each sample next to the thermal camera measures obtained at each temperature step. The Bland-Altman plot identified a bias of -2.6±1.9°C (Fig.3b).Discussion
The combination of the bSSFP approach and 3D volume acquisition inherently permit to gather more signal, which translates into shorter scan time. Here, only 1 single average was used, effectively approaching the temporal resolution achievable using a high field scanner. This also allowed to keep a simpler sequence architecture, additionally removing the trade-off between number of slices and TRα length typical of interleaved slice sampling. Key to a bSSFP-based sequence, the exponential trend is now independent of the chosen TRα (Eq.2), which on the other hand plays a major role in the modelling of T1* and M0** when a GRE Look-Locker sequence is used12. Additionally, when combined to small α pulses, T1* provides a good approximation of T1, neglecting the need for a B1+ map. Hence, this sequence represents an upgrade of a previously presented Look-Locker-based saturation recovery GRE sequence9. Choosing comparable parameters to our previous work9 (specifically TR and spatial resolution), we could reduce the temporal resolution from 3min20s/slice to 20s/slice. This time is well within the sampling time of 10min recommended for hyperthermia treatments1, where temperature variations happen slowly and over a heating time of 30 to 90min13. The interpolated resolution of 22.5mm3 is also well within the suggested indication of 125mm3 1. The obtained temperature bias is instead slightly higher than the recommended accuracy of 1°C14. Nevertheless, the temperature estimation is affected by the lower accuracy achieved when dealing with sample 1 and 2 (Fig.3b), characterised by short T1. Optimisation of the sequence parameters and model for short-T1 tissue species, as well as upgrade of our gradients slew rate performances could help tailor the acquisition for a specific tissue type/organ.Conclusions
Fast and precise temperature mapping at low magnetic field is challenging due to the inherently low SNR, which calls for multiple signal averages. Thanks to bSSFP, the presented T1-based temperature mapping sequence represents a fast and robust method for MR thermometry at low field, which significantly accelerates the scan time required when compared to a GRE-based sequence9. These results provide a solid ground to extend the investigation of this method to MR-guided hyperthermia in vivo.Acknowledgements
This research was funded by the Swiss National Science Foundation Grants No. 170575, No. 186861 and No. 198905. The authors would like to thank the COST Action CA15209 for the insightful discussions.References
1Feddersen T V, Hernandez-Tamames JA, Franckena M, van Rhoon GC, Paulides MM. Clinical Performance and Future Potential of Magnetic Resonance Thermometry in Hyperthermia. Cancers. 2020;13(1):31. doi:10.3390/cancers13010031
2Fani F, Schena E, Saccomandi P, Silvestri S. CT-based thermometry: An overview. Int J Hyperth. 2014;30(4):219-227. doi:10.3109/02656736.2014.922221
3Kok HP, Wust P, Stauffer PR, Bardati F, van Rhoon GC, Crezee J. Current state of the art of regional hyperthermia treatment planning: A review. Radiat Oncol. 2015;10(1):1-14. doi:10.1186/s13014-015-0503-8
4Odéen H, Parker DL. Magnetic resonance thermometry and its biological applications – Physical principles and practical considerations. Prog Nucl Magn Reson Spectrosc. 2019;110:34-61. doi:10.1016/j.pnmrs.2019.01.003
5Rinck PA, Fischer HW, Vander Elst L, Van Haverbeke Y, Muller RN. Field-cycling relaxometry: Medical applications. Radiology. 1988;168(3):843-849. doi:10.1148/radiology.168.3.3406414
6Fischer HW, Rinck PA, van Haverbeke Y, Muller RN. Nuclear relaxation of human brain gray and white matter: Analysis of field dependence and implications for MRI. Magn Reson Med. 1990;16(2):317-334. doi:10.1002/mrm.1910160212
7Koenig SH, Brown RD. Determinants of Proton Relaxation Rates in Tissue. Magn Reson Med. 1984;1(4):437-449. doi:10.1002/mrm.1910010404
8Bottomley PA, Foster TH, Argersinger RE, Pfeifer LM. A review of normal tissue hydrogen NMR relaxation times and relaxation mechanisms from 1-100 MHz: Dependence on tissue type, NMR frequency, temperature, species, excision, and age. Med Phys. 1984;11(4):425-448. doi:10.1118/1.595535
9Fiorito M, Yushchenko M, Cicolari D, Sarracanie M, Salameh N. In vivo T1 quantification at 0.1 T using a fast, interleaved Look-Locker based T1 mapping sequence. In: ISMRM & SMRT Annual Meeting Exhibition. ; 2021.
10Schmitt P, Griswold MA, Jakob PM, et al. Inversion Recovery TrueFISP: Quantification of T1, T2, and Spin Density. Magn Reson Med. 2004;51(4):661-667. doi:10.1002/mrm.20058
11Fiorito M, Yushchenko M, Cicolari D, Sarracanie M, Salameh N. Low Field MR Thermometry with a Fast, Interleaved Look-Locker based T1 Mapping Approach. In: ISMRM & SMRT Annual Meeting Exhibition. ; 2020.
12Deichmann R. Fast High-Resolution T1 Mapping of the Human Brain. Magn Reson Med. 2005;54(1):20-27. doi:10.1002/mrm.20552
13Overgaard J, Suit HD. Time-Temperature Relationship in Hyperthermic Treatment of Malignant and Normal Tissue in Vivo. Cancer Res. 1979;39(8):3248-3253.
14Wlodarczyk W, Boroschewski R, Hentschel M, Wust P, Mönich G, Felix R. Three-dimensional monitoring of small temperature changes for therapeutic hyperthermia using MR. J Magn Reson Imaging. 1998;8(1):165-174. doi:10.1002/jmri.1880080129
Figures