2172
Finding the optimal temperature calibration for postmortem MRS thermometry in forensic medicine1Institute of Forensic Medicine, University of Zurich, Zurich, Switzerland, 2Zurich University Hospital of Psychiatry, University of Zurich, Zurich, Switzerland, 3Clinic of Diagnostic Imaging, Vetsuisse Faculty, University of Zurich, Zurich, Switzerland
Synopsis
MRI and MRS are finding more and more their way into forensic medicine. Unlike in vivo measurements, however, the temperature of cadavers in forensic medicine varies considerably and affects the performed measurement. The present study investigated how well published calibrations measured in vivo or in phantoms are suited for postmortem MRS thermometry. Postmortem MRS thermometry would allow to estimate and possibly correct the effects of the local temperature in a forensic setting. The study reveals that despite strong postmortem changes, a reliable estimation of the local temperature over up to 60 hours after death is possible with available temperature calibrations.
Introduction
With the increased use of non-invasive or minimally invasive methods, MRI and MRS are finding their way into forensic medicine1,2. Unlike in vivo measurements, however, the temperature of cadavers in everyday forensic medicine varies considerably (~0-37 oC) and thus influences relaxation times, concentration estimates and chemical shifts3. MRS thermometry allows an estimation of the local temperature with an accuracy of a few tenths of a degree4. It is based on the chemical shift difference between water and a reference metabolite. This difference varies at different temperatures due to the temperature dependence of the chemical shift of water. However, an appropriate calibration is required to convert the chemical shift difference between water and the reference metabolite into a valid temperature estimation. For calibration, one simultaneously measures the temperature and the chemical shift difference in a controlled setting5.Published calibrations on this topic were determined in either animal models or phantoms and may vary significantly in terms of slope and intercept of the identified calibration line. An important reason for this is the different consideration of important variables such as ionic content, protein content, local susceptibilities or pH value that can also affect the chemical shift difference between water and the reference metabolite. In postmortem measurements, these variables may vary due to individual differences before death, but also due to postmortem changes. For example, pH decreases due to anaerobic glycolysis to about 6.3 within the first 9 hours after death. Postmortem changes can therefore potentially influence the measured temperature, and thus in principle require different calibrations. In this work, we have investigated how well published calibrations are suited for postmortem MRS thermometry.
Methods
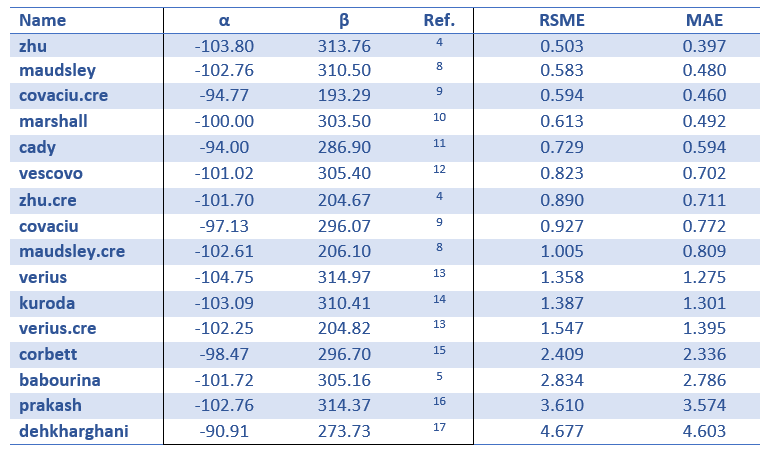
Most temperature calibrations are available for NAA as the reference metabolite (Table 1). Postmortem, the NAA signal has been described to decay strongly with longer postmortem interval (PMI). Therefore, NAA cannot be a universal reference for postmortem MRS thermometry. On the other hand, the lactate signal is easily detectable within few minutes after death and the chemical shift from methyl protons of lactate has shown to be insensitive to temperature and pH (5.94 to 7.8 pH)6. We therefore adapted the available calibrations for NAA to be able to estimate the local temperature $$$T_{MRS.Lac}$$$ using the chemical shift difference between water and lactate instead ($$$\Delta_{(H2O-Lac)}$$$).$$T_{MRS.Lac}=\alpha\cdot\Delta_{(H2O-Lac)}+\beta+\alpha\cdot\Delta_{(Lac-NAA)}$$
For that we assumed the temperature dependence of $$$\Delta_{(Lac-NAA)}$$$ to be negligible and set $$$\Delta_{(Lac-NAA)}$$$ to -0.69055 7. In addition, we also investigated the few calibrations available for the water chemical shift relative to creatine ($$$\Delta_{(H2O-Cre)}$$$) (Table 1) without postmortem adaptations, as creatine is reported to be stable throughout the PMI.
$$T_{MRS.Cre}=\alpha\cdot\Delta_{(H2O-Cre)}+\beta$$
Measurements
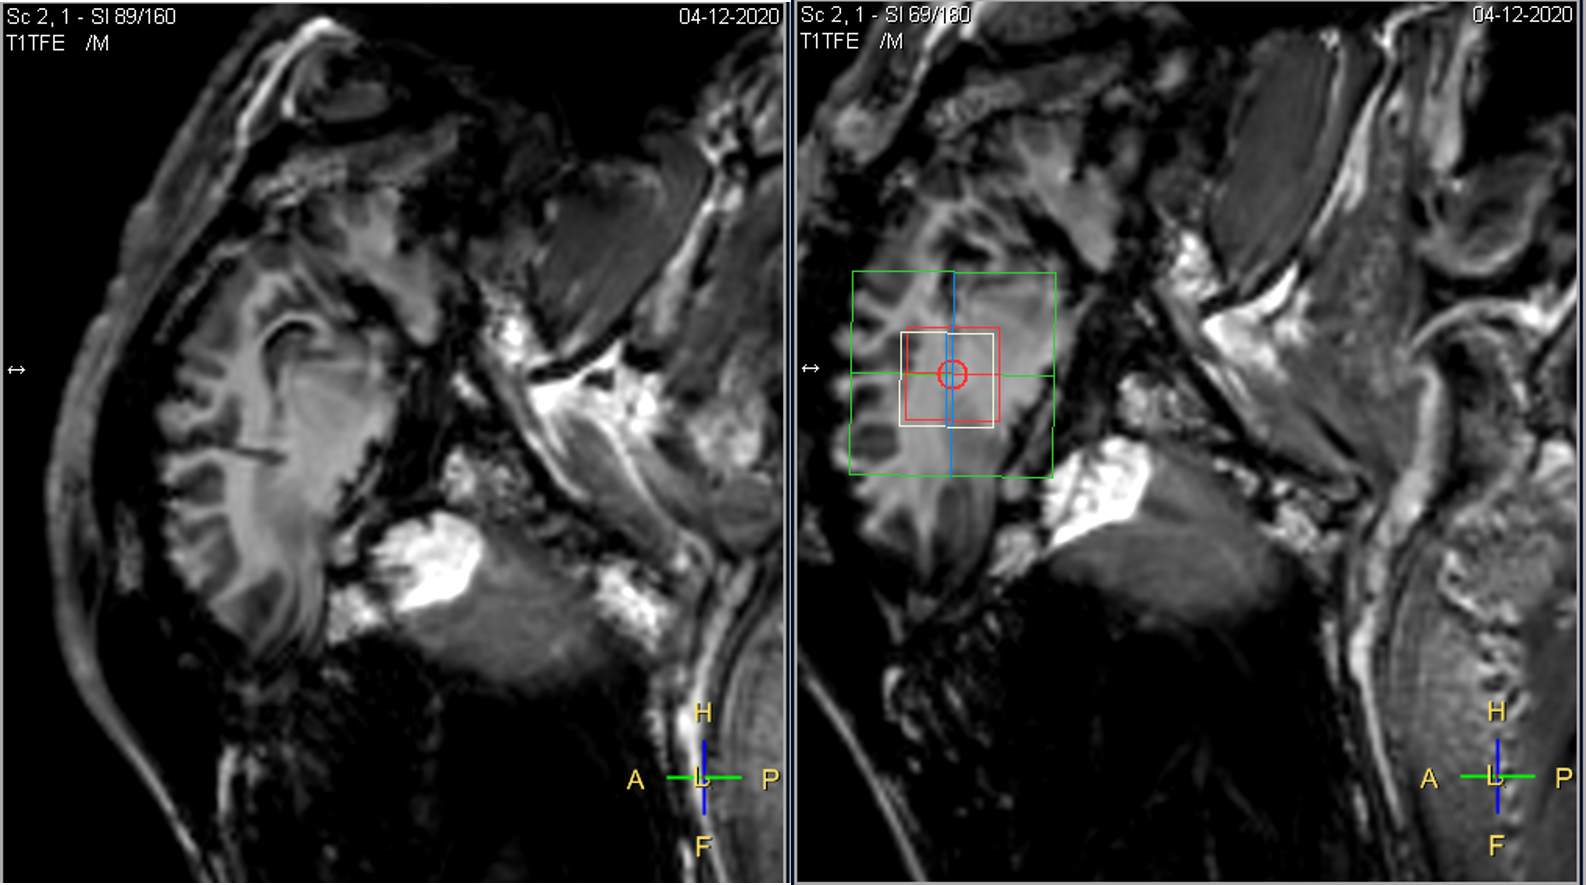
To determine the optimal available calibration, we simultaneously determined the chemical shift difference between water and the reference metabolite (lactate or creatine) and recorded the temperature in a total of three severed sheep heads as soon as possible after death. Temperature probes were inserted into the brain tissue through a pre-existing borehole for continuous recording (Fig.1). MRS measurements were performed on the contralateral side continuously for the first few hours until sheep heads approached room temperature. After that, three measurements each were performed again at intervals of approx. six hours until the spectral quality had become insufficient due to decomposition processes.
The chemical shift of lactate (center of methyl peaks) and creatine (methyl peak) were determined using “findpeaks” in Matlab in the eddy current corrected spectra. The position of water was determined the same way in the water-unsuppressed spectrum.
MRS Settings
PRESS localization (TR: 2288 ms, TE: 30 ms, readout duration 512 ms, bandwidth 4000 Hz, 4ml voxel size, 192 NSA, Scan time: 7 min 33 sec) with VAPOR water suppression. At the beginning of each scan, a water-unsuppressed spectrum was acquired.
Hardware
3-Tesla whole-body MRI scanner (Achieva, Philips Healthcare) / 8-channel phased-array receive-only head coil.
Results
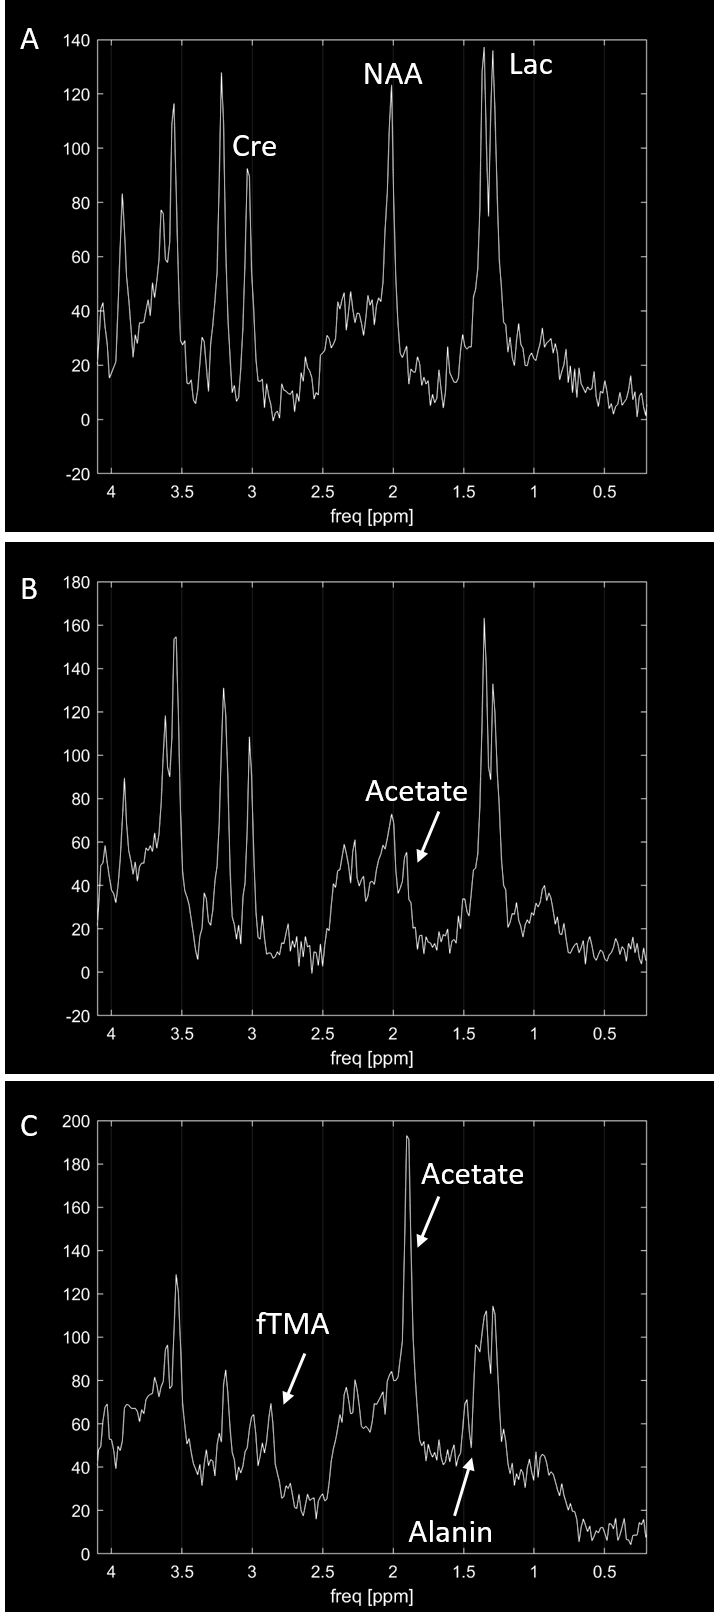
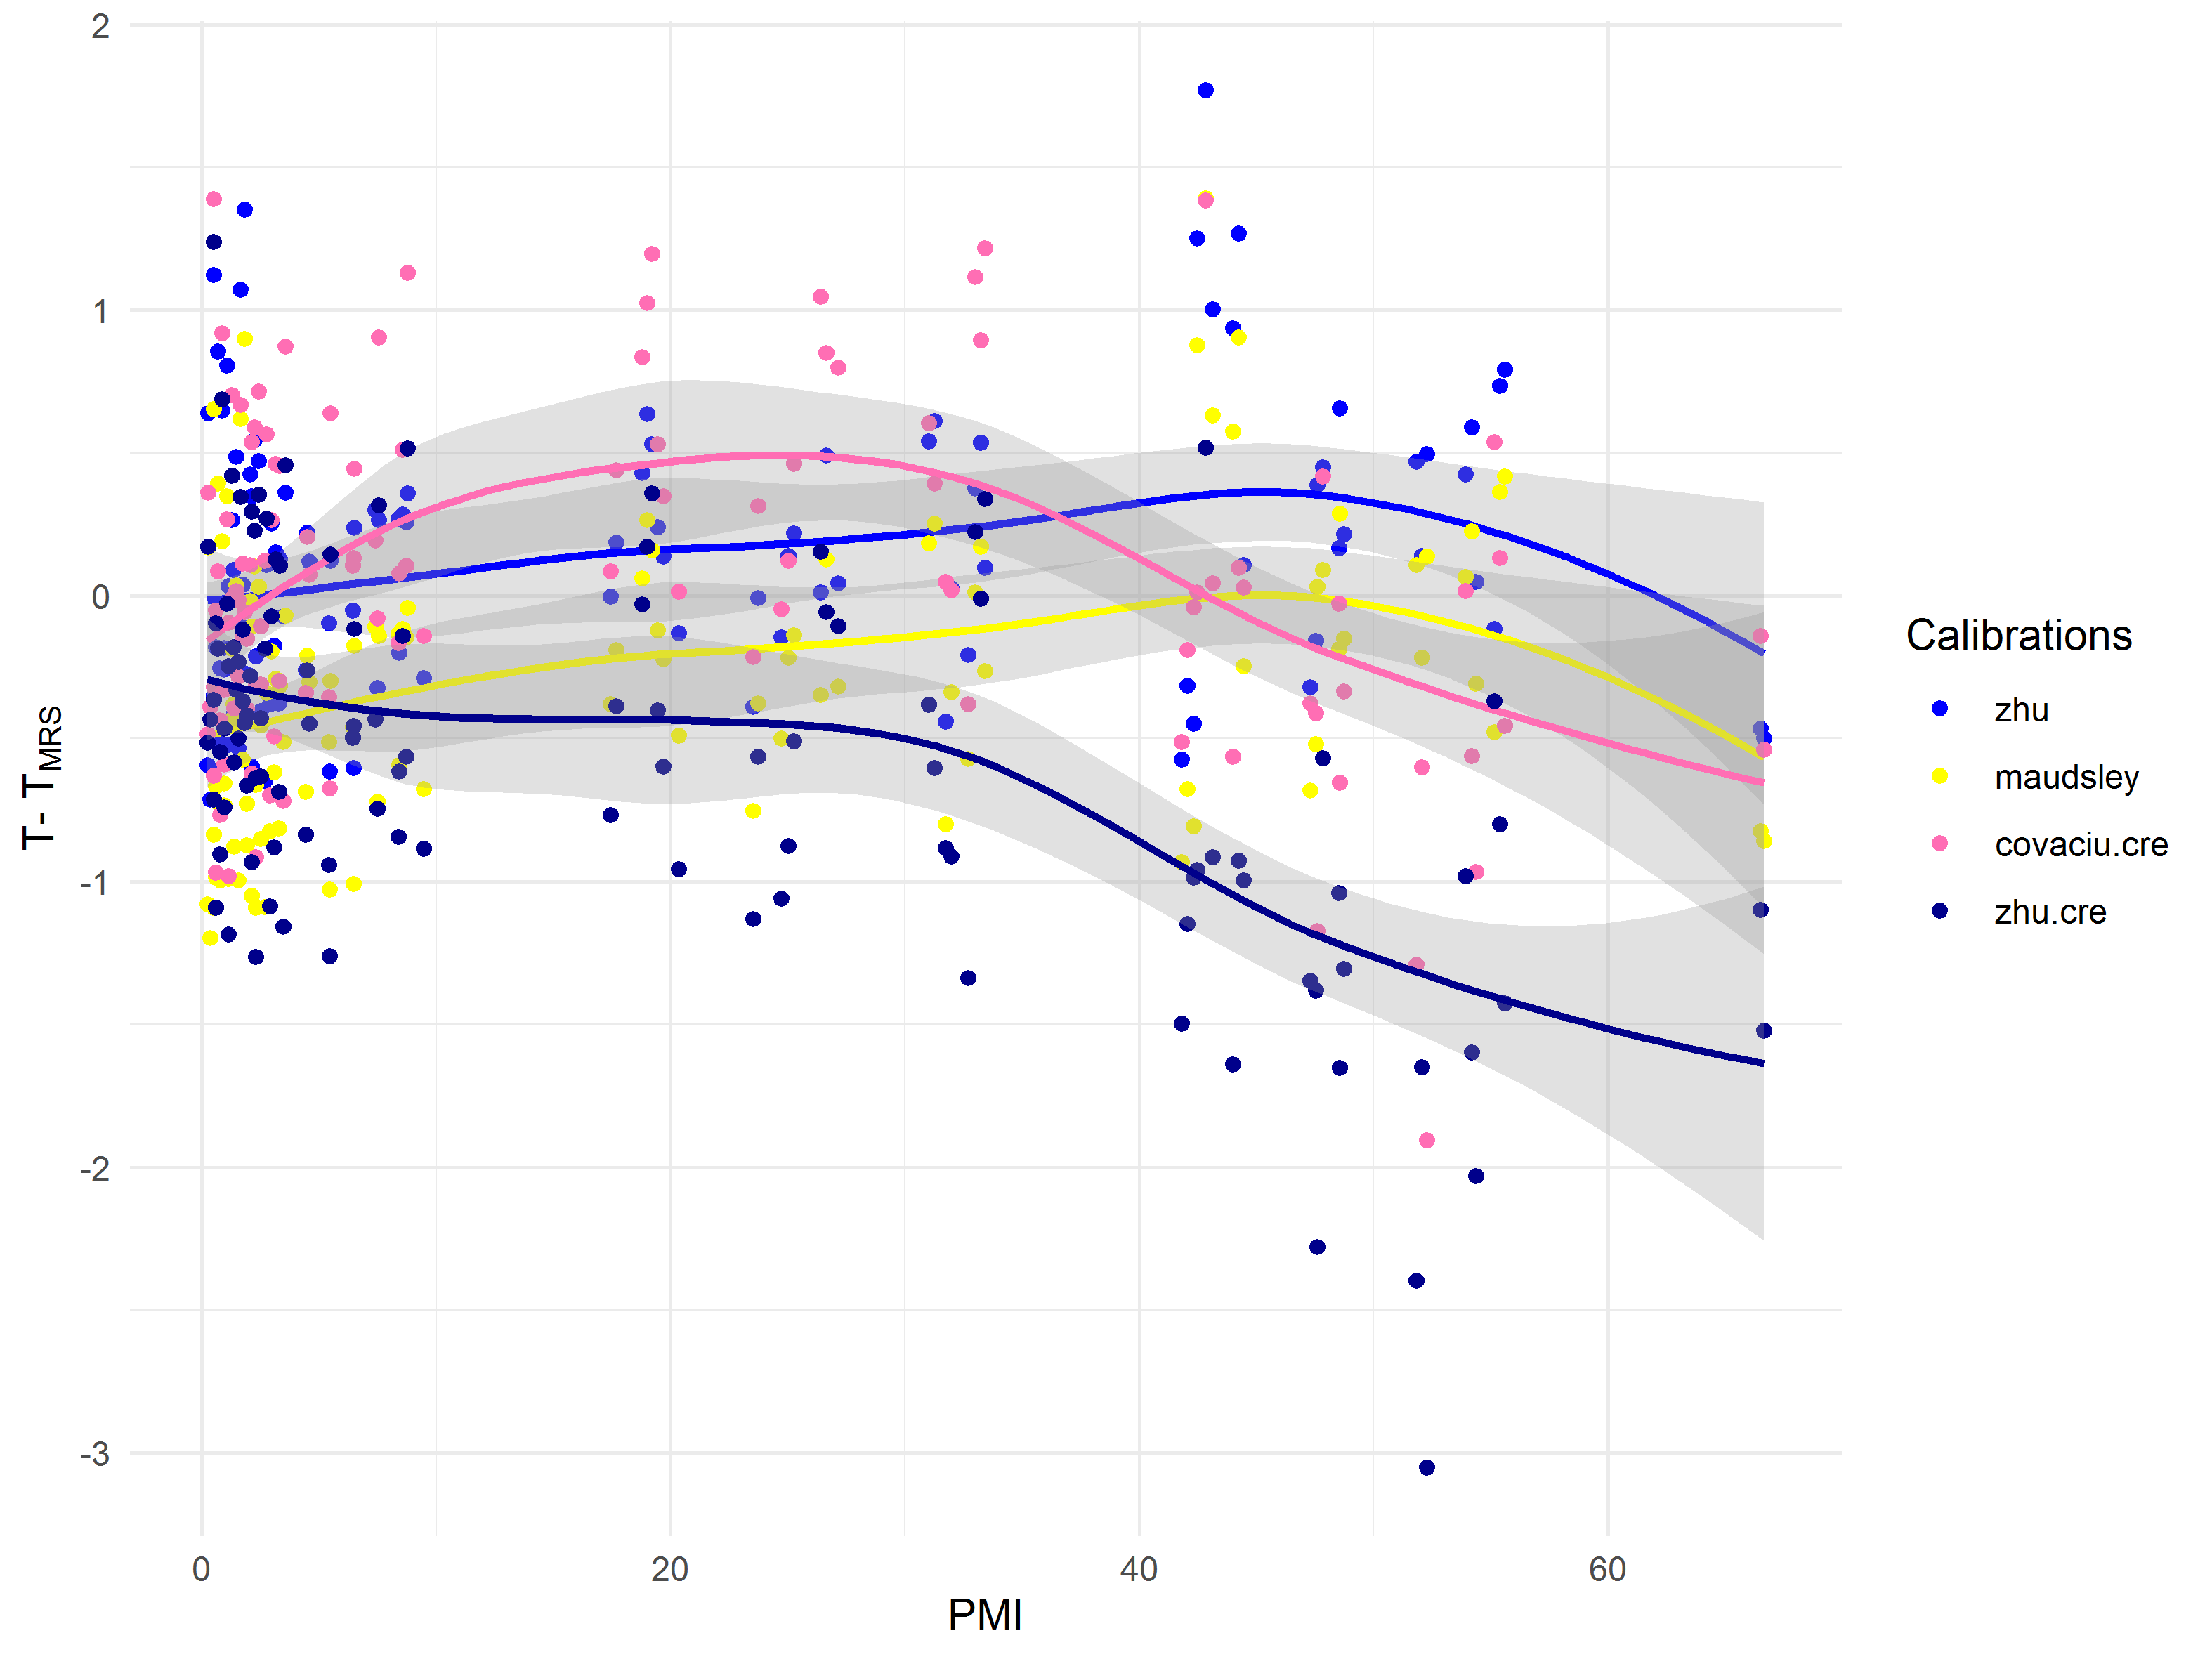
The three sheep heads were measured for 67, 49 and 54 hours respectively resulting in 117 spectra with sufficient quality (Fig.2). Based on these spectra $$$T_{MRS.Lac}$$$ and $$$T_{MRS.Cre}$$$ were estimated using different calibrations and compared to the measured true temperature $$$T$$$. The ranking of the calibrations based on their performance is shown in Table 1. With the calibration zhu, 94% of the $$$T_{MRS.Lac}$$$ values are within ±1 oC of the measured temperature $$$T$$$. Little change in the differences $$$T-T_{MRS.Lac}$$$ is detectable with increasing PMI (Fig.3).Discussion
The spectra show clear postmortem changes. However, despite these strong postmortem changes, a reliable estimation of the local temperature over up to 60 hours after death is possible with available calibrations. The difference $$$T-T_{MRS.Lac}$$$ shows little change over time for most calibrations, so the postmortem changes appear to have little effect on $$$T_{MRS.Lac}$$$. We therefore think that in the brain of an intact corpse temperature measurements should be possible even with a longer PMI.For some of the calibration, however, a distinct bias is observed, the cause of which is difficult to estimate8. In general, the precision of the temperature estimation could be improved by using peak fitting methods4. The observed changes for $$$T-T_{MRS.Cre}$$$ are primarily due to the increased uncertainty in the determination of peak position with longer PMI or errors in the calibration slope.
Acknowledgements
No acknowledgement found.References
1. Heimer J, Gascho D, Madea B, et al. Comparison of the beta-hydroxybutyrate, glucose, and lactate concentrations derived from postmortem proton magnetic resonance spectroscopy and biochemical analysis for the diagnosis of fatal metabolic disorders. International Journal of Legal Medicine. 2020:1-10.
2. Thali MJ, Yen K, Schweitzer W, et al. Virtopsy, a new imaging horizon in forensic pathology: virtual autopsy by postmortem multislice computed tomography (MSCT) and magnetic resonance imaging (MRI)-a feasibility study. Journal of forensic sciences. 2003;48(2):386-403.
3. Wermter FC, Mitschke N, Bock C, Dreher W. Temperature dependence of (1)H NMR chemical shifts and its influence on estimated metabolite concentrations. MAGMA. 2017;30(6):579-590.
4. Zhu M, Bashir A, Ackerman JJ, Yablonskiy DA. Improved calibration technique for in vivo proton MRS thermometry for brain temperature measurement. Magn Reson Med. 2008;60(3):536-541.
5. Babourina-Brooks B, Simpson R, Arvanitis TN, Machin G, Peet AC, Davies NP. MRS thermometry calibration at 3 T: effects of protein, ionic concentration and magnetic field strength. NMR Biomed. 2015;28(7):792-800.
6. Lutz N, Kuesel A, Hull W. A 1H‐NMR method for determining temperature in cell culture perfusion systems. Magnetic resonance in medicine. 1993;29(1):113-118.
7. Ulrich EL, Akutsu H, Doreleijers JF, et al. BioMagResBank. Nucleic acids research. 2007;36:D402-D408.
8. Maudsley AA, Goryawala MZ, Sheriff S. Effects of tissue susceptibility on brain temperature mapping. Neuroimage. 2017;146:1093-1101.
9. Covaciu L, Rubertsson S, Ortiz-Nieto F, Ahlstrom H, Weis J. Human brain MR spectroscopy thermometry using metabolite aqueous-solution calibrations. J Magn Reson Imaging. 2010;31(4):807-814.
10. Marshall I, Karaszewski B, Wardlaw JM, et al. Measurement of regional brain temperature using proton spectroscopic imaging: validation and application to acute ischemic stroke. Magn Reson Imaging. 2006;24(6):699-706.
11. Cady EB, D'Souza PC, Penrice J, Lorek A. The estimation of local brain temperature by in vivo 1H magnetic resonance spectroscopy. Magnetic resonance in medicine. 1995;33(6):862-867.
12. Vescovo E, Levick A, Childs C, Machin G, Zhao S, Williams SR. High-precision calibration of MRS thermometry using validated temperature standards: effects of ionic strength and protein content on the calibration. NMR Biomed. 2013;26(2):213-223.
13. Verius M, Frank F, Gizewski E, Broessner G. Magnetic Resonance Spectroscopy Thermometry at 3 Tesla: Importance of Calibration Measurements. Ther Hypothermia Temp Manag. 2019;9(2):146-155.
14. Kuroda K, Takei N, Mulkern RV, et al. Feasibility of internally referenced brain temperature imaging with a metabolite signal. Magnetic Resonance in Medical Sciences. 2003;2(1):17-22.
15. Corbett RJ, Laptook AR, Tollefsbol G, Kim B. Validation of a noninvasive method to measure brain temperature in vivo using 1H NMR spectroscopy. Journal of neurochemistry. 1995;64(3):1224-1230.
16. Prakash BK, Verma SK, Marchenko Y, et al. Echo planar spectroscopic imaging based temperature calibration at 7T and 3T for whole brain temperature measurement in rodents and humans. Paper presented at: International Society of Magnetic Resonance in Medicine 2014; Milan.
17. Dehkharghani S, Mao H, Howell L, et al. Proton resonance frequency chemical shift thermometry: experimental design and validation toward high-resolution noninvasive temperature monitoring and in vivo experience in a nonhuman primate model of acute ischemic stroke. AJNR Am J Neuroradiol. 2015;36(6):1128-1135.
Figures