2170
Evaluation of Repeated MR Chemical Shift Brain Thermometry in Healthy Humans1Department of Neuroscience, Georgia Institute of Technology, Atlanta, GA, United States, 2Department of Radiology and Imaging Sciences, Emory University School of Medicine, Atlanta, GA, United States, 3Department of Biomedical Engineering, Georgia Institute of Technology, Emory University, Atlanta, GA, United States, 4Department of Biostatistics and Bioinformatics, Emory University, Atlanta, GA, United States
Synopsis
Magnetic resonance (MR) chemical shift thermometry (CST) is the only method that can approximate absolute rather than relative temperature. Our goal was to evaluate repeated body and brain MR CST measurements and the brain-body temperature gradient in healthy human volunteers over a short time period. While brain, body, or the difference between brain and body temperatures were not significantly different, variations in brain temperature between measurements were observed suggesting fluctuations over short time periods. Further investigation into the time scale of brain temperature fluctuations, particularly under controlled conditions to account for physiological changes and neural activity, are warranted.
Introduction
Brain temperature is a key physiological parameter regulated by cerebral blood flow and metabolism.1,2 While brain temperature changes after injury or stroke are well-established, fluctuations due to visual3 and environmental stimuli4 have also been observed in healthy mammals; however, the extent of brain temperature dynamics over short time periods and relative to body temperature is uncharacterized. MR chemical shift thermometry (CST) is a well-acknowledged method of approximating absolute temperature using the difference in proton resonance frequency (PRF) between temperature-dependent water and a temperature-independent reference such as N-acetylaspartate (NAA).5 The goal of this study was to characterize changes in MR-measured brain, body, and the relationship between brain and body temperatures using repeated measurements in healthy volunteers.Methods
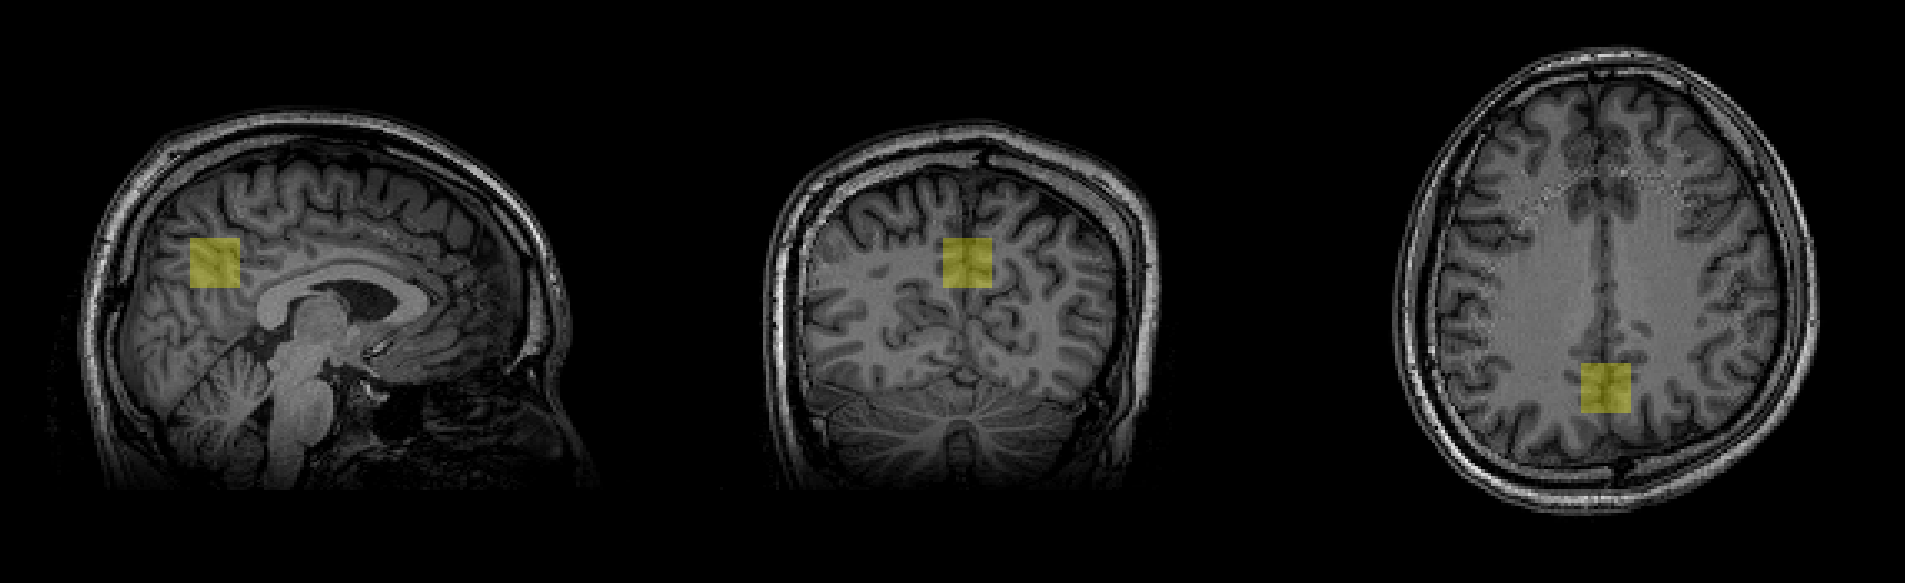
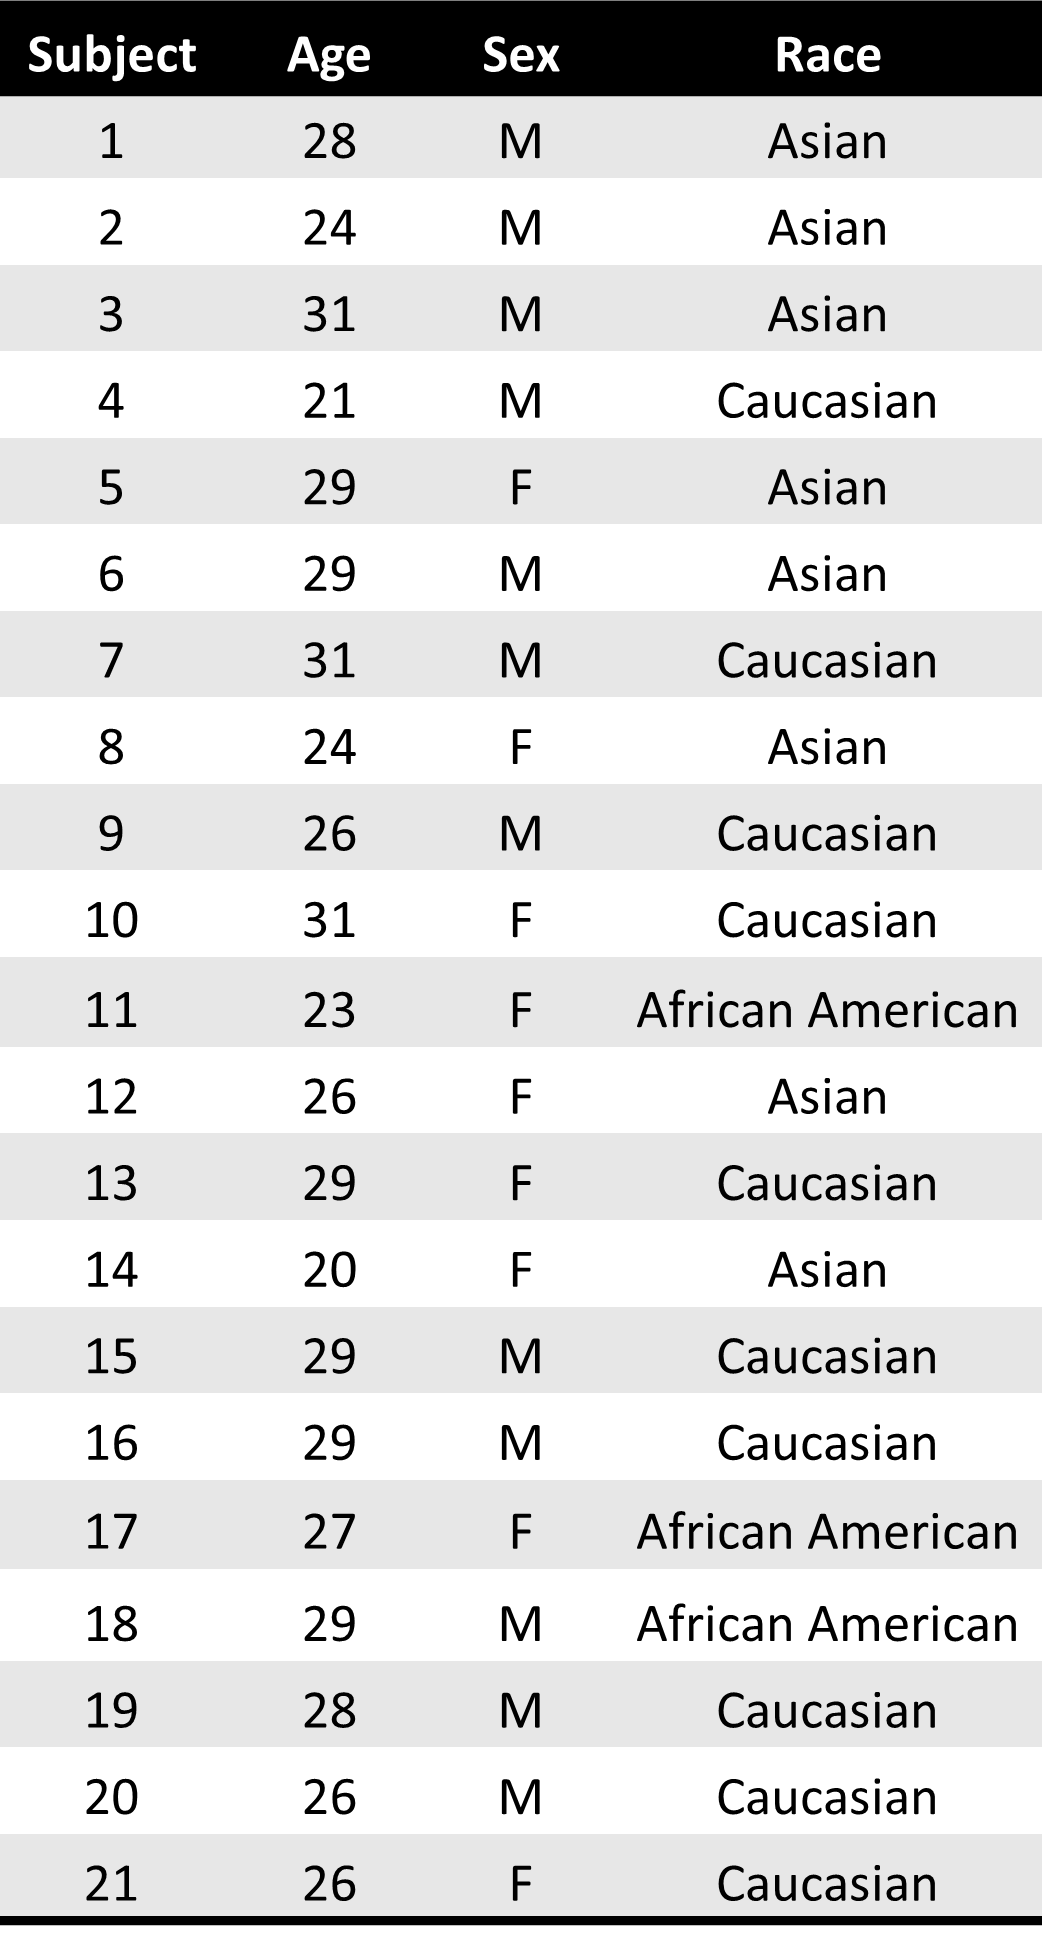
This prospective study was approved by the local Institutional Review Board and all subjects provided written informed consent. MR data from 21 healthy volunteers (9 females, 12 males; mean age=27±3 years old, Table 1) were acquired on a 3T MR scanner (PrismaFit, Siemens, Erlangen, Germany) with a 32-channel phased-array receive head coil. Structural images were acquired with a T1-weighted magnetization-prepared rapid gradient-echo (MPRAGE) sequence (TR/TI/TE=2300/900/3.39ms, flip angle=9°, FOV=256mm×256mm2, matrix size=192×192, 160 slices, slice thickness=1mm). For MR CST, single voxel spectroscopy (SVS) was acquired in the posterior cingulate cortex (Figure 1) twice on the same day, 1–1.5 hours apart, using the semi localized by adiabatic selective refocusing (sLASER) sequence (TR/TE=2000/68 ms; flip angle=90°; averages=128; spectral bandwidth=2000 Hz; complex data points=2048; voxel size=2x2x2 cm3; 120 Hz VAPOR water suppression bandwidth; non-water suppressed spectra, averages=8). Subjects were instructed to rest during the scan, provided a blanket upon request, and acclimated to the temperature in the scanner for >10 minutes prior to both MR thermometry scans. Subjects were removed from the scanner between acquisitions. Body temperature was measured continuously during the scan using an MR-compatible axillary probe and the mean values during MR thermometry acquisition are reported.Temperature was calculated from the chemical shift difference between NAA (water suppressed spectrum) and water (non-water suppressed spectrum) as previously described6 after fitting spectra in LCModel.7 All statistical analysis was performed using MATLAB (Mathworks) and values are presented as the mean ± standard deviation. Comparisons between scans were performed using paired t-tests (2-sided) and the intraclass correlation coefficient (ICC; null hypothesis ICC=0.5), and associations between brain and body temperature within scan sessions were determined using Pearson’s correlation coefficients. Significance was determined at p≤.05 for all analyses.
Results
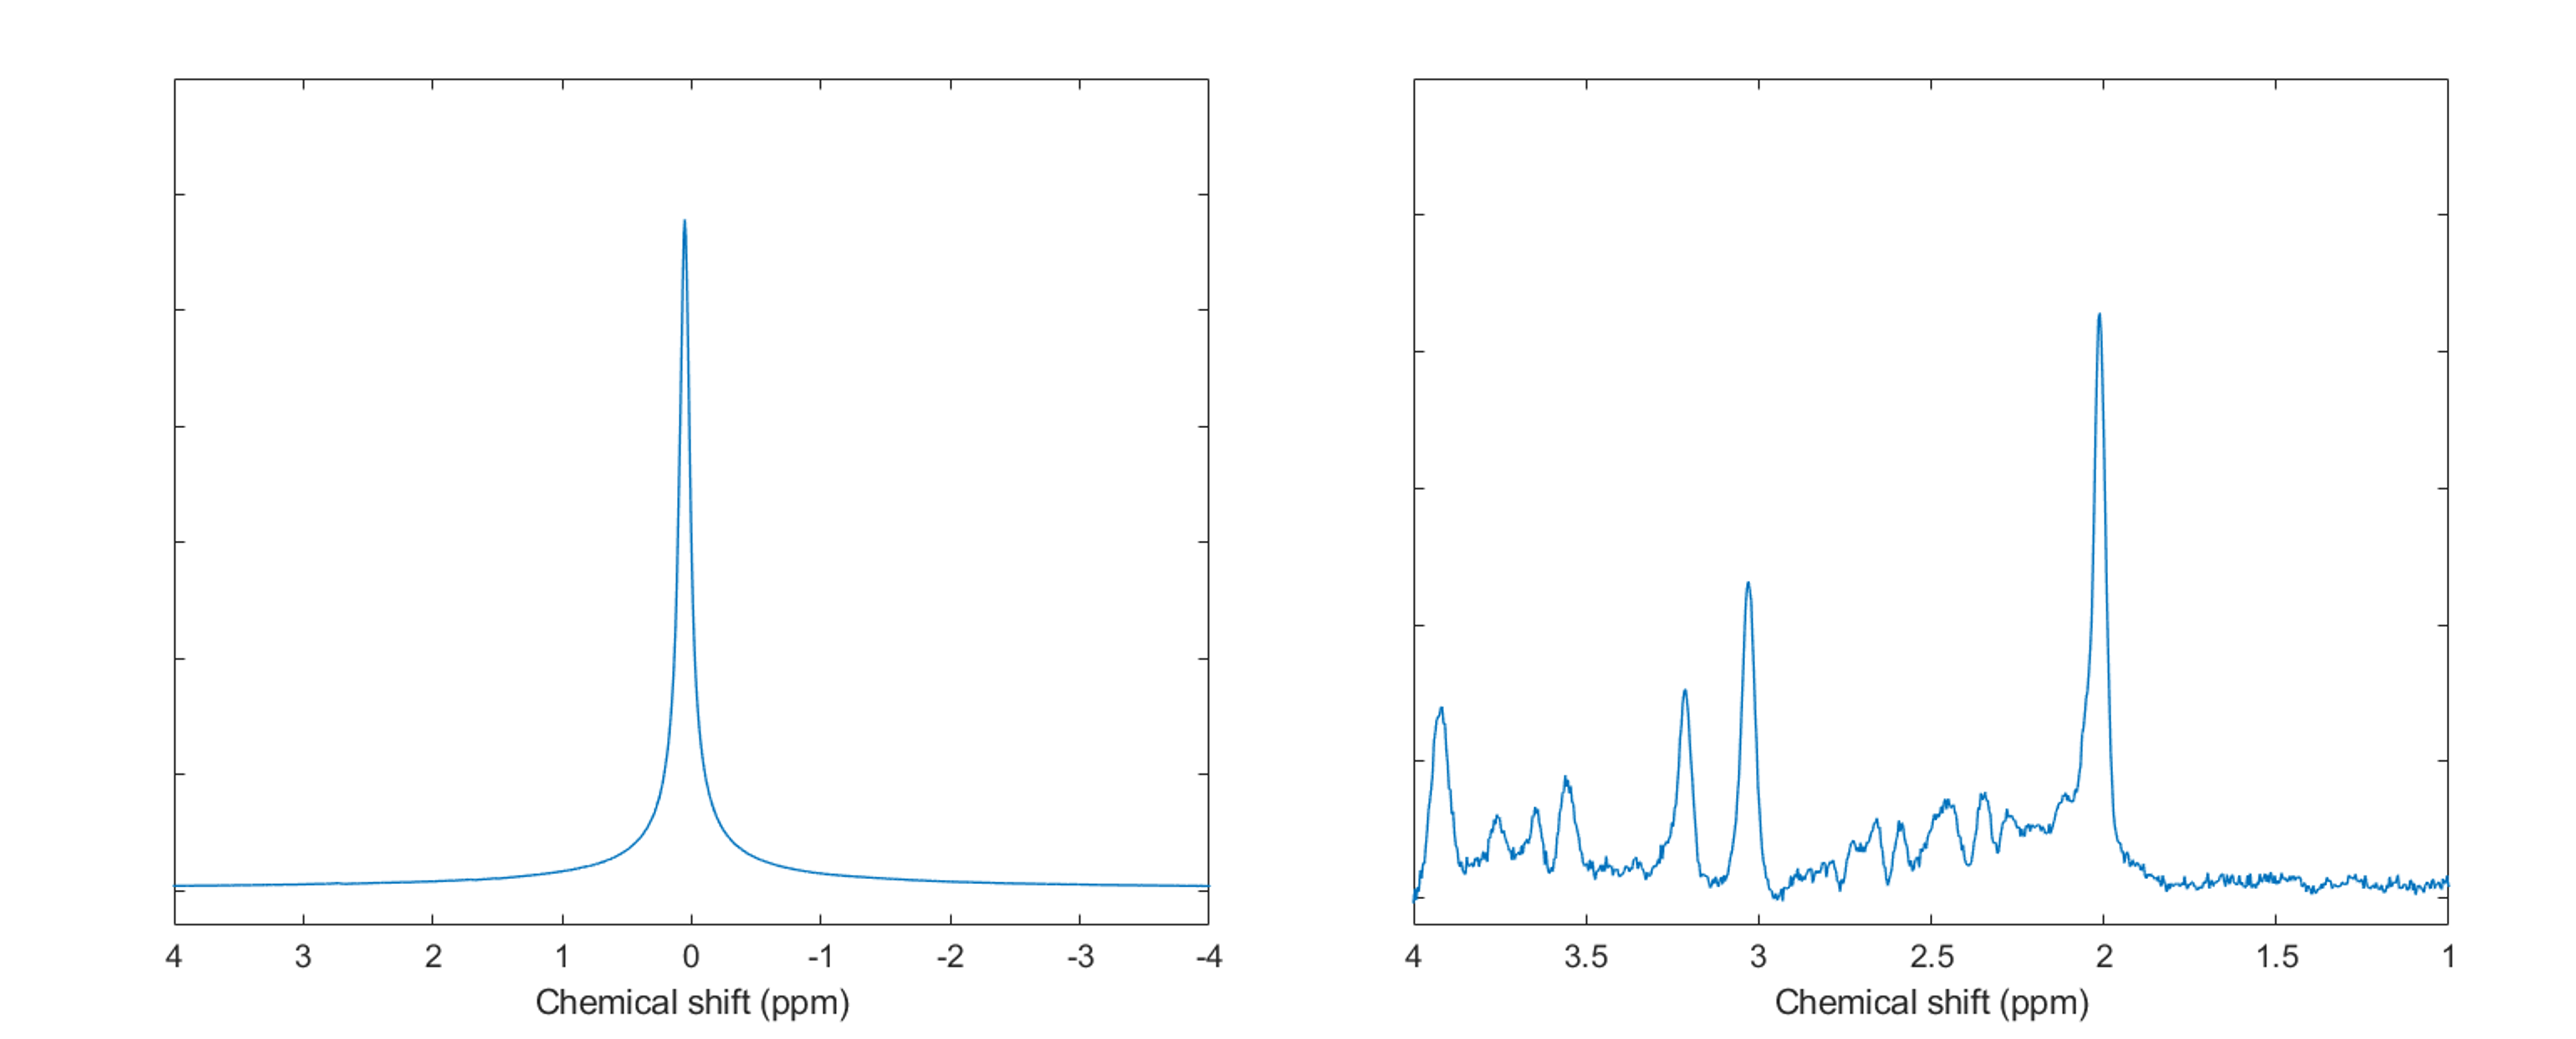
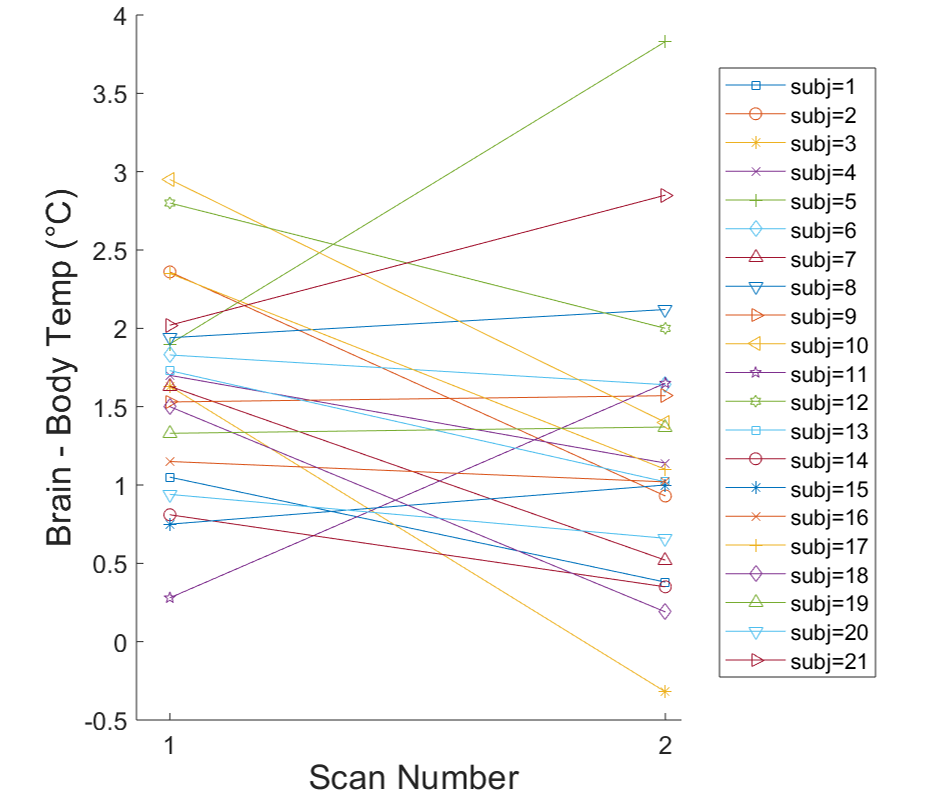
Water suppressed and non-water suppressed MR spectra acquired in subject 14 are shown in Figure 2 as an example of the high spectral quality observed for all scans. Brain temperature ranged from 35.9 to 39.7°C with mean temperatures of 37.9±0.8°C. The brain-body temperature gradient was positive for all but one measurement in one subject (mean for all subjects=1.4±0.8°C), consistent with prior studies.1 Paired t-tests did not reveal significant differences in brain (scan 1=38.1±0.6°C, scan 2=37.7±0.9°C, t=1.91, p=.07), body (scan 1=36.5±0.4°C, scan 2=36.5±0.4°C, t=0.15, p=.89), or difference in brain-body temperatures (scan 1=1.6±0.7°C, scan 2=1.3±0.9°C, t=1.76, p=.09). Further comparisons revealed a significant ICC between body temperature measurements (ICC=0.77, p=.02) but not brain temperature (ICC=0.26, p=.89) or brain-body temperature differences (ICC=0.25, p=.90). Pearson’s coefficients were not significant (p>.05) for brain and body temperature associations within scans (scan 1, r=0.13; scan 2, r=0.25). Brain-body temperature differences for most subjects were similar between scans (mean change=0.37°C), but variations were observed in both magnitude and direction (Figure 3). Six subjects had differences in the brain-body temperature gradient of >1°C across scans.Discussion and Conclusions
Brain temperature fluctuations are often correlated with body temperature in healthy mammals. Global brain and body temperatures have been shown to be associated in previous studies in non-human primates under anesthesia8 and in pooled subject data averaged across time and brain region;9,10 however, individual brain temperature fluctuations in non-anesthetized humans have not been investigated and continuous body temperature monitoring during MR scanning is rarely included. Repeated body temperature measurements were significantly correlated as expected, and variations between scans were attributed to ambient temperature changes or presence/absence of a blanket during the one or both MR scans. Our results suggest while brain temperature did not differ between scans across all subjects (from paired t-tests), the brain-body temperature gradient may vary in healthy humans over short time periods (minutes to hours). These results are consistent with studies in freely moving awake rats, demonstrating significant fluctuations in the brain-arterial temperature gradient ranging from negligible to >1°C in response to benign external stimuli.4 Neural activity, behavior, and normal physiology can modulate brain temperature as much as 2-4°C.1 Many subjects fell asleep during one or both scans, and effects of sleep cycle on brain temperature have been reported.11,12 Limitations include potential differences in voxel position and measurement uncertainty of MR thermometry ~0.2-0.8°C.5,8 Within subject variance, particularly brain temperature and brain-body temperature differences, reflects both physiological variance and measurement error and warrants additional investigation. These results emphasize the need for further characterization of healthy human brain temperature, particularly under controlled conditions to understand the extent of changes in brain temperature due to neural activity and physiology.Acknowledgements
This study was supported, in part, by the US National Institutes of Health (Grant number: 1R21EB029622).References
1. Kiyatkin, E.A., Brown, L.P., & Wise, R.A. Brain temperature fluctuation: a reflection of functional neural activation. European Journal of Neuroscience. 2002;16(1):164-168.
2. Wang, H., Wang, B., Normoyle, K. P., Jackson, K., Spitler, K., Sharrock, M. F., Miller, C. M., Best, C., Llano, D., & Du, R. Brain temperature and its fundamental properties: A review for clinical neuroscientists. Frontiers in Neuroscience. 2014;8(1):307.
3. Yablonskiy, D. A., Ackerman, J. J., & Raichle, M. E. Coupling between changes in human brain temperature and oxidative metabolism during prolonged visual stimulation. Proceedings of the National Academy of Sciences. 2000;97(13):7603–7608.
4. Kiyatkin, E. A. Brain temperature and its role in physiology and pathophysiology: Lessons from 20 years of thermorecording. Temperature. 2019;6(4):271–333.
5. Kuroda K. Non-invasive MR thermography using the water proton chemical shift. International Journal of Hyperthermia. 2005;21(6):547–560.
6. Marshall I, Karaszewski B, Wardlaw JM, Cvoro V, Wartolowska K, Armitage PA, Carpenter T, Bastin ME, Farrall A, & Haga K. Measurement of regional brain temperature using proton spectroscopic imaging: validation and application to acute ischemic stroke. Magnetic Resonance Imaging. 2006;24(6):699-706.
7. Provencher, S.W. Estimation of metabolite concentrations from localized in vivo proton NMR spectra. Magnetic Resonance in Medicine.1993;30(1):672–679.
8. Dehkharghani, S., Fleischer, C. C., Qiu, D., Yepes, M., & Tong, F. Cerebral temperature dysregulation: MR thermographic monitoring in a nonhuman primate study of acute ischemic stroke. American Journal of Neuroradiology 2017;38(4):712–720.
9. Thrippleton, M. J., Parikh, J., Harris, B. A., Hammer, S. J., Semple, S. I., Andrews, P. J., Wardlaw, J. M., & Marshall, I. Reliability of MRSI brain temperature mapping at 1.5 and 3 T. NMR in Biomedicine. 2013;27(2):183–190.
10. Sharma, A. A., Nenert, R., Mueller, C., Maudsley, A. A., Younger, J. W., & Szaflarski, J. P. Repeatability and reproducibility of in-vivo brain temperature measurements. Frontiers in Human Neuroscience. 2020;14(1):573.
11. Sela, Y., Hoekstra, M. M. B., & Franken, P. Sub-minute prediction of brain temperature based on sleep–wake state in the mouse. ELife. 2021;10(1):e62073.
12. Csernai, M., Borbély, S., Kocsis, K., Burka, D., Fekete, Z., Balogh, V., Káli, S., Emri, Z., & Barthó, P. Dynamics of sleep oscillations is coupled to brain temperature on multiple scales. The Journal of Physiology. 2019;597(15):4069–4086.
Figures