2169
In vivo simultaneous proton resonance frequency shift thermometry and single reference variable flip angle T1 measurement1University of Utah, Salt Lake City, UT, United States
Synopsis
Simultaneous proton resonance frequency shift thermometry and T1 measurements were obtained in an in vivo rabbit model using the single reference variable flip angle method. Focused ultrasound was used to heat tissue volumes of muscle and volumes at the fat/muscle interface. Temporal resolution for PRF shift temperatures and T1 changes was 1.71 s. Peak heated muscle voxels showed an increase in T1 of 1.6%/°C. T1 increases were observed in fat at or near the ultrasound focus.
Purpose
The purpose of this study was to demonstrate simultaneous proton resonance frequency thermometry and T1 measurement changes during magnetic resonance guided focused ultrasound sonications in an in vivo rabbit model.Introduction
MR-guided focused ultrasound surgery (MRgFUS) is a noninvasive treatment used in numerous clinical applications1,2. Magnetic resonance temperature imaging using the proton resonance frequency (PRF) shift method is often utilized to monitor thermal affects in real time with clinically relevant spatial and temporal resolution3,4. However, the PRF shift method relies on temperature-dependent changes to the PRF of hydrogen atoms and cannot accurately monitor temperature changes in non-aqueous tissues5, such as fat.The MR relaxation time constant T1 has also been shown to change linearly in fat over the range 10° to 70°C6 with a temperature dependence on the order of 1-3%/°C7. Previous efforts to develop simultaneous PRF/T1 measurements involve a 2D8 or 3D9 spoiled gradient echo sequence with two alternating flip angles. Temperature change using the PRF shift method is calculated at each time point with the image phase, and T1 for alternating time points is calculated using the variable flip angle (VFA) approach with sequential images10. A more efficient single reference VFA (SR-VFA) method with a multi-echo stack of stars (SOS) approach11 was developed and evaluated during MRgFUS ablations in phantoms and cadaver breasts, and in healthy volunteers under no heating conditions.
This work extends the SR-VFA-SOS approach, evaluating this hybrid PRF/T1 sequence in an in vivo rabbit model, demonstrating the ability to simultaneously measure 3D PRF and T1 changes with spatial and temporal resolution on the order of 1 mm and 2 seconds, respectively.
Methods
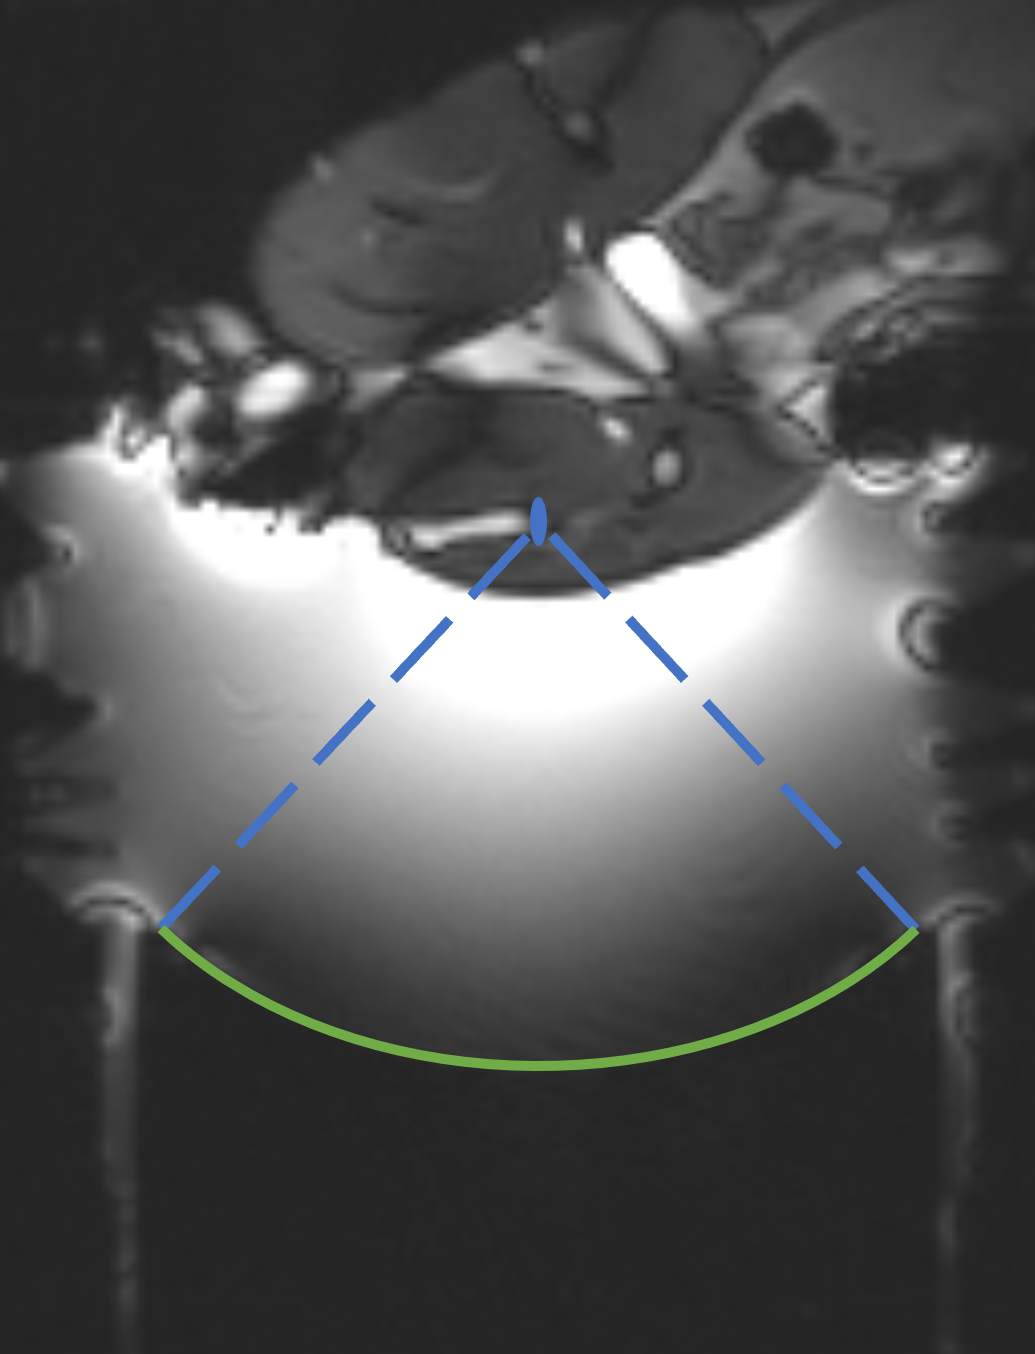
Experiments were performed in a 3T MRI scanner (PrismaFIT, Siemens) using a 256 element MRI‐compatible phased‐array transducer (10 cm radius of curvature, f=1 MHz, IGT). New Zealand white rabbits (N=2) were positioned lateral decubitus with the transducer focus approximately centered in the hamstring (Figure 1). The ultrasound beam was electronically steered during sonications (30s, 16-38W acoustic power) to distinct locations, ablating both muscle only (N=2) and the fat/muscle interface (N=3) volumes.The SR-VFA-SOS method was performed with a multi-echo stack of stars sequence with pseudo-Golden Angle (pGA) view angle increment (TR = 11 ms, TE = 2.46… 9.06 ms, echoes=6, total projections = 377, pGA = 360x233/377, voxel size = 1.5 x 1.5 x 2 mm, 1000 Hz/pixel bandwidth, FA = 5/15° for reference/dynamic images). Reconstruction was performed with a k-space weighted image contrast (KWIC) method, using 13 central projections. Temporal resolution for the T1 and PRF shift temperature data was 1.71 s.
Results
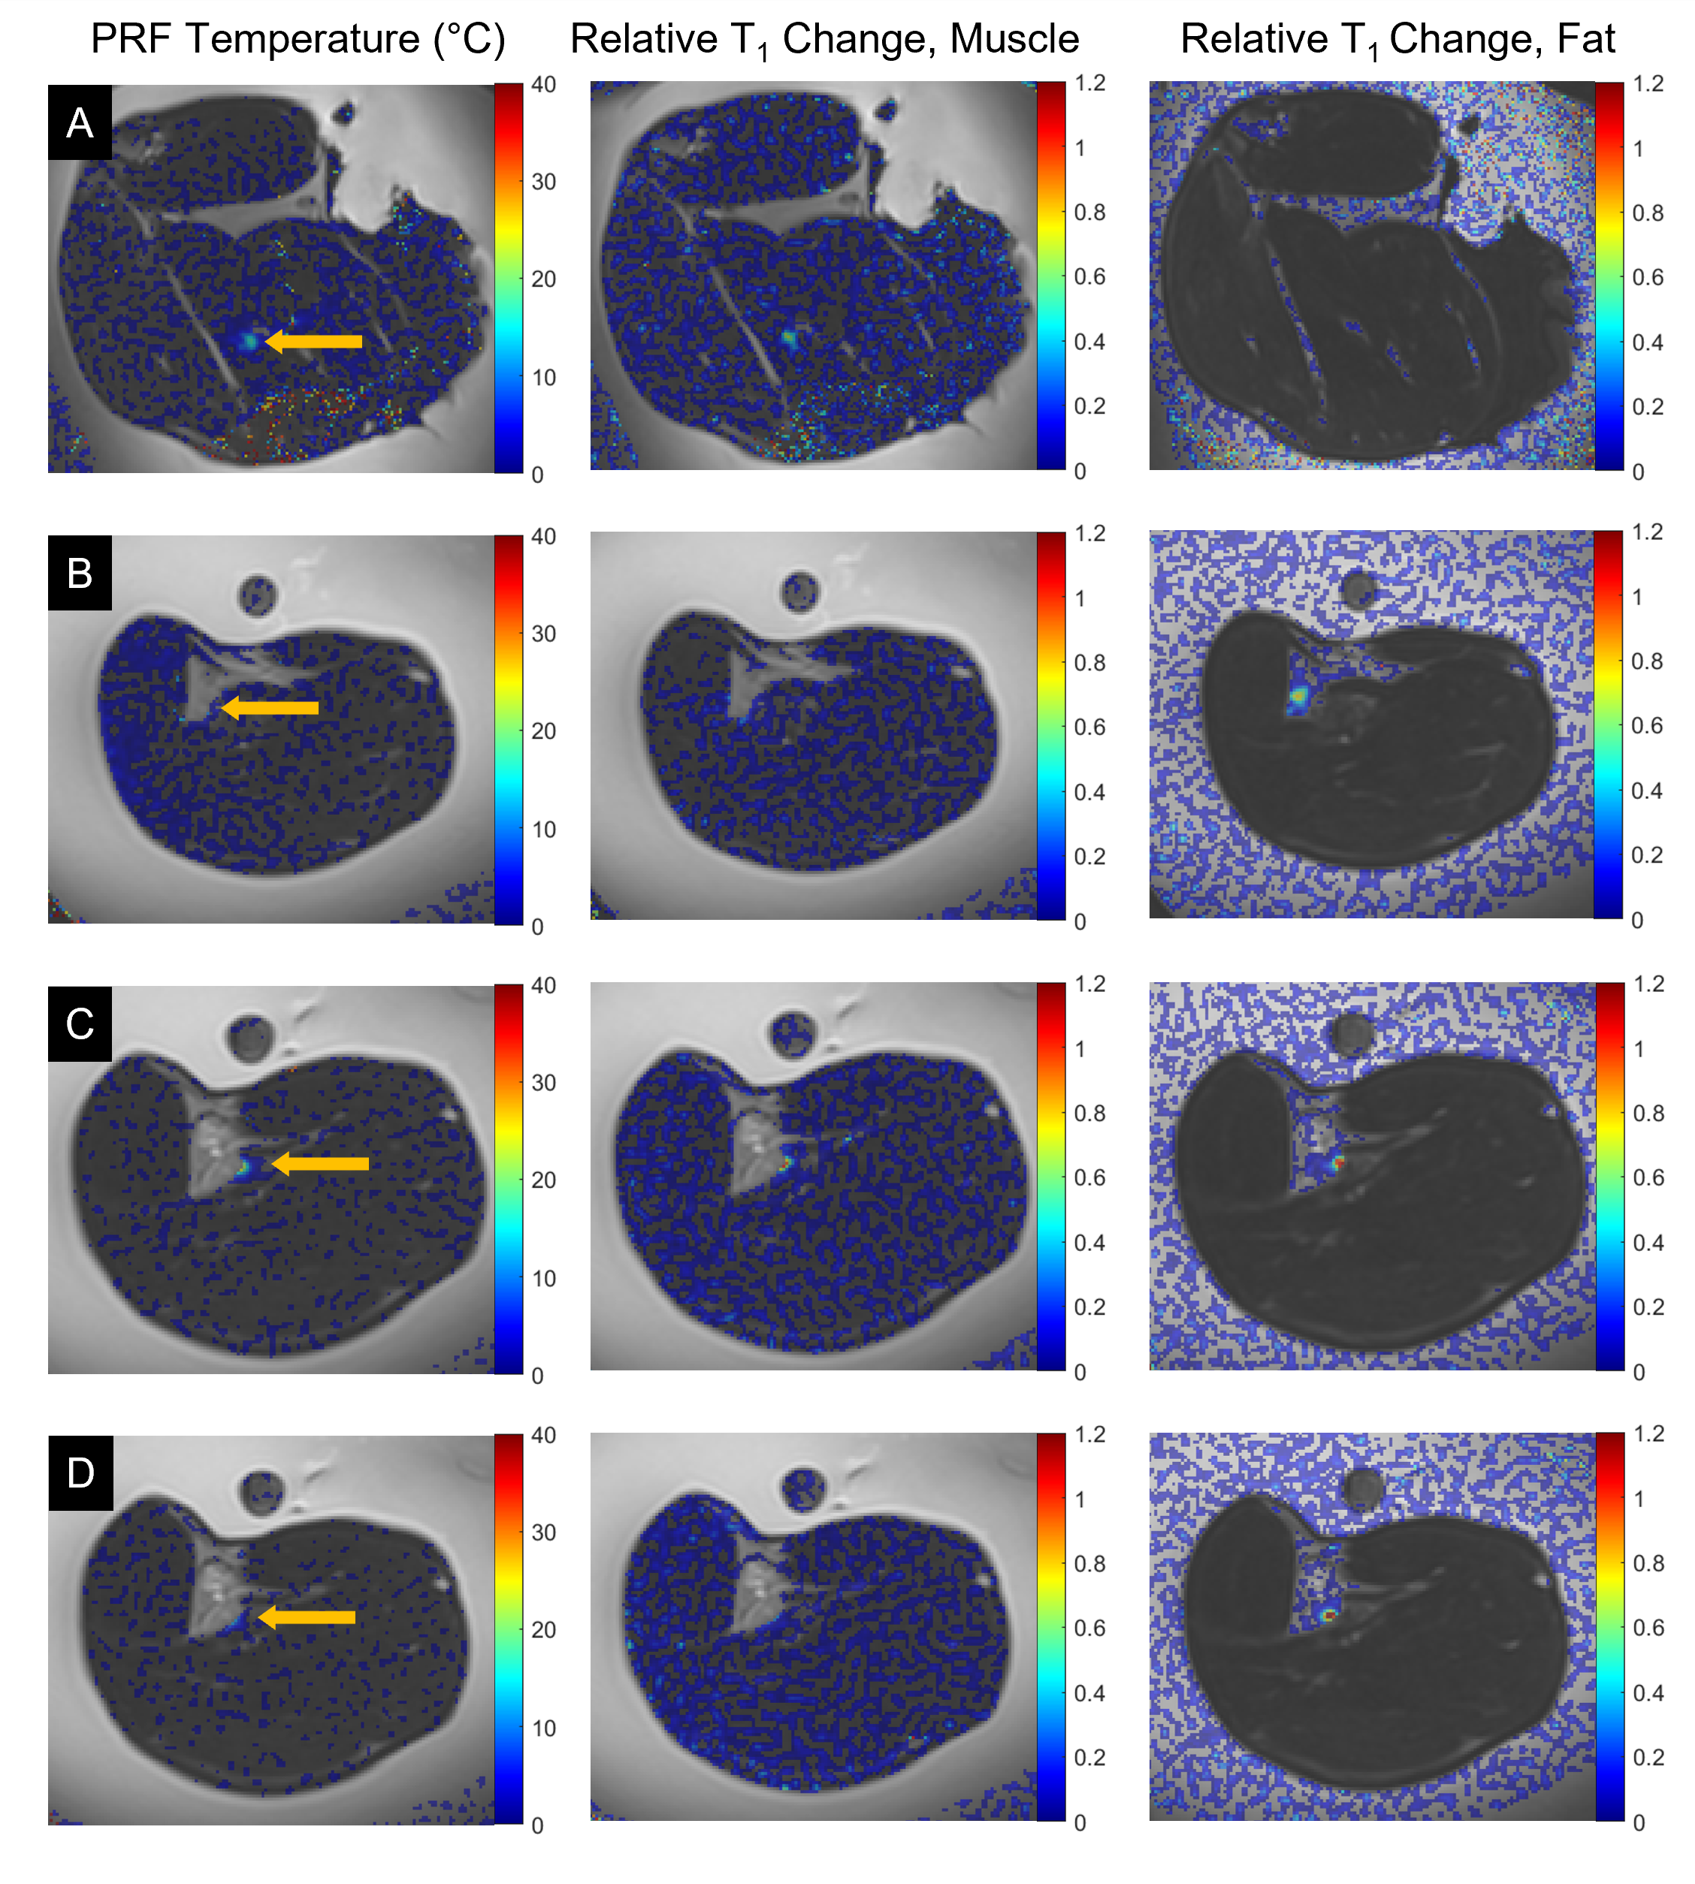
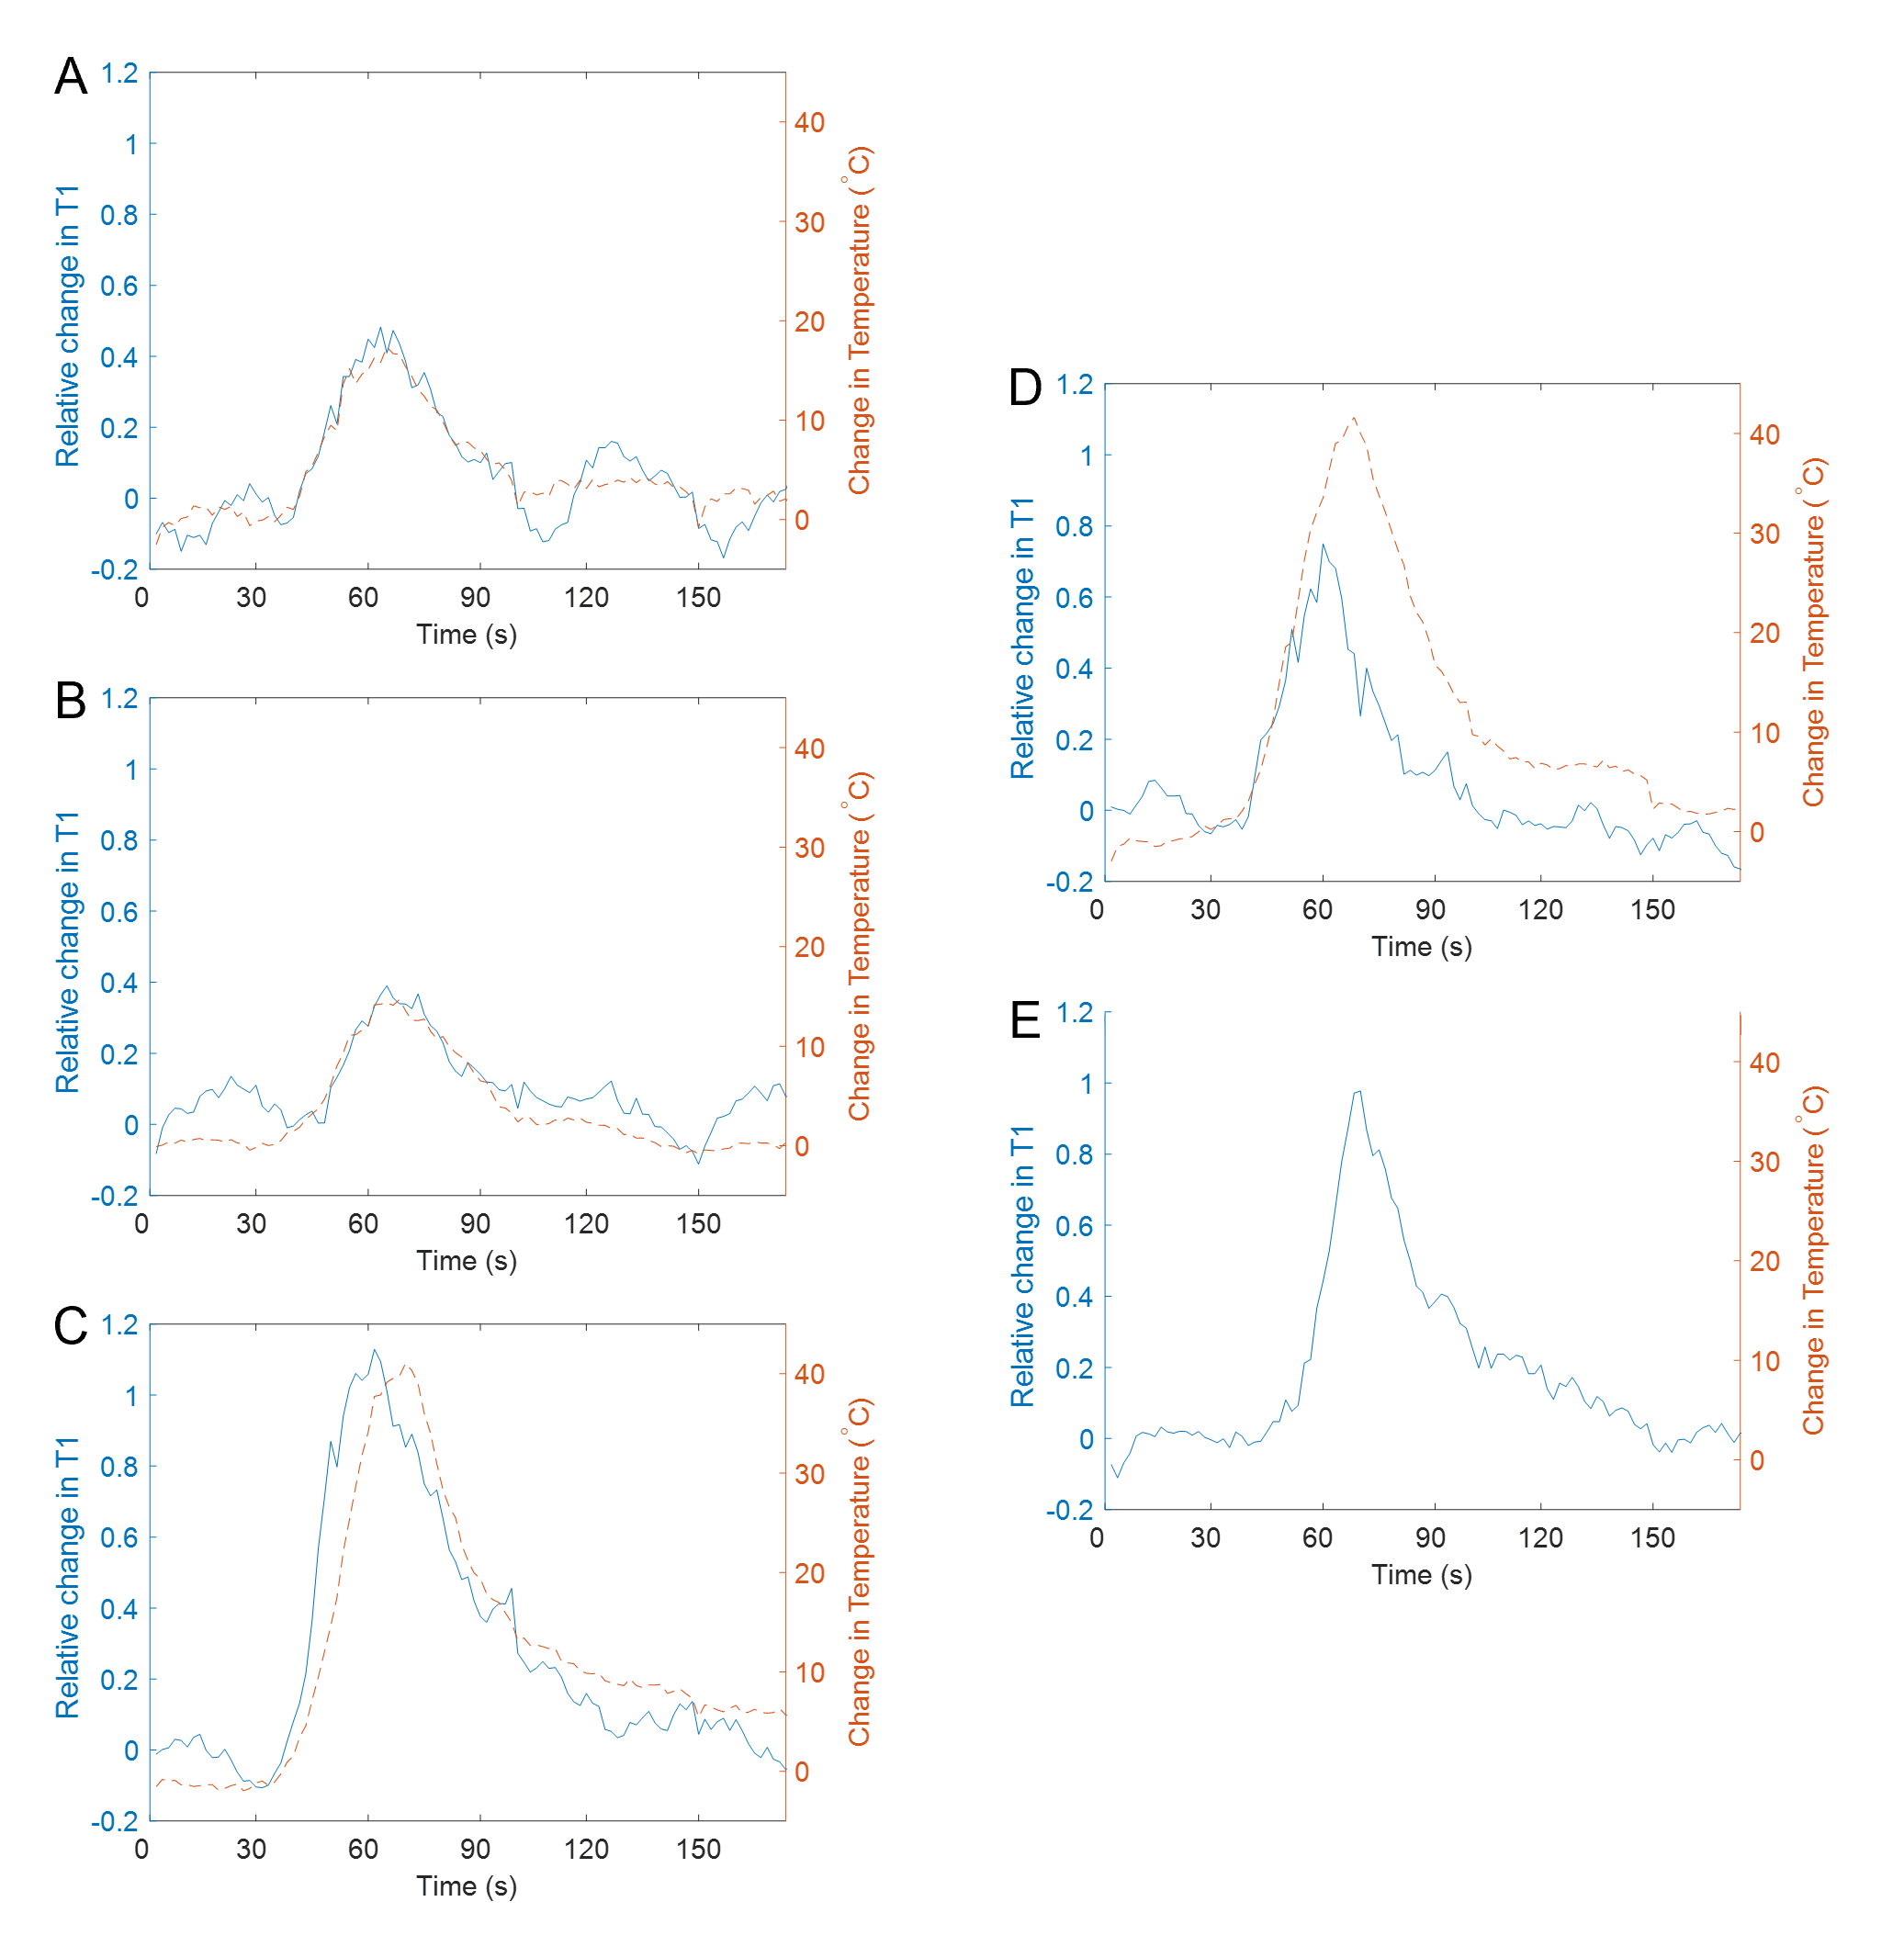
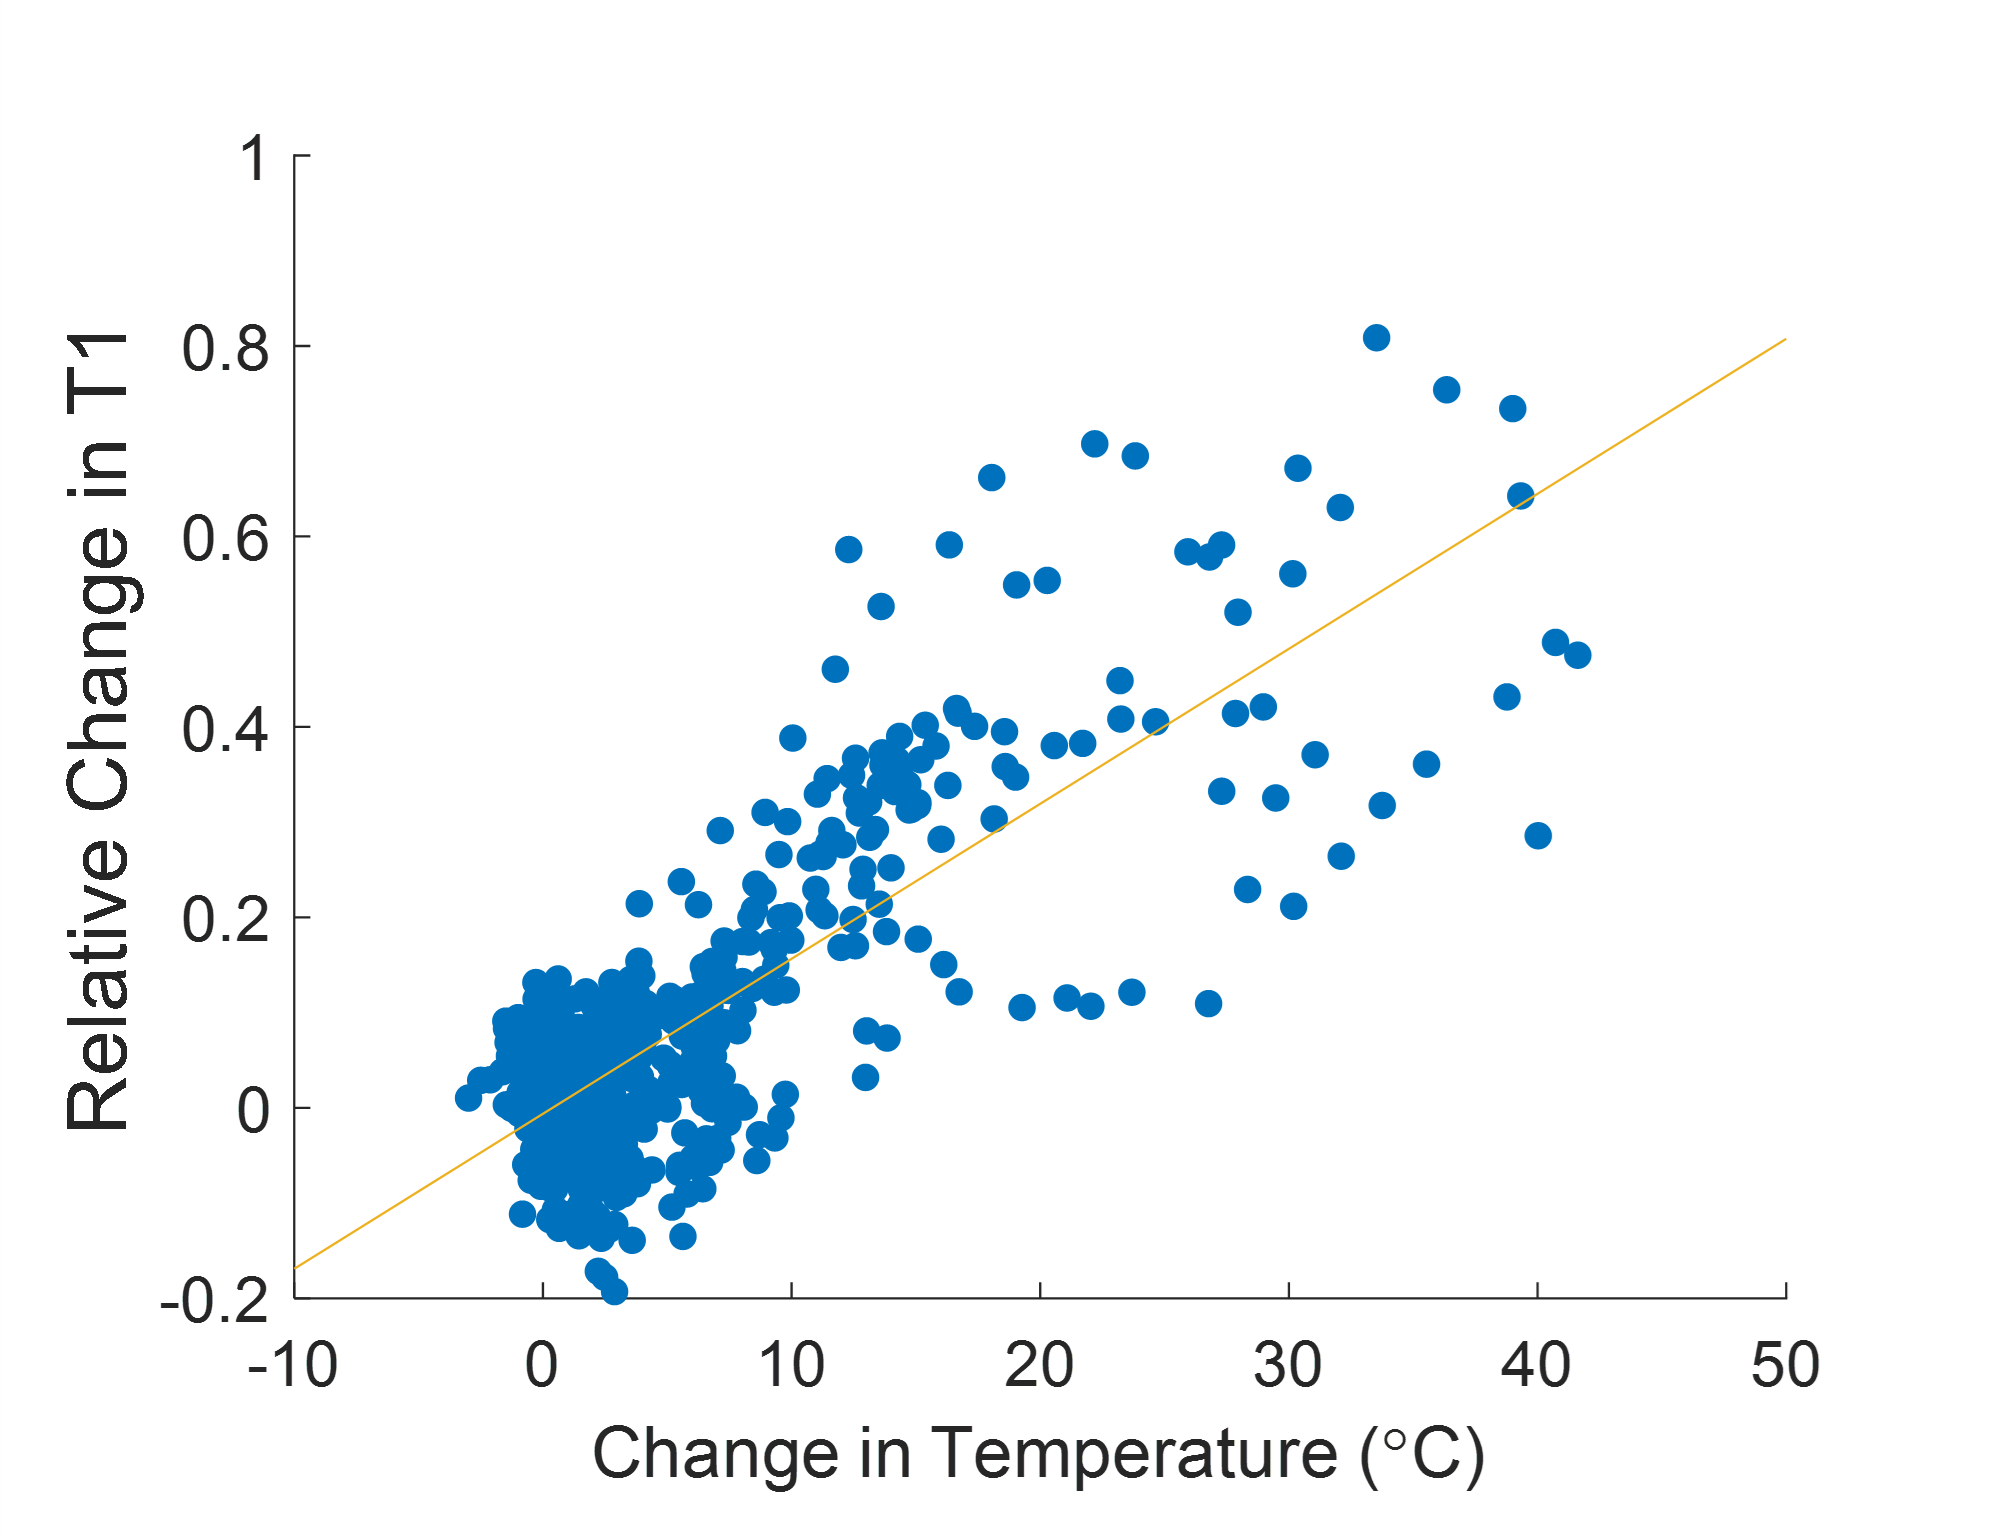
Simultaneous PRF and T1 temperature changes at or near the focal spot were successfully calculated for all sonications in muscle. Peak temperature rises from 14.7 to 41.6°C and peak changes of T1 from 39 to 113% were observed. Relative changes in T1 for sonications with the focal spot located in fat reached up to 138%. Figure 2 shows temperature maps calculated using the PRF shift method for muscle tissues and T1 changes relative to the reference image for both muscle and fatty tissues. The temperature and relative T1 changes for representative individual sonications over time are plotted in Figure 3. Figure 4 shows the relative change in T1 versus PRF shift calculated temperature rise for voxels located in muscle during sonications targeting the interface of fat and muscle.Discussion
This work demonstrates the feasibility of using the SR-VFA-SOS method for simultaneous T1 and PRF shift measurement in vivo. Temperature changes calculated from the PRF shift method were observed in aqueous tissue only and relative T1 changes were observed in the ultrasound focal region at the muscle/fat interface in both tissue types. T1 changes in the ultrasound focal region of the fat/muscle interface showed contiguous areas of increased T1 in the fat and muscle. Spatial resolution of 1.5 x 1.5 x 2 mm allowed for sufficient determination of the size and position of localized heating and T1 changes.In muscle, the temperature and T1 changes relative to the reference image over time showed good agreement during both heating and cooling for all sonications.
The linear fit of the relative T1 changes versus temperature rise for maximum heated voxels in muscle shows a 1.6% increase of T1/°C of temperature rise, similar to 1.4%/°C found in bovine muscle12. While this work did not calibrate the T1-temperature relationship in fat, a linear T1-temperature relationship of 1.4% per degree was calculated by Todd et al.8 for breast fat.
In vivo temporal resolution of 1.71 s provides a rapid temporal resolution for monitoring during treatment. Future expansion on this work includes developing and determining the variability of T1-temperature calibration curves for additional tissue types and implementing the reconstruction algorithm in a real-time framework.
Conclusion
This work has provided an in vivo evaluation of the SR-VFA-SOS method of simultaneous PRF shift thermometry and T1 measurement. The SR-VFA-SOS method had the capability to measure temperature in aqueous tissue and relative T1 changes in nonaqueous tissue, which, when combined with a T1-temperature calibration curve, allows for the monitoring of temperature over entire mixed tissue type volumes, such as when using MRgFUS at treatment sites with fat and aqueous tissues in the treatment region.Acknowledgements
NIH R37CA224141 and S10OD018482.References
1. Izadifar Z, Izadifar Z, Chapman D, Babyn P. An Introduction to High Intensity Focused Ultrasound: Systematic Review on Principles, Devices, and Clinical Applications. J Clin Med. 2020;9(2):460.
2. Tempany CM, McDannold NJ, Hynynen K, Jolesz FA. Focused ultrasound surgery in oncology: overview and principles. Radiology. 2011 Apr;259(1):39-56.
3. Hokland SL, Pedersen M, Salomir R, Quesson B, Stodkilde-Jorgensen H, Moonen CTW. MRI-guided focused ultrasound: methodology and applications. IEEE Trans Med Imaging. 2006;25:723–731.
4. , , , et al. AAPM Task Group 241: A medical physicist’s guide to MRI-guided focused ultrasound body systems. Med Phys. 2021; 48: e772– e806.
5. Rieke V, Butts Pauly K. MR thermometry. J Magn Reson Imaging. 2008;27(2):376-390. doi:10.1002/jmri.21265
6. Kuroda K, Iwabuchi T, Obara M, Honda M, Saito K, Imai Y. Temperature dependence of relaxation times in proton components of fatty acids. Magn Reson Med. 2011;10:177–183.
7. Odéen, H., & Parker, D.L. Magnetic resonance thermometry and its biological applications - Physical principles and practical considerations. Progress in nuclear magnetic resonance spectroscopy. 2019; 110:34-61.
8. Todd N, Diakite M, Payne A, Parker DL. Hybrid proton resonance frequency/T1 technique for simultaneous temperature monitoring in adipose and aqueous tissues. Magn Reson Med. 2013;69:62–70.
9. Diakite M, Odeen H, Todd N, Payne A, Parker DL. Toward realtime temperature monitoring in fat and aqueous tissue during magnetic resonance‐guided high‐intensity focused ultrasound using a three‐dimensional proton resonance frequency T1 method. Magn Reson Med. 2014;72:178–187
10. Todd N, Diakite M, Payne A, Parker DL. In vivo evaluation of multi‐echo hybrid PRF/T1 approach for temperature monitoring during breast MR‐guided focused ultrasound surgery treatments. Magn Reson Med. 2014;72:793–799.
11. Svedin BT, Payne A, Parker DL. Simultaneous proton resonance frequency shift thermometry and T1 measurements using a single reference variable flip angle T1 method. Magn Reson Med. 2019;81(5):3138-3152.
12. Cline HE, Hynynen K, Hardy CJ, Watkins RD, Schenck JF, Jolesz FA. MR temperature mapping of focused ultrasound surgery. Magn Reson Med. 1994;31:628–636.
Figures