2167
Real-time automatic temperature regulation during MRI-guided Laser Interstitial Thermal Therapy (MR-LITT)1UMR5536 CRMSB, Université de Bordeaux, Bordeaux, France, 2Certis Therapeutics, Pessac, France, 3IHU Liryc, Electrophysiology and Heart Modeling Institute, Hopital Xavier Arnozan, Pessac, France, 4Centre de Recherche Cardio-Thoracique de Bordeaux, U1045, University of Bordeaux, Bordeaux, France, 5INSERM, Centre de Recherche Cardio-Thoracique de Bordeaux, U1045, Bordeaux, France, 6ALPhANOV, Talence, France
Synopsis
We present here a method to automatically regulate heat deposition during Laser Interstitial Thermal Therapy to precisely control temperature evolution during the procedure. The method relies on real-time rapid volumetric thermometry using the Proton Resonance Frequency Shift technique and a regulation algorithm that adjusts every second the emitted power by the laser to force temperature to follow a predefined temperature-time profile.
Introduction
MR-guided LITT is clinically used to treat a variety of brain diseases, such as glioblastoma and epilepsy [1], [2]. Treatment duration can be of several minutes, depending on the targeted ablation size and laser configuration. Excessive temperature increase may result in alteration of healthy structures and/or lead to incomplete treatment (modification of light penetration in tissue due to charring near the laser probe) and produce thermometry artifacts [3]. We propose to combine real-time 3D thermometry with an automatic regulation algorithm to adjust dynamically the delivered laser power to force temperature to follow a predefined profile.Material & Methods
Real-time MRI thermometry pipeline: Multi-slice single-shot echo planar images [4] were acquired in coronal orientation every second (6 slices/s, 800 repetitions) on a 1.5 T clinical scanner (Avanto, Siemens Healthineers) with the following parameters: TE=18 ms, FOV=180x180 mm², 3 mm thickness (1.4x1.4x3 mm3 voxel), FA = 60°, GRAPPA acceleration=2, bandwidth/pixel=1446 Hz. The flex and two spines coils surrounded the sample, with 12 channels used during real-time image reconstruction. Raw data were streamed to the reconstruction and thermometry pipeline [5] and temperature images were displayed in real-time on our MR-guided interventional application (Certis Solution, Certis Therapeutics, France). A real-time temporal Kalman filter (with parameters σ²measurement=5 and σ²process=1 estimated using a combination of temporal evolution of temperature in several pixels of the heated area over several slices and assuming an autoregressive 4th order process) was applied to denoise each temporal temperature pixel profile from all slices.LITT device: A 400 µm optic fiber ended with a glass diffuser tip of 1 cm was inserted into the test gel (3% gelatin) and connected to a laser diode source (976 nm wavelength, maximum output power of 27 W), located outside the Faraday cage. The laser unit (ALPhANOV, Talence, France) was interfaced with the Gadgetron to dynamically control and update its output power by software means.
Regulation algorithm: A dedicated processing was implemented in the thermometry pipeline to compute and update the laser power on-the-fly. The controller is a proportional-integral-derivative (PID) algorithm incorporating the Bio-Heat Transfer Equation, as previously proposed [6]–[8]. Input parameters are 1- a temperature-time profile, 2- absorption (α) and diffusion (D) coefficients of the targeted medium and 3- a parameter related to the response time of the PID controller. A 3x3x3 rectangular ROI was centered on the hottest pixel defined from the test shot (see below) to control the energy deposition.
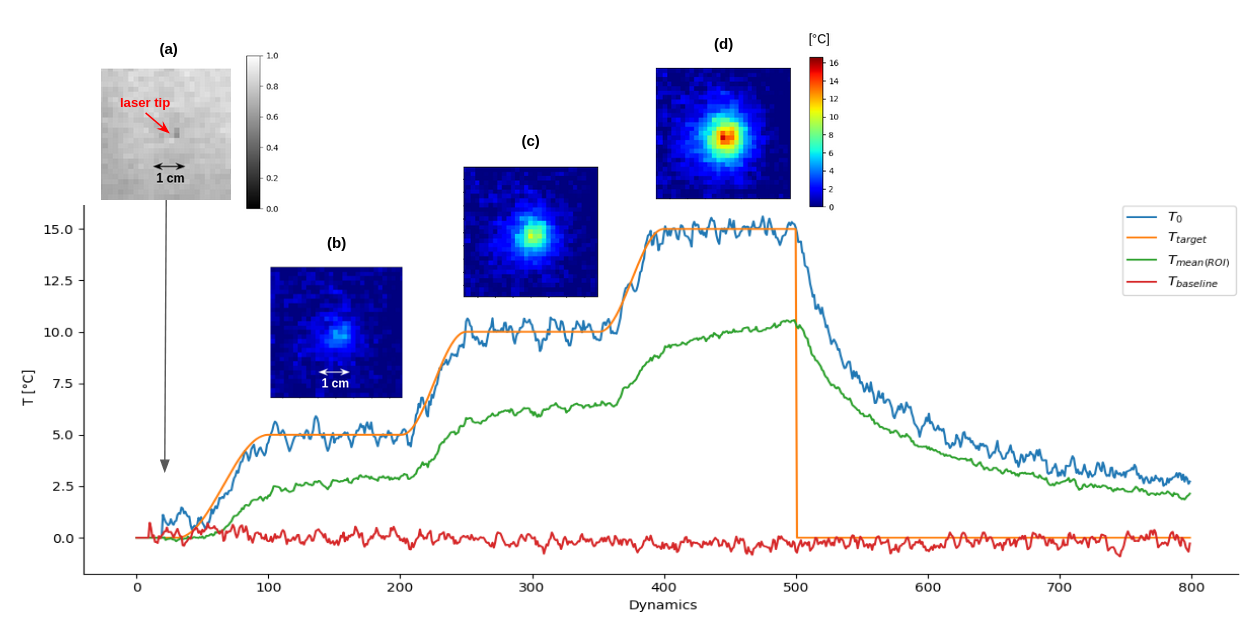
Initial low power test shot: To calibrate the thermal load deposition and the threated area, a CW laser emission (3W output power) was applied during 20 seconds to detect the heated region on temperature images by finding the hottest point averaged over the temporal dimension. The temperature evolution at the hottest point was fit with the following equation [5] to estimate α [°C/s/W]:
$$T(t) = \left\{\begin{array}{lll}0&\mbox{if } t ≤ t_0\\
αPτ\ln[\frac{t-t_0+τ}{τ}]&\mbox{if } t_0 < t ≤ t_1&\qquad &\text{(Eq.1)}\\
αPτ\ln[\frac{t-t_0+τ}{t-t_1+τ}&\mbox{if } t < t_1 \end{array} \right. $$
where t0 and t1 are the start and end times of laser emission, P [W] the laser power and τ [s] the characteristic diffusion time of the system. At each time point after the end of the laser emission (cooling phase), the temperature maps crossing the previously selected pixel was fitted with a 2D Gaussian function to retrieve the full width at half maximum of the temperature distribution. These values were plotted as a function of time and the resulting curve fitted to a linear function whose slope is equal to 2D [9].
Automatic regulation: The MR-thermometry sequence was run during 800 s and the regulation algorithm automatically adjusted the laser output power for approximately 13 minutes, with online display of temperature images, predefined profile and measured temperature curves at the focal point.
Results
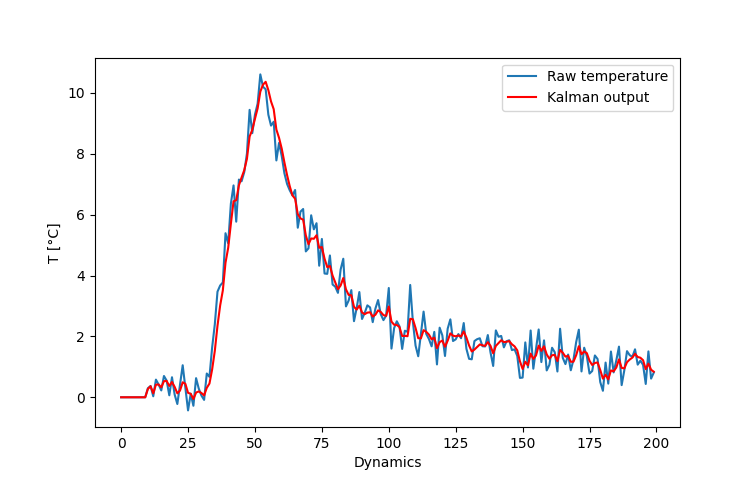
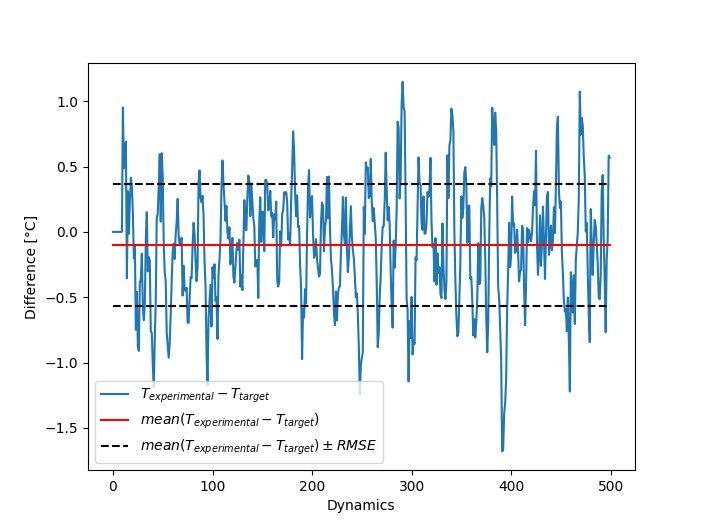
Figure 1 shows the maximal temperature measured during the initial low power test shot, without and with Kalman filtering. Temporal mean ± standard deviation of temperature measured over the 20 first acquisitions in the time series was 0.29±0.39°C, and 0.28±0.17°C without and with Kalman filtering, respectively. Please note that no significant time delay was introduced by this filter during heating. Figure 2a shows the filtered temperature curved of Figure 1 with the resulting fit (solid red lines) to equation 1 to derive α (0.36 °C/s/W). Figure 2b shows the result of the full width at half maximum versus time during the cooling period, together with the linear fit to determine D (0.2 mm²/s). Figure 3 shows an example of the automatic temperature regulation for a predefined heating profile with 3 steps of 5°C, 10°C and 15°C, and its corresponding temperature maps (b, c d, respectively). Figure 4 displays the difference between measured and target temperature curves over the laser emission duration. The mean difference is -0.1°C with confidence interval (RMSE) of 0.47°C, showing the excellent stability of the proposed technique over long duration (>10 minutes) heating.Conclusion & Discussion
The proposed regulation algorithm provides precise control of tissue temperature with a mean error between target and experimental temperature below 0.5°C. The Kalman filtering allows reducing temperature noise without adding delay that may compromise the stability of the regulation algorithm. This method offers a stable approach, even for ablation time longer than 10 minutes.Acknowledgements
No acknowledgement found.References
[1] R. Diaz et al., « Laser Interstitial Thermal Therapy: Lighting the Way to a New Treatment Option in Neurosurgery », p. 5, 2016.
[2] I. Karampelas et A. E. Sloan, « Laser-Induced Interstitial Thermotherapy of Gliomas », in Progress in Neurological Surgery, vol. 32, M. F. Chernov, Y. Muragaki, S. Kesari, et I. E. McCutcheon, Éd. S. Karger AG, 2018, p. 14‑26.
[3] S. M. Munier, A. S. Liang, A. N. Desai, J. K. James, et S. F. Danish, « Characterization of Magnetic Resonance Thermal Imaging Signal Artifact During Magnetic Resonance Guided Laser-Induced Thermal Therapy », Oper. Neurosurg., vol. 19, no 5, p. 619‑624, October 2020
[4] P. Bour, V. Ozenne, F. Marquet, B. Denis De Senneville, E. Dumont, et B. Quesson, « Evaluation of 2D simultaneous multi-slice EPI at 1.5T for MR-thermometry in presence of motion », Paris, France, June 2018.
[5] M. S. Hansen et T. S. Sørensen, « Gadgetron: An open source framework for medical image reconstruction: Gadgetron », Magn. Reson. Med., vol. 69, no 6, p. 1768‑1776, June 2013
[6] B. Quesson, F. Vimeux, R. Salomir, J. A. de Zwart, et C. T. W. Moonen, « Automatic control of hyperthermic therapy based on real-time Fourier analysis of MR temperature maps », Magn. Reson. Med., vol. 47, no 6, p. 1065‑1072, June 2002
[7] C. Mougenot et al., « Three-dimensional spatial and temporal temperature control with MR thermometry-guided focused ultrasound (MRgHIFU): 3D Spatial Temperature Control With MRgHIFU », Magn. Reson. Med., vol. 61, no 3, p. 603‑614, March 2009
[8] R. Salomir, F. C. Vimeux, J. A. de Zwart, N. Grenier, et C. T. W. Moonen, « Hyperthermia by MR‐guided focused ultrasound: Accurate temperature control based on fast MRI and a physical model of local energy deposition and heat conduction », p. 6, 2000.
[9] I. Dragonu et al., « Non-invasive determination of tissue thermal parameters from high intensity focused ultrasound treatment monitored by volumetric MRI thermometry », NMR Biomed., vol. 22, no 8, p. 843‑851, 2009
Figures