2166
Improving the Accuracy of Fat Fraction Values from a 2-Point Dixon Acquisition1Radiology, UT Southwestern Medical Center, Dallas, TX, United States, 2Advanced Imaging Research Center, UT Southwestern Medical Center, Dallas, TX, United States
Synopsis
Fat fraction (FF) mapping using whole-body MRI is clinically valuable for the assessment of treatment response in diseases such as multiple myeloma. MRI FF maps can be accurately measured using multi-point acquisitions such as mDixon-Quant, however, they are not feasible for whole-body acquisitions. We have previously developed a “dark-fat” masking algorithm that can account for residual fat signal in water-only images from 2-point Dixon fat/water separation, that are readily feasible with whole-body MRI. In this study, we demonstrate the utility of this algorithm across a range of proton-density FF using a multi-compartment commercial FF phantom.
Introduction
Quantitative measurement of fat fraction (FF) is a valuable imaging biomarker for the assessment of treatment response in diseases such as multiple myeloma (MM)1. Proton-density FF (PDFF) can be calculated using chemical-shift based fat/water separation methods (i.e., Dixon method), which measures the proton signal from water-only and fat-only images. PDFF can be accurately measured using multi-echo Dixon methods (e.g., mDixon-Quant), which use multiple echoes to account for multi-peak fat spectra and T2* decay.While multi-point mDixon-Quant provides higher FF accuracy, 2-point Dixon acquisitions are more feasible for time consuming whole-body MRI protocols, which are recommended for evaluation of multiple myeloma (MM). However, FF values from 2-point Dixon acquisitions are underestimated. In this work, we evaluated a “dark-fat” masking algorithm2 to improve quantitative performance of 2-point Dixon FF estimation at a range of verified FF values.
Theory
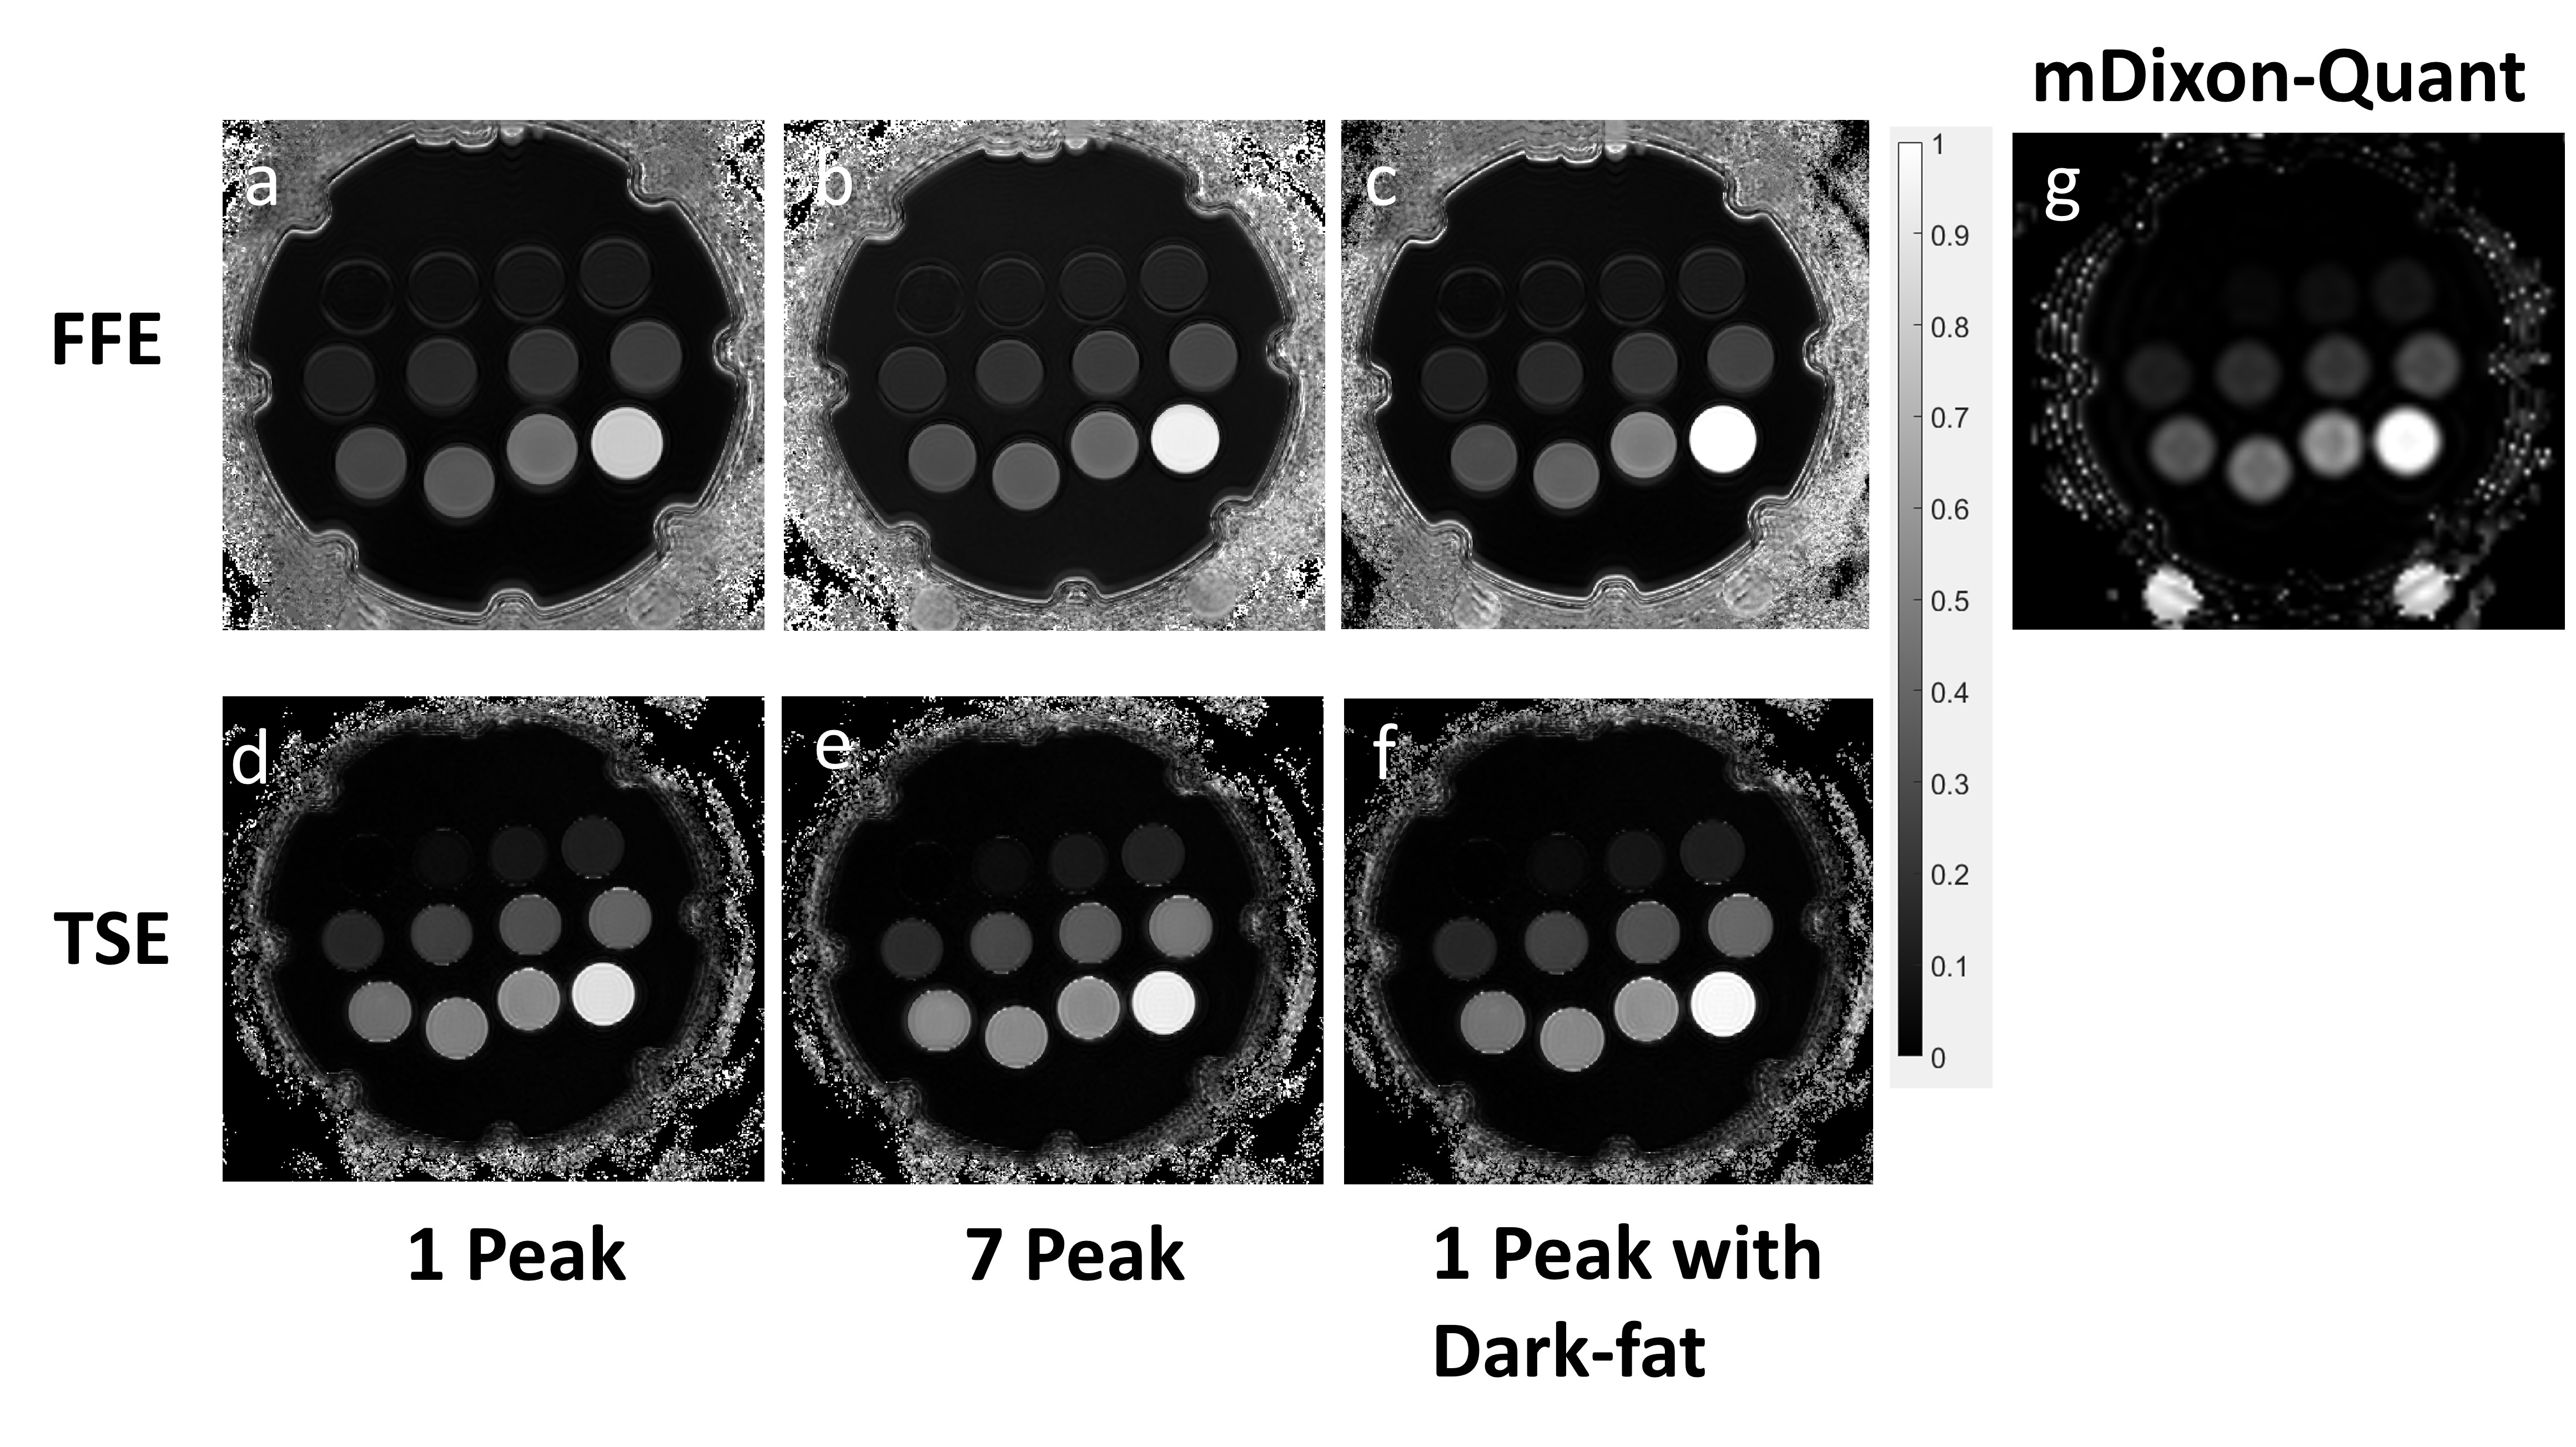
Although 2-echo Dixon acquisitions are preferred for whole-body MRI, they do not provide enough data for measuring the multiple fat spectrum peaks needed for accurate FF quantification. In 3T 2-point Dixon acquisitions, the out-of-phase (OP) and in-phase (IP) images are acquired 1.1 ms apart, which only accounts for the phase of the largest fat spectrum species (1.3 ppm). This leads to the other fat spectrum species contributing fat signal to the water-only image, creating a “grey-fat” appearance (Fig. 2a,d). A priori estimates of the other fat spectrum species (e.g., 7-peak models) can improve 2-point FF calculations, but measurement of 3 or more echoes is needed for improved fat/water separation accuracy.We previously developed a “dark-fat” algorithm which estimates the “grey-fat” signals in the water-only images from chemical-shift fat/water separated images2,3. The residual grey-fat is then subtracted from the water-only images to produce “dark-fat” water-only images, thereby accounting for fat signal infiltration by off-resonance fat spectrum species.
Methods
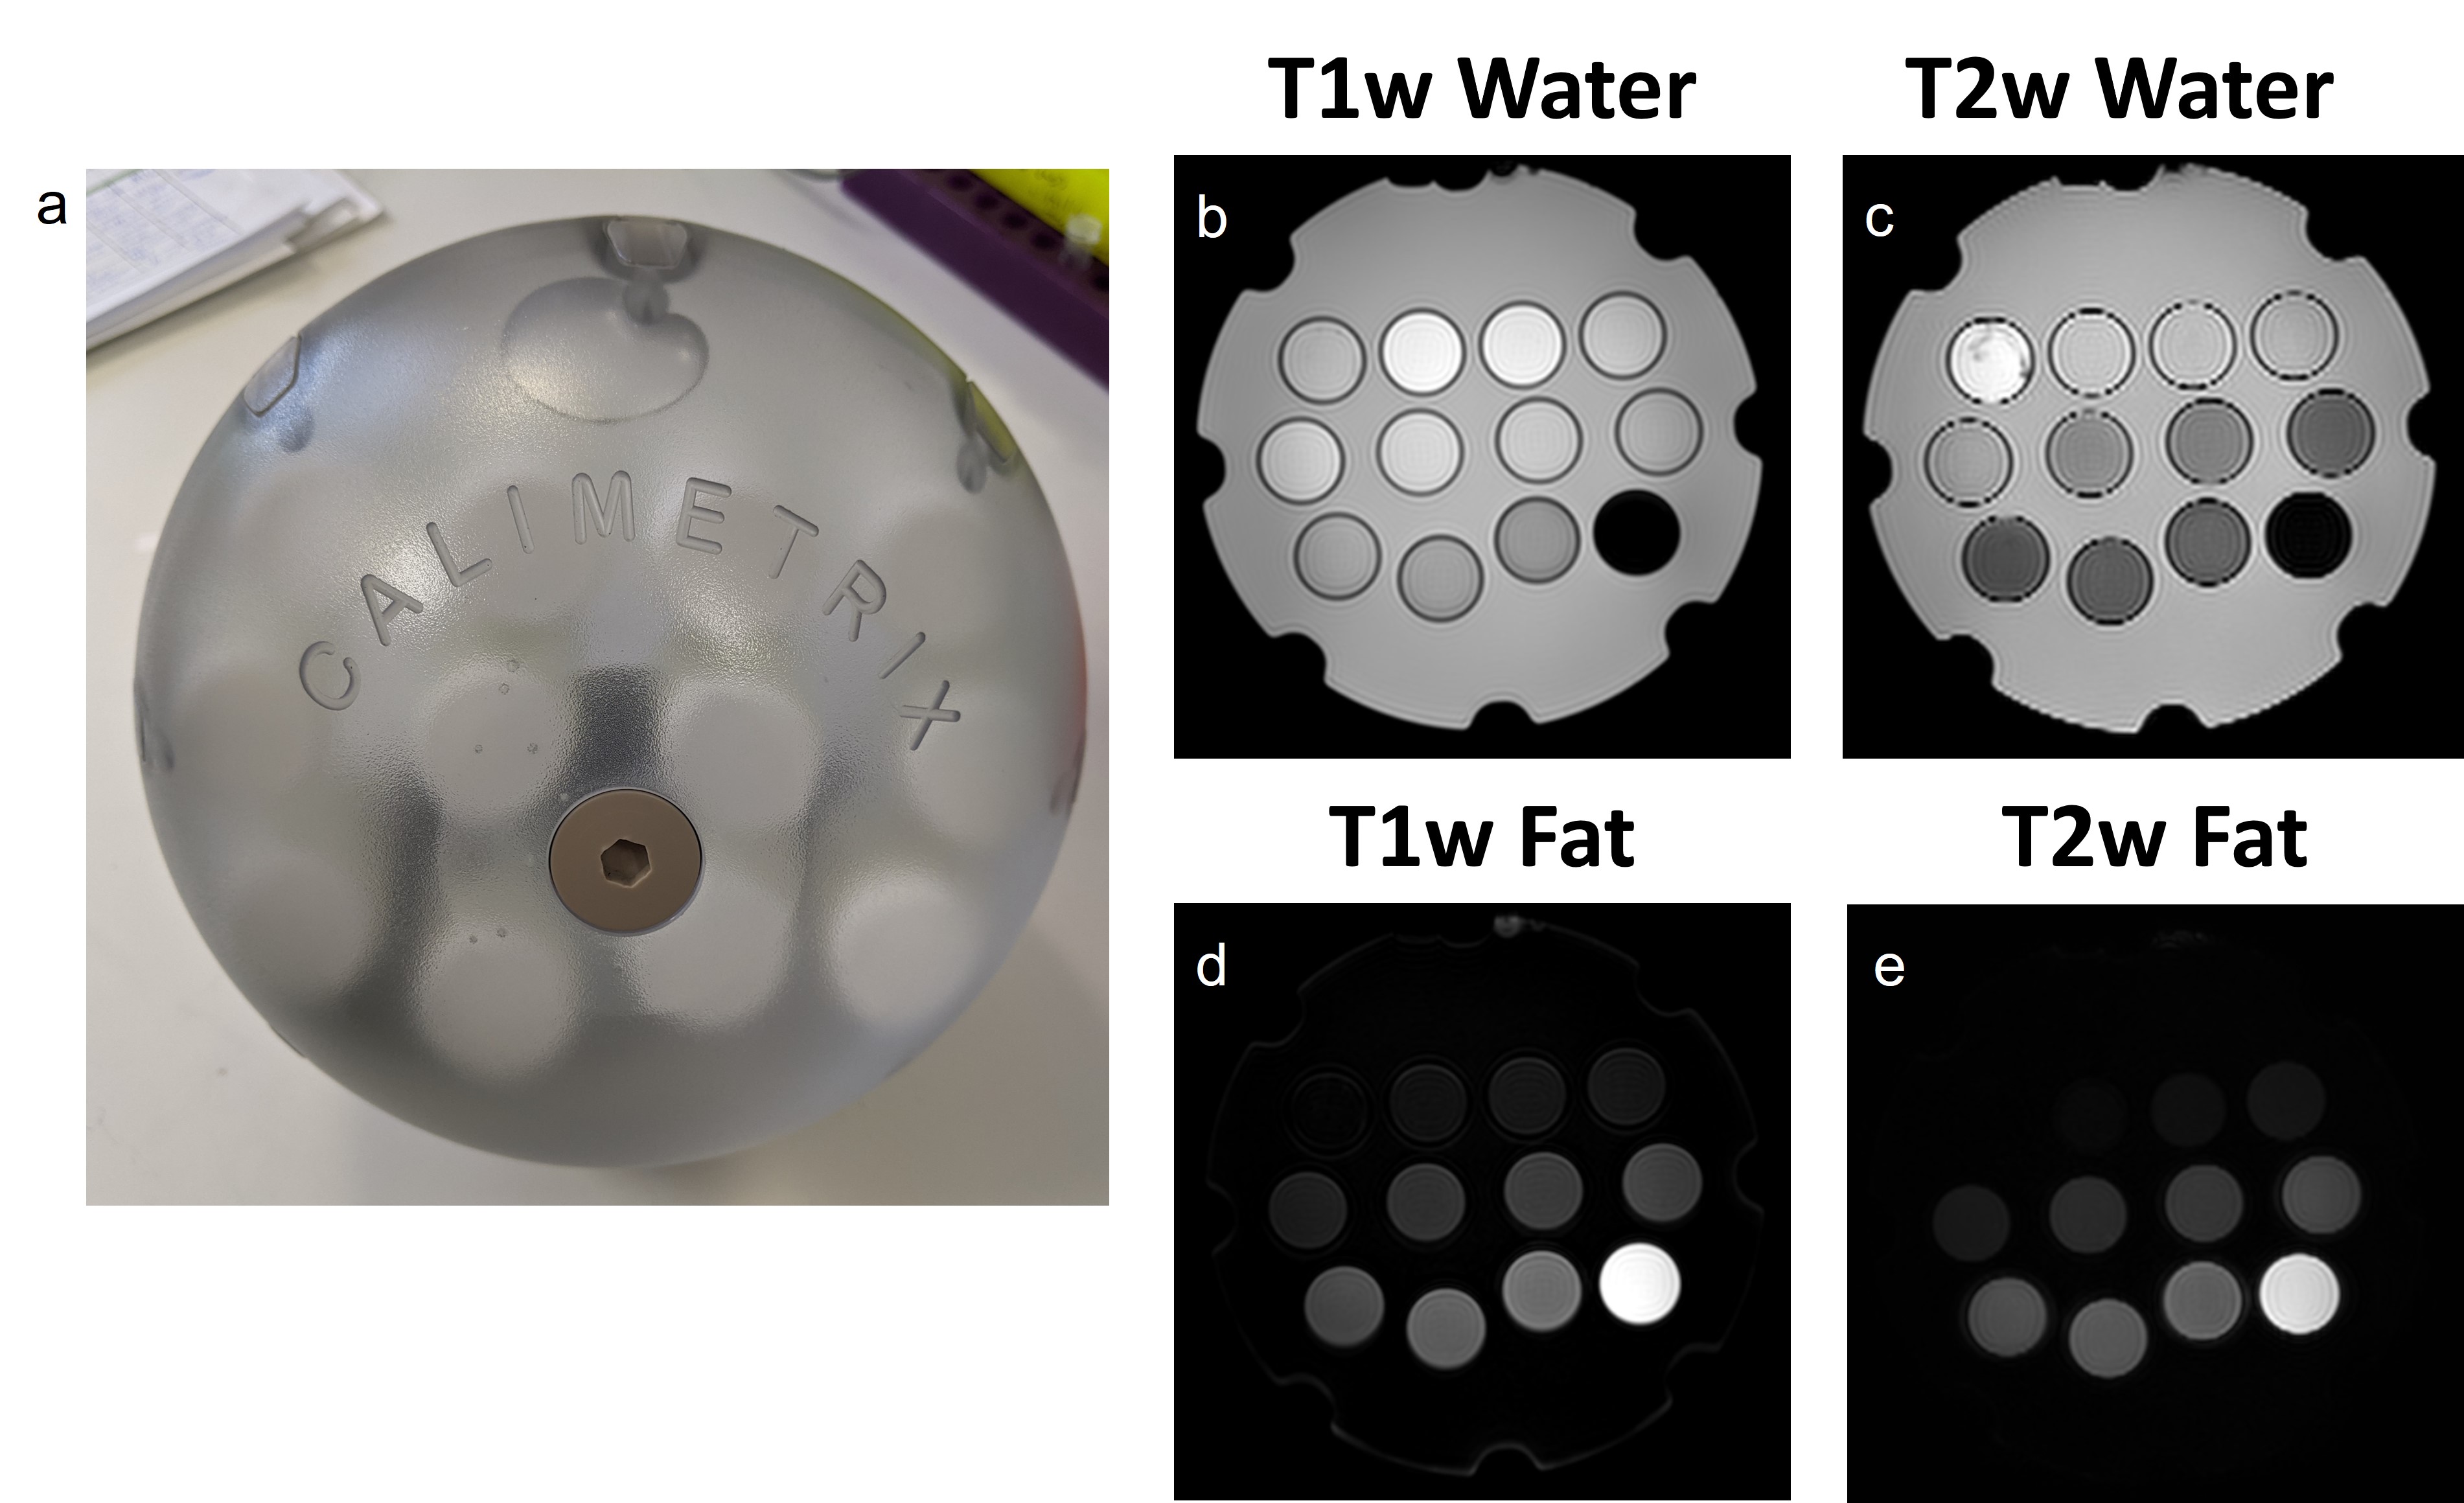
Fat-Fraction Phantom: A commercially available PDFF phantom (Fat Fraction Phantom, Model 300; Calimetrix, Madison, WI) was comprised of 12 vials (22.5 mL) with concentrations of oil and agar gel representing fat fraction values (%) of: 0, 2.4, 5.0, 7.4, 10.2, 15.4, 20.0, 25.3, 30.0, 39.0, 49.1, 100. The vials were contained in a spherical acrylic case filled with doped water (Fig. 1a).MR Imaging: MR imaging was performed on a 3T Ingenia scanner (Philips Healthcare). The fat-fraction phantom was scanned using the following sequences: 2D T2-weighted 2-point TSE-Dixon, 2D T1-weighted 2-point FFE-Dixon, and 3D T1-weighted multi-echo FFE (mDixon-Quant). The imaging parameters for the phantom were: TSE-Dixon: TR/TE=3000/80 ms, ΔTE=1.1 ms, FOV=250x250x150 mm3, acquired resolution=1x1x5 mm3, 22 slices, ETL=15, total acquisition time=4:24 min; with similar parameters for 2-echo FFE-Dixon except: TR/TE1/TE2=320/2.1/3.8 ms, flip angle=80°; total acquisition time=1:49 min; 3D mDixon-Quant: TR/TE1/∆TE=5.7/0.97/0.7 ms, 6-echoes, acquired resolution=2.5x2.5x6 mm3, 60 slices, flip angle=3°; total acquisition time=16 seconds.
Fat-Fraction Calculations: Reconstruction from both TSE and FFE Dixon 2-point acquisitions were calculated using the vendor-supplied single-peak and 7-peak fat models. Fat and water images from the single-peak reconstruction model were processed using the dark-fat algorithm2. FF maps were generated by dividing the fat-only image by the sum of the dark-fat corrected water and fat images. The ground truth mDixon-Quant reconstruction calculated FF maps from a 6-point acquisition using a 7-peak fat spectrum model4. Image Analysis: FF values from region of interests (ROIs) of separate vials in the fat-fraction phantom were calculated using the above reconstruction methods (Fig. 2), which were then analyzed for linearity against the reference mDixon-Quant values using a simple linear regression (Fig. 3-4).
Results
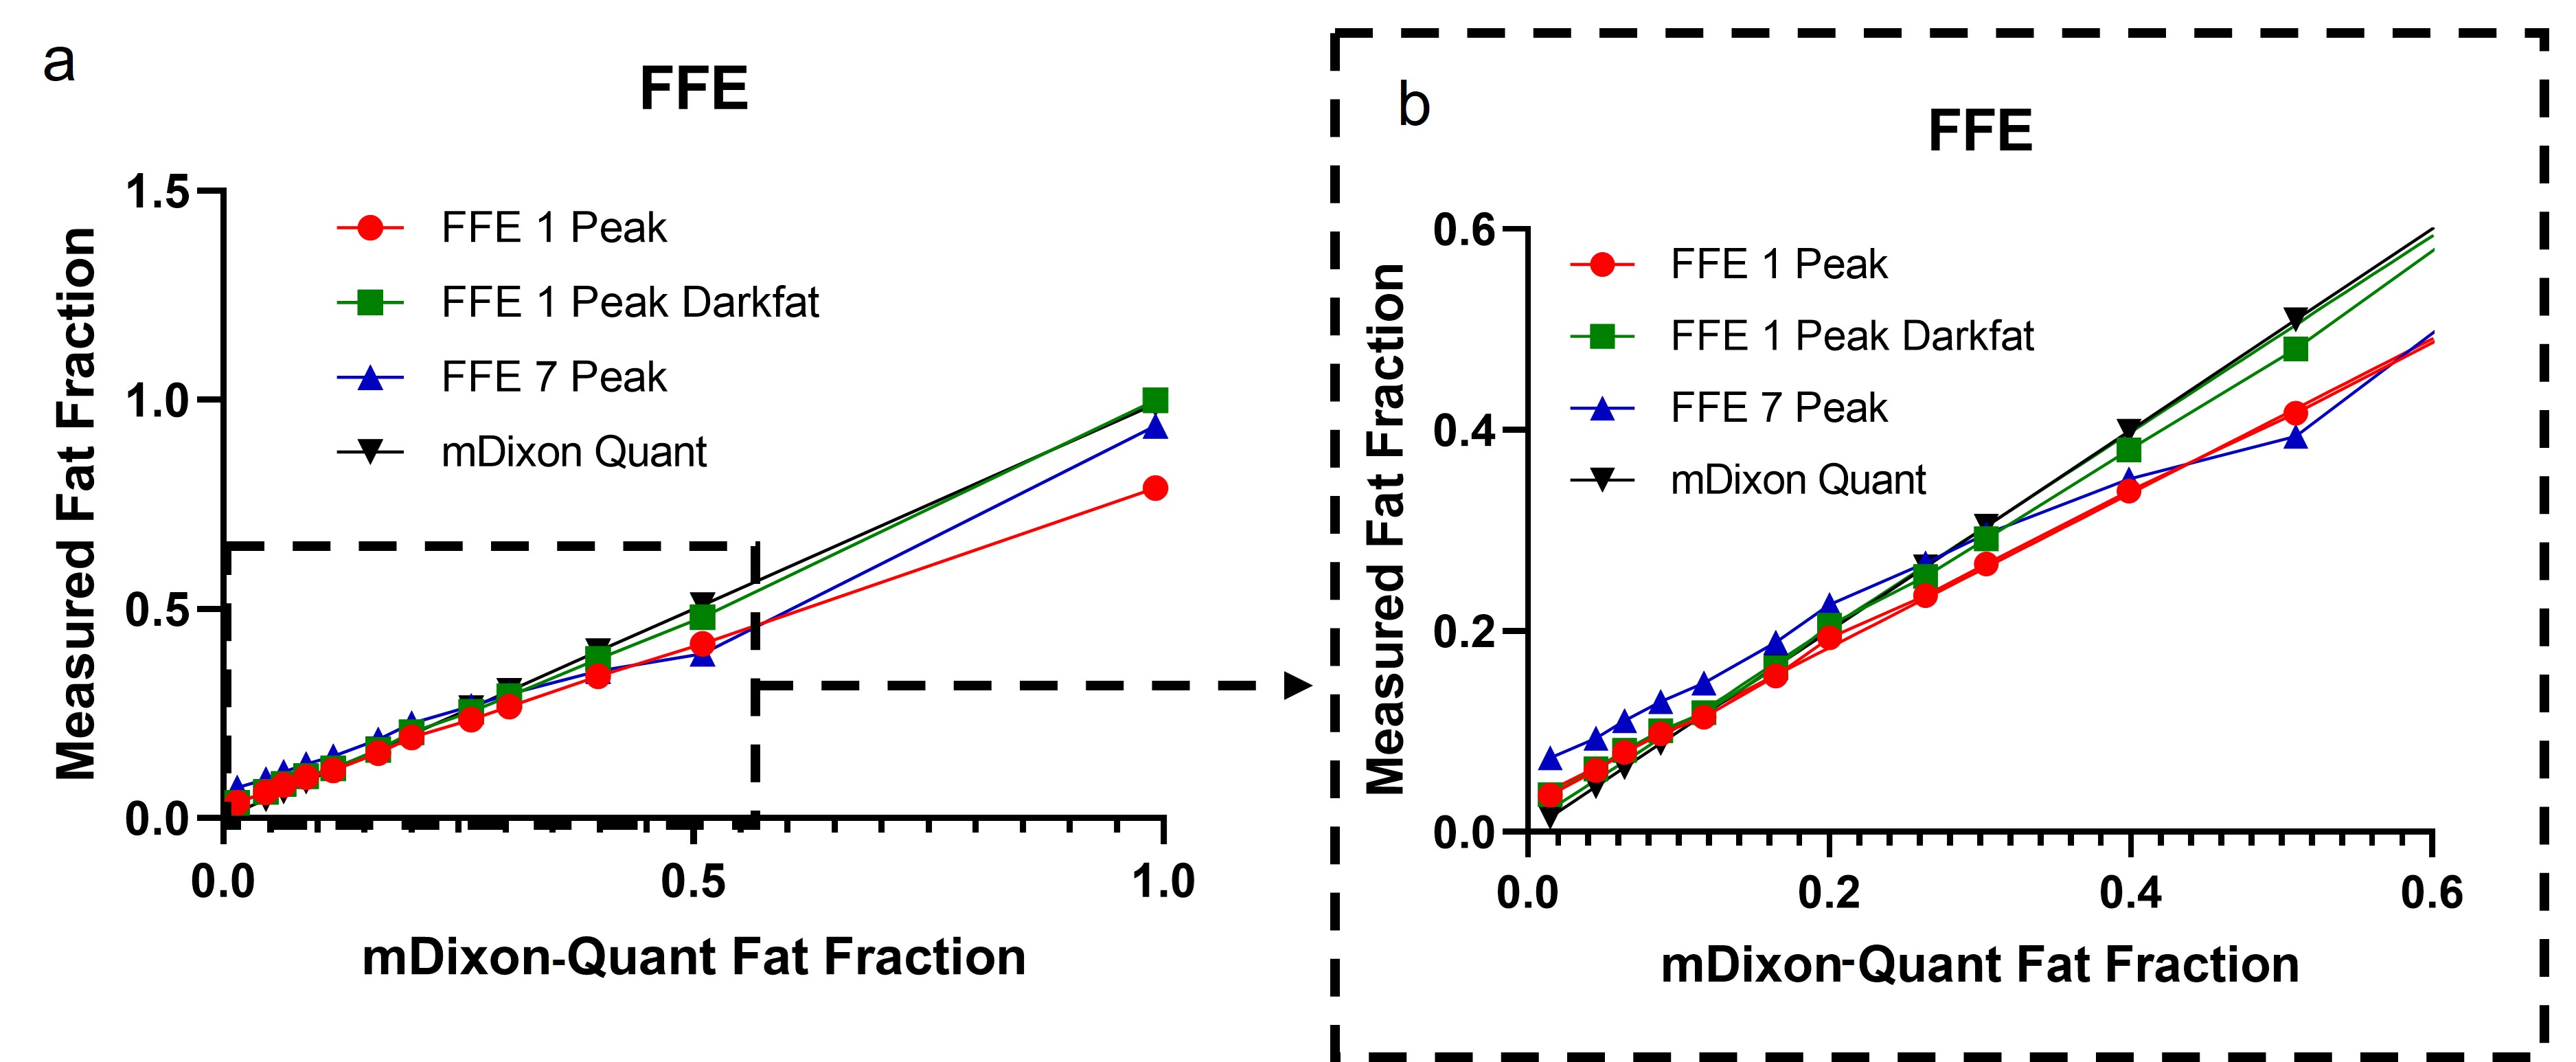
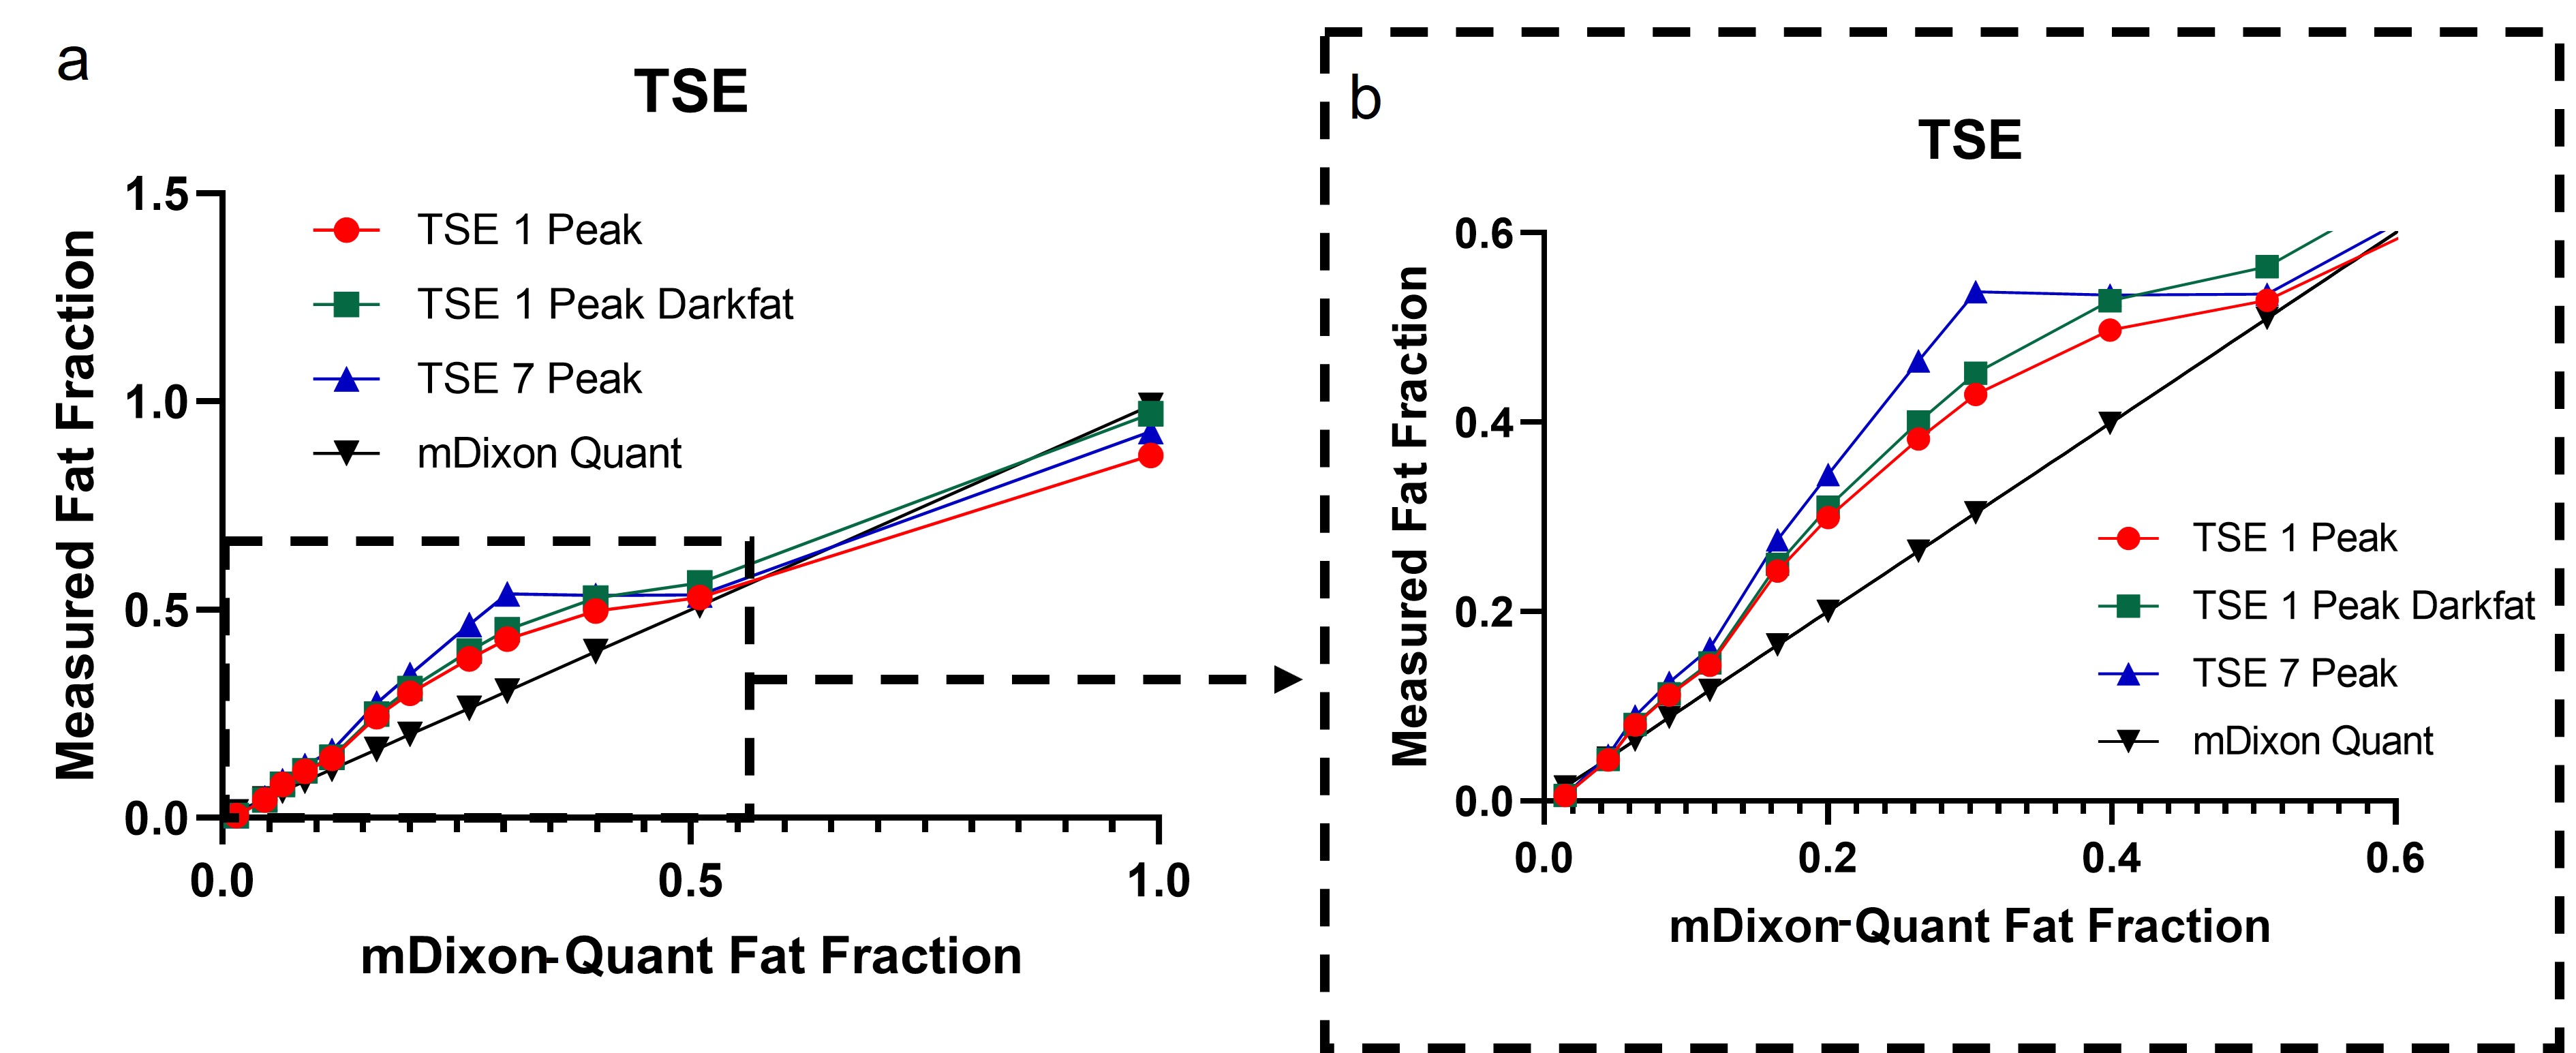
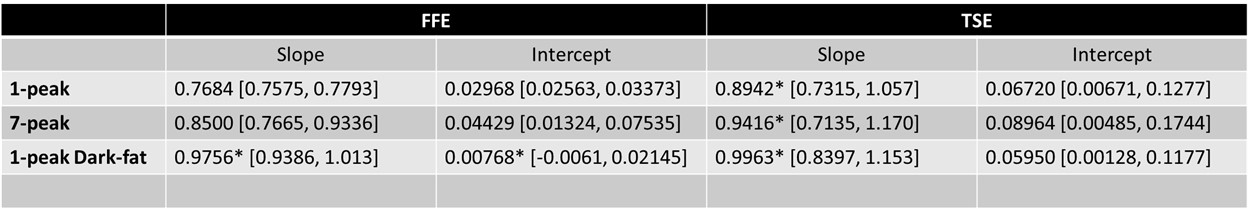
FF maps from the fat fraction phantom processed with different reconstruction methods are shown in Fig. 2. The quantitative FF values for the 2-point FFE-Dixon are shown in Fig. 3, where the application of the dark-fat algorithm reduces the FF underestimation from both the single-peak and 7-peak reconstructions and improves the linearity compared with mDixon-Quant (Fig. 5). Across the range of PDFF, the dark-fat algorithm generated FF values are close to mDixon-Quant FF values. With TSE-Dixon, there is a notable divergence of the FF values compared to the reference mDixon-Quant at lower (<50%) FF (Fig. 4b), but these values converge at higher (100%) FF (Fig. 4a).Discussion and Conclusion
The application of the dark-fat algorithm on the 2-point T1 FFE-Dixon reconstruction produces FF values across a range of PDFF that is comparable to mDixon-Quant. The 2-point TSE-Dixon scans seem to suffer from T2 bias at lower PDFF values, but perform closer to reference at higher PDFF values. This could provide a robust algorithm for the measurement of accurate quantitative FF values from the commonly used 2-point 3D T1 FFE-Dixon acquisitions that are frequently performed with gadolinium based MR contrast agents in the assessment of treatment response in multiple myeloma.Acknowledgements
This work was partly supported by the Cancer Prevention and Research Institute of Texas (CPRIT) grant, RP190049.References
1. Latifoltojar, A. et al. Whole-body MRI quantitative biomarkers are associated significantly with treatment response in patients with newly diagnosed symptomatic multiple myeloma following bortezomib induction. Eur Radiol 27, 5325-5336, doi:10.1007/s00330-017-4907-8 (2017).
2. Madhuranthakam A.J., Y. H., Alsop D.C. System and method for fat suppression in chemical shift based water-fat separated MR imaging. USA patent (2013).
3. Lin S., F. S., Udayakumar D., Batthula N., Dimitrov I.E., Pedrosa I., Madhuranthakam A.J. (2021). Fat Fraction Quantification in TSE based 2-point Dixon Acquisition: Application to Whole-body MRI. ISMRM, 3843.
4. Eggers H., Brendel B., Duijndam A. & Herigault G. Dual-echo Dixon imaging with flexible choice of echo times. Magn Reson Med 65, 96-107, doi:10.1002/mrm.22578 (2011).
Figures