2165
MAGORINO: Magnitude-only fat fraction and R2* estimation with Rician noise modelling1Centre for Medical Imaging, University College London, London, United Kingdom, 2Department of Imaging, University College London Hospital, London, United Kingdom, 3Medical Physics, University College London Hospital, London, United Kingdom, 4Centre for Medical Image Computing, University College London, London, United Kingdom
Synopsis
Magnitude signal-based fitting of chemical shift-encoded data enables proton density fat fraction (PDFF) and R2* estimation where complex signal-based fitting fails or when phase data are inaccessible/unreliable, such as in multicentre studies. However, traditional magnitude-based fitting suffers from Rician noise-related bias and fat-water swaps, limiting utility. Here, we propose MAGORINO, an algorithm combining Magnitude-Only PDFF and R2* estimation with Rician Noise modelling, to address these limitations. We demonstrate that MAGORINO outperforms traditional Gaussian noise-based magnitude-only estimation through (i) reduced noise-related bias and (ii) reduced fat-water swaps. This may be valuable in multicentre studies or when phase data are otherwise inaccessible/unreliable.
Introduction
In recent years, chemical shift-encoded MRI (CSE-MRI) has emerged as the leading method for quantifying proton density fat fraction (PDFF), an accurate, ‘confounder-corrected’ biomarker of tissue fat content (1–4). PDFF measurements are now established for the assessment of hepatic steatosis (5–7), and are increasingly used in other organs including pancreas, muscle and bone marrow (8–13). A benefit of gradient echo-based techniques for PDFF quantification is that R2* measurements can be extracted simultaneously, enabling quantification of iron or calcium (14–16). Gradient-echo based quantification of PDFF and R2* is therefore a flexible means to assess a variety of biologic and pathological processes.Most existing methods for PDFF measurement are complex-based in that they utilise both the magnitude and phase of the MRI signal to separate fat and water (1,3,17–22). However, complex-based methods may suffer from inaccuracies in field map estimation and phase errors, whilst in multicentre studies phase data may not be accessible or reliable at all participating sites. An alternative approach is magnitude-based fitting, whereby the phase is discarded. However, magnitude-based fitting requires an alternative means to resolve fat-water ambiguity and can introduce an additional parameter bias resulting from the nonzero mean of complex Gaussian noise.
To address the limitations of magnitude-based fitting, we propose a fitting algorithm combining magnitude-only fitting with Rician noise modelling, known as Magnitude-Only PDFF and R2* estimation with Rician Noise modelling (MAGORINO). We perform a series of detailed simulation experiments investigating the performance of MAGORINO against Gaussian-noise based magnitude fitting in terms of noise-related bias and fat-water swaps.
Theory
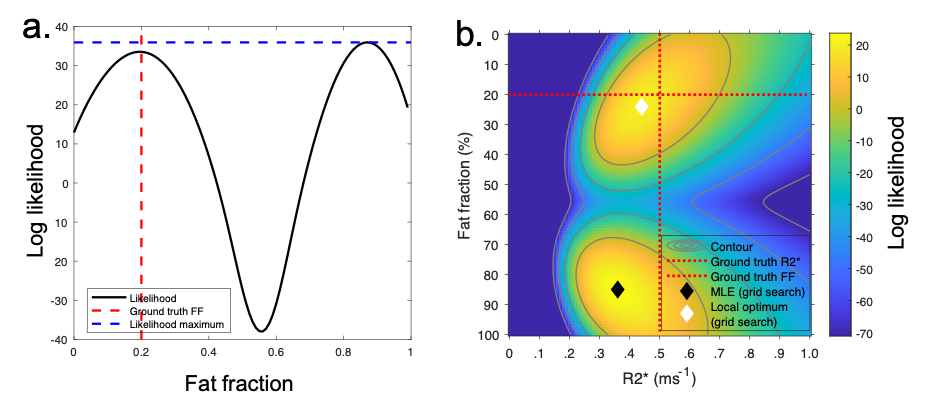
Recently, Triay-Bagur et al. described the MAGO method, employing magnitude-only fitting assuming Gaussian noise combined with two-point search, whereby two (fat- and water-dominant) initializations are used to ensure that the global likelihood maximum is identified (23). The global maximum is distinguished from the incorrect, ‘swapped’, maximum on the basis of the difference in likelihood (Fig1). However, this method can fail in the presence of noise, resulting in selection of the swapped maximum (Fig2). We propose the MAGORINO algorithm, which estimates PDFF and R2* measurements by directly maximising the likelihood based on the signal magnitude and a Rician noise model. We show here that the use of Rician noise-based estimation can improve the selection of the correct maximum when using a two-point search approach, as well as reducing bias through a shift in the position of the maxima.Methods
Simulations of multi-echo gradient echo signal intensities are used to investigate the performance and behaviour of MAGORINO over the space of clinically plausible PDFF, R2* and SNR values. Fitting performance is assessed in terms of parameter bias, precision and fitting error. To gain deeper insights into algorithm behaviour, the paths on the likelihood functions are visualized and statistics describing correct optimization are generated. MAGORINO is compared against MAGO (i.e. Gaussian noise-based magnitude fitting) and complex fitting. Complex fitting is performed with (i) the field inhomogeneity fB as an estimated parameter and (ii) fixed (correct) fB; the latter provides a useful control experiment to show performance under idealised conditions (although this performance is not likely to be achievable in practice).Results and Discussion
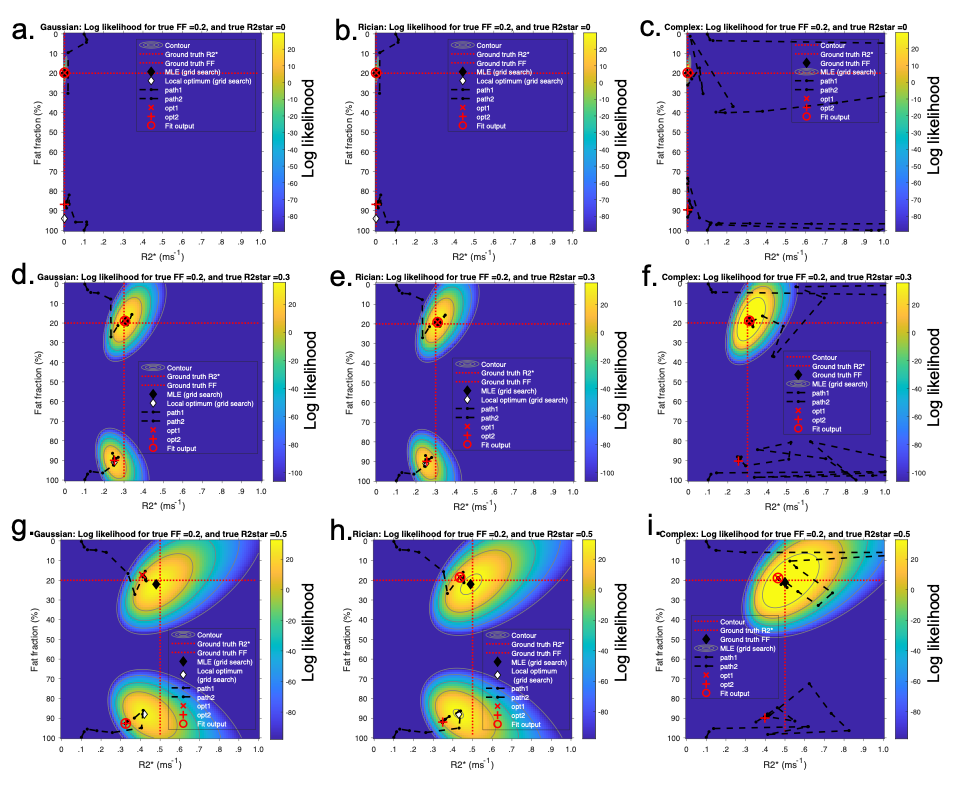
Fig3 shows the mean error on PDFF, R2* and S0 relative to the ground truth values. A key benefit of MAGORINO can be observed at FF values <50% with R2*>0.4: Gaussian fitting shows a substantial positive bias in FF measurements, indicating frequent fat-water swaps (top right of Fig3a), whereas Rician and complex fitting both substantially reduce this swap-related bias. For R2* measurements (middle row), Gaussian fitting carries a substantial negative bias in R2* measurements, which is most severe at high R2* and in the intermediate FF range. This bias is substantially reduced by Rician and complex fitting, with similar performance for both algorithms. Figs 4 and 5 provide further insight into the behaviour of the algorithms for three PDFF/R2* combinations corresponding to the top half of the FF error plots shown in Fig3(a-d), specifically, a single PDFF of 0.2 with low, intermediate and high R2*. As R2* increases, the frequency with which the swapped solution is selected increases, but this increase is mitigated by the use of Rician and complex fitting. For Gaussian fitting, at high R2*, the majority of fitted solutions are incorrect (swapped) (Fig4g) whereas the majority of solutions are correct (non-swapped) for Rician and complex fitting (Fig4h,i,). Fig5 shows the likelihood functions obtained for a single noise instantiation for the three chosen PDFF/R2* combinations. At low R2* (top and middle rows), all three methods can identify the true (non-swapped) solution. However, at higher R2* (third row), for Gaussian fitting the swapped solution assumes a higher likelihood and is chosen as the fit output by the MAGO algorithm, accounting for the behaviour in Fig 4.Conclusion
MAGORINO reduces bias in both PDFF and R2* measurements compared to Gaussian fitting through two main mechanisms: (i) a greater chance of selecting the true (non-swapped) likelihood maximum, and (ii) a shift in the position of the maximum such that the estimates are closer to ground truth solutions, as a result of the correct noise model. It may be valuable where complex-based methods fail or when phase data is inaccessible/unreliable, such as in multicentre studies.Acknowledgements
Timothy J.P. Bray is supported by an NIHR Clinical Lectureship (CL-2019-18-001). MHC is supported by the National Institute for Health Research (NIHR) Biomedical Research Centre (BRC). This work was undertaken at UCLH/UCL, which receives funding from the UK Department of Health’s NIHR BRC funding scheme. The views expressed in this publication are those of the authors and not necessarily those of the UK Department of Health.References
1. Liu CY, McKenzie CA, Yu H, Brittain JH, Reeder SB. Fat quantification with IDEAL gradient echo imaging: Correction of bias from T1 and noise. Magnetic Resonance in Medicine. 2007;58(2):354-64
2. Reeder SB, Wen Z, Yu H, Pineda AR, Gold GE, Markl M, et al. Multicoil Dixon Chemical Species Separation with an Iterative Least-Squares Estimation Method. Magnetic Resonance in Medicine. 2004;51(1):35–45.
3. Reeder SB, Pineda AR, Wen Z, Shimakawa A, Yu H, Brittain JH, et al. Iterative decomposition of water and fat with echo asymmetry and least-squares estimation (IDEAL): Application with fast spin-echo imaging. Magnetic Resonance in Medicine. 2005;54(3):636–44.
4. Yokoo T, Serai SD, Pirasteh A, Bashir MR, Hamilton G, Hernando D, et al. Linearity, Bias, and Precision of Hepatic Proton Density Fat Fraction Measurements by Using MR Imaging: A Meta-Analysis. Radiology. 2018;286(2):486-498.
5. Middleton MS, van Natta ML, Heba ER, Alazraki A, Trout AT, Masand P, et al. Diagnostic accuracy of magnetic resonance imaging hepatic proton density fat fraction in pediatric nonalcoholic fatty liver disease. Hepatology. 2018;67(3):858–72.
6. Middleton MS, Heba ER, Hooker CA, Bashir MR, Fowler KJ, Sandrasegaran K, et al. Agreement Between Magnetic Resonance Imaging Proton Density Fat Fraction Measurements and Pathologist-Assigned Steatosis Grades of Liver Biopsies From Adults With Nonalcoholic Steatohepatitis. Gastroenterology [Internet]. 2017;153(3):753–61.
7. Noureddin, M, Lam, J, Peterson, MR, Middleton, M, Hamilton G, Le T. Utility of magnetic resonance imaging versus histology for quantifying changes in liver fat in nonalcoholic fatty liver disease trials. Hepatology. 2013;58(6):1930–40.
8. Yoon JH, Lee JM, Lee KB, Kim S-W, Kang MJ, Jang J-Y, et al. Pancreatic Steatosis and Fibrosis: Quantitative Assessment with Preoperative Multiparametric MR Imaging. Radiology [Internet]. 2016;279(1):140–50.
9. Kühn J-P, Berthold F, Mayerle J, Völzke H, Reeder SB, Rathmann W, et al. Pancreatic steatosis demonstrated at MR imaging in the general population: Clinical relevance. Radiology [Internet]. 2015;276(1):129–36.
10. Morrow JM, Sinclair CDJ, Fischmann A, Machado PM, Reilly MM, Yousry TA, et al. MRI biomarker assessment of neuromuscular disease progression: A prospective observational cohort study. The Lancet Neurology. 2015;15(1):65–77.
11. Janiczek RL, Gambarota G, Sinclair CDJ, Yousry TA, Thornton JS, Golay X, et al. Simultaneous T 2 and lipid quantitation using IDEAL-CPMG. Magnetic Resonance in Medicine. 2011;66(5):1293–302.
12. Bray TJP, Bainbridge A, Punwani S, Ioannou Y, Hall-Craggs MA. Simultaneous Quantification of Bone Edema/Adiposity and Structure in Inflamed Bone Using Chemical Shift-Encoded MRI in Spondyloarthritis. Magnetic Resonance in Medicine. 2018;79(2):1031–42.
13. Latifoltojar A, Hall-Craggs M, Bainbridge A, Rabin N, Popat R, Rismani A, et al. Whole-body MRI quantitative biomarkers are associated significantly with treatment response in patients with newly diagnosed symptomatic multiple myeloma following bortezomib induction. European Radiology. 2017;27(12):5325–36.
14. Hernando D, Kramer JH, Reeder SB. Multipeak fat-corrected complex R2* relaxometry: Theory, optimization, and clinical validation. Magnetic Resonance in Medicine. 2013;70(5):1319–31.
15. Hernando D, Levin YS, Sirlin CB, Reeder SB. Quantification of liver iron with MRI: State of the art and remaining challenges. Journal of Magnetic Resonance Imaging. 2014;40(5):1003-21.
16. Wells SA, Schubert T, Motosugi U, Sharma SD, Campo CA, Kinner S, et al. Pharmacokinetics of Ferumoxytol in the Abdomen and Pelvis: A Dosing Study with 1.5- and 3.0-T MRI Relaxometry. Radiology. 2019;190489.
17. Reeder SB, Wen Z, Yu H, Pineda AR, Gold GE, Markl M, et al. Multicoil Dixon Chemical Species Separation with an Iterative Least-Squares Estimation Method. Magnetic Resonance in Medicine. 2004;51(1):35–45.
18. Reeder SB, McKenzie CA, Pineda AR, Yu H, Shimakawa A, Brau AC, et al. Water-fat separation with IDEAL gradient-echo imaging. Journal of Magnetic Resonance Imaging. 2007;25(3):644-52.
19. Reeder SB, Robson PM, Yu H, Shimakawa A, Hines CDG, McKenzie CA, et al. Quantification of hepatic steatosis with MRI: The effects of accurate fat spectral modeling. Journal of Magnetic Resonance Imaging. 2009;29(6):1332–9.
20. Yu H, McKenzie CA, Shimakawa A, Vu AT, Brau ACS, Beatty PJ, et al. Multiecho reconstruction for simultaneous water-fat decomposition and T2* estimation. Journal of Magnetic Resonance Imaging. 2007;26(4):1153–61.
21. Hernando D, Haldar JP, Sutton BP, Ma J, Kellman P, Liang ZP. Joint estimation of water/fat images and field inhomogeneity map. Magnetic Resonance in Medicine. 2008;59(3):571–80.
22. Hernando D, Kellman P, Haldar JP, Liang ZP. Robust water/fat separation in the presence of large field inhomogeneities using a graph cut algorithm. Magnetic Resonance in Medicine. 2010;63(1):79–90.
23. Triay Bagur A, Hutton C, Irving B, Gyngell ML, Robson MD, Brady M. Magnitude-intrinsic water–fat ambiguity can be resolved with multipeak fat modeling and a multipoint search method. Magnetic Resonance in Medicine. 2019;82(1):460-475.
Figures