2163
Protocol adaptive Stacked transfer learning (STL) U-NET with small dataset training for soft tissue segmentation in dynamic speech MRI1Roy J Carver Department of Biomedical Engineering, University of Iowa, Iowa city, IA, United States, 2Department of Radiology, University of Iowa, Iowa city, IA, United States
Synopsis
We develop a protocol adaptive Stacked transfer learning (STL) U-NET for soft tissue segmentation in dynamic speech MRI. Our approach leverages knowledge from large open-source datasets, and only needs to be trained on small number of protocol specific images (of the order of 20 images). We demonstrate the utility of STL U-NET in efficiently segmenting soft-tissue articulators from three different protocols with different field strengths, vendors, acquisition, reconstruction. Using the DICE similarity metric, we demonstrate segmentation accuracies with our approach to be at the level of manual segmentation.
Purpose
Speech production involves complex and intricate coordination of soft tissues like velum, tongue, glottis and epiglottis. With the movement of these articulators, one can generate a variety of sounds, and language. Segmenting the soft tissues is a crucial step to understanding the dynamics involved in speech production. Current deep learning segmentation algorithms1-3 that segment soft tissues and the airway require large amounts of training data (of the order of 500 or more images) which should be specific to the protocol. These algorithms would need to be re-trained when applied to images acquired from a different protocol. Given that various speech MRI protocols are continuously evolving based on various scanner field strengths, acquisition, and reconstruction schemes4-6, there is a need for an efficient segmentation algorithm that is robust to the choice of the speech MRI protocol. In this work, we therefore develop a novel speech MRI soft-tissue Stacked transfer learning (STL) U-NET segmentation approach that adapts to the protocol and segments the tongue and velum with very small training data (of the order of 20 images).Methods
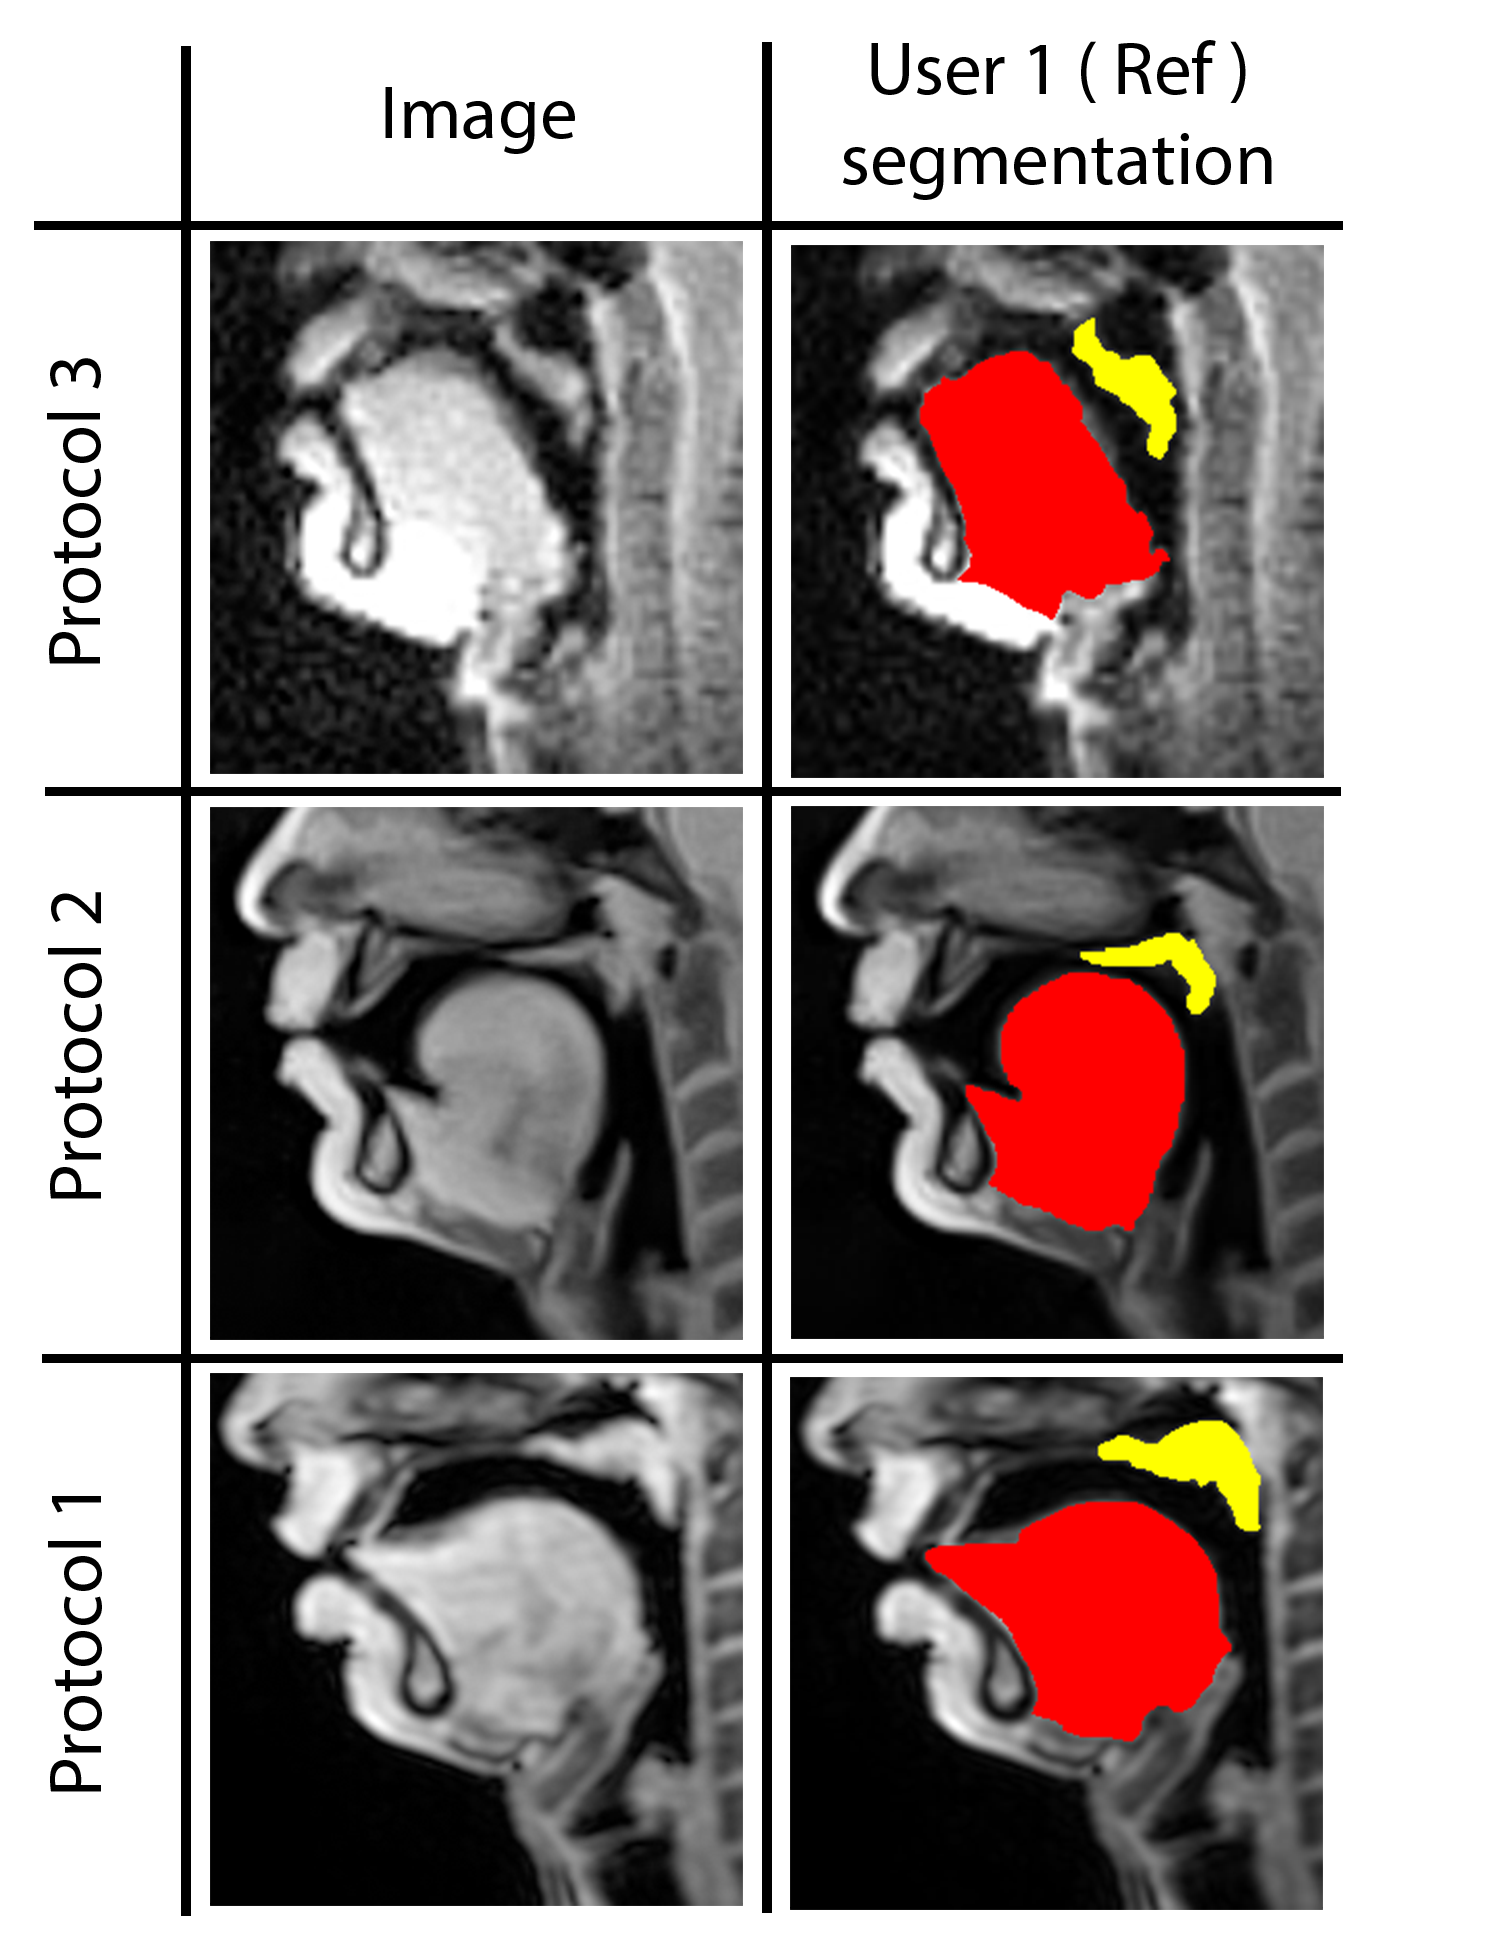
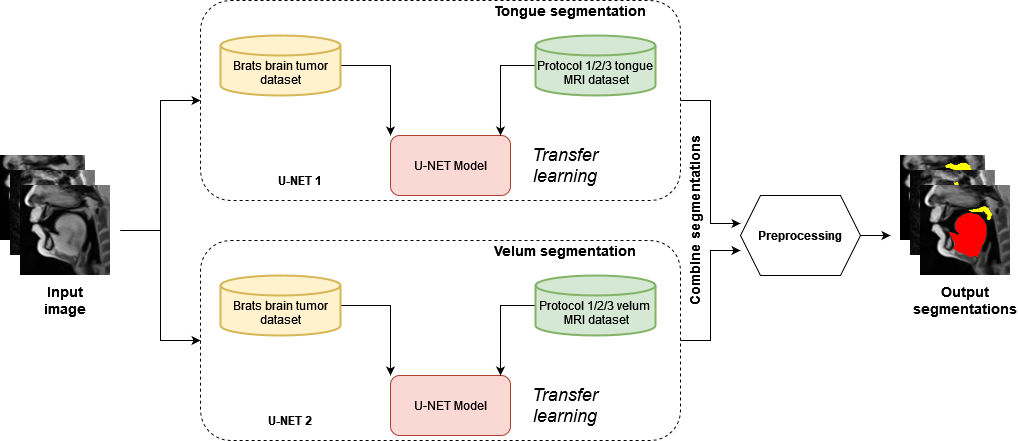
Our STL U-NET learns the mapping between mid-sagittal speech image and the segmentation of the tongue and velum. We use dynamic speech datasets acquired from three different MRI protocols on different scanner vendors and field strengths to train and test the network. The protocols are: 1) GE 1.5 T, under-sampled spirals, reconstructed with view-sharing (fast GRE sequence, spatial resolution: 2.9 mm2, flip angle:150, frame rate: 23.18 fps)4 . 2) Siemens 3 T, under-sampled radials, coupled with non-linear iterative regularization (NLINV); RF spoiled FLASH sequence (spatial resolution: 1.6 mm2 ; frame rate: ~50 fps, flip angle:50, FOV: 22.0 x 22.0 mm2 )5. 3) GE 3T, under-sampled variable density spirals, coupled with manifold regularization (fast GRE, spatial resolution: 2.4 mm2, flip angle: 50, frame rate: 55 fps)6. A few samples from all the three protocols along with reference (manually guided segmentation) is shown in figure 1.In addition to the three speech MRI protocols, the BRATS brain tumor dataset7–11 containing 65 multi-contrast MR scans of low- and high-grade glioma patients, and corresponding segmentation of tumors were leveraged. The rationale for the inclusion of the BRATS dataset was because of the similarity of the task of segmentation of soft tissues from neighboring airway in speech MRI to segmentation of glioma from neighboring healthy brain regions. This specific dataset is used to pre-train the U-NET. From all the three speech protocols, two subjects were selected where one is used for training and the other for testing. Here we have chosen a sample size of 20 images for training, 10 images for testing, and 3 images for validation from all three datasets. Test images are segmented twice, one as User 1 (reference) segmentation and the second as User 2 segmentation to understand the relationship of the neural network segmentation with a second annotator. The network architecture is shown in figure 2. The two U-NET’s ( 1 & 2 ) are pre-trained with 20000 images from the BRATS dataset. Later the last 5 layers of U-NET are retrained with the soft tissue segmentation from datasets in protocols 1, 2, 3. The architecture was implemented in Keras with TensorFlow12 backend on an Nvidia 2080 GPU, and the training time was 2 hours. Post-processing steps involve thresholding, pixel removal, and binarization on the output segmentation from the network. Performance was evaluated using DICE similarity (D)13 of the estimated segmentation mask with User 1 (reference). To assess a human annotator performance on the same task, we have calculated the DICE similarity of User 2 with reference segmentation.
Results
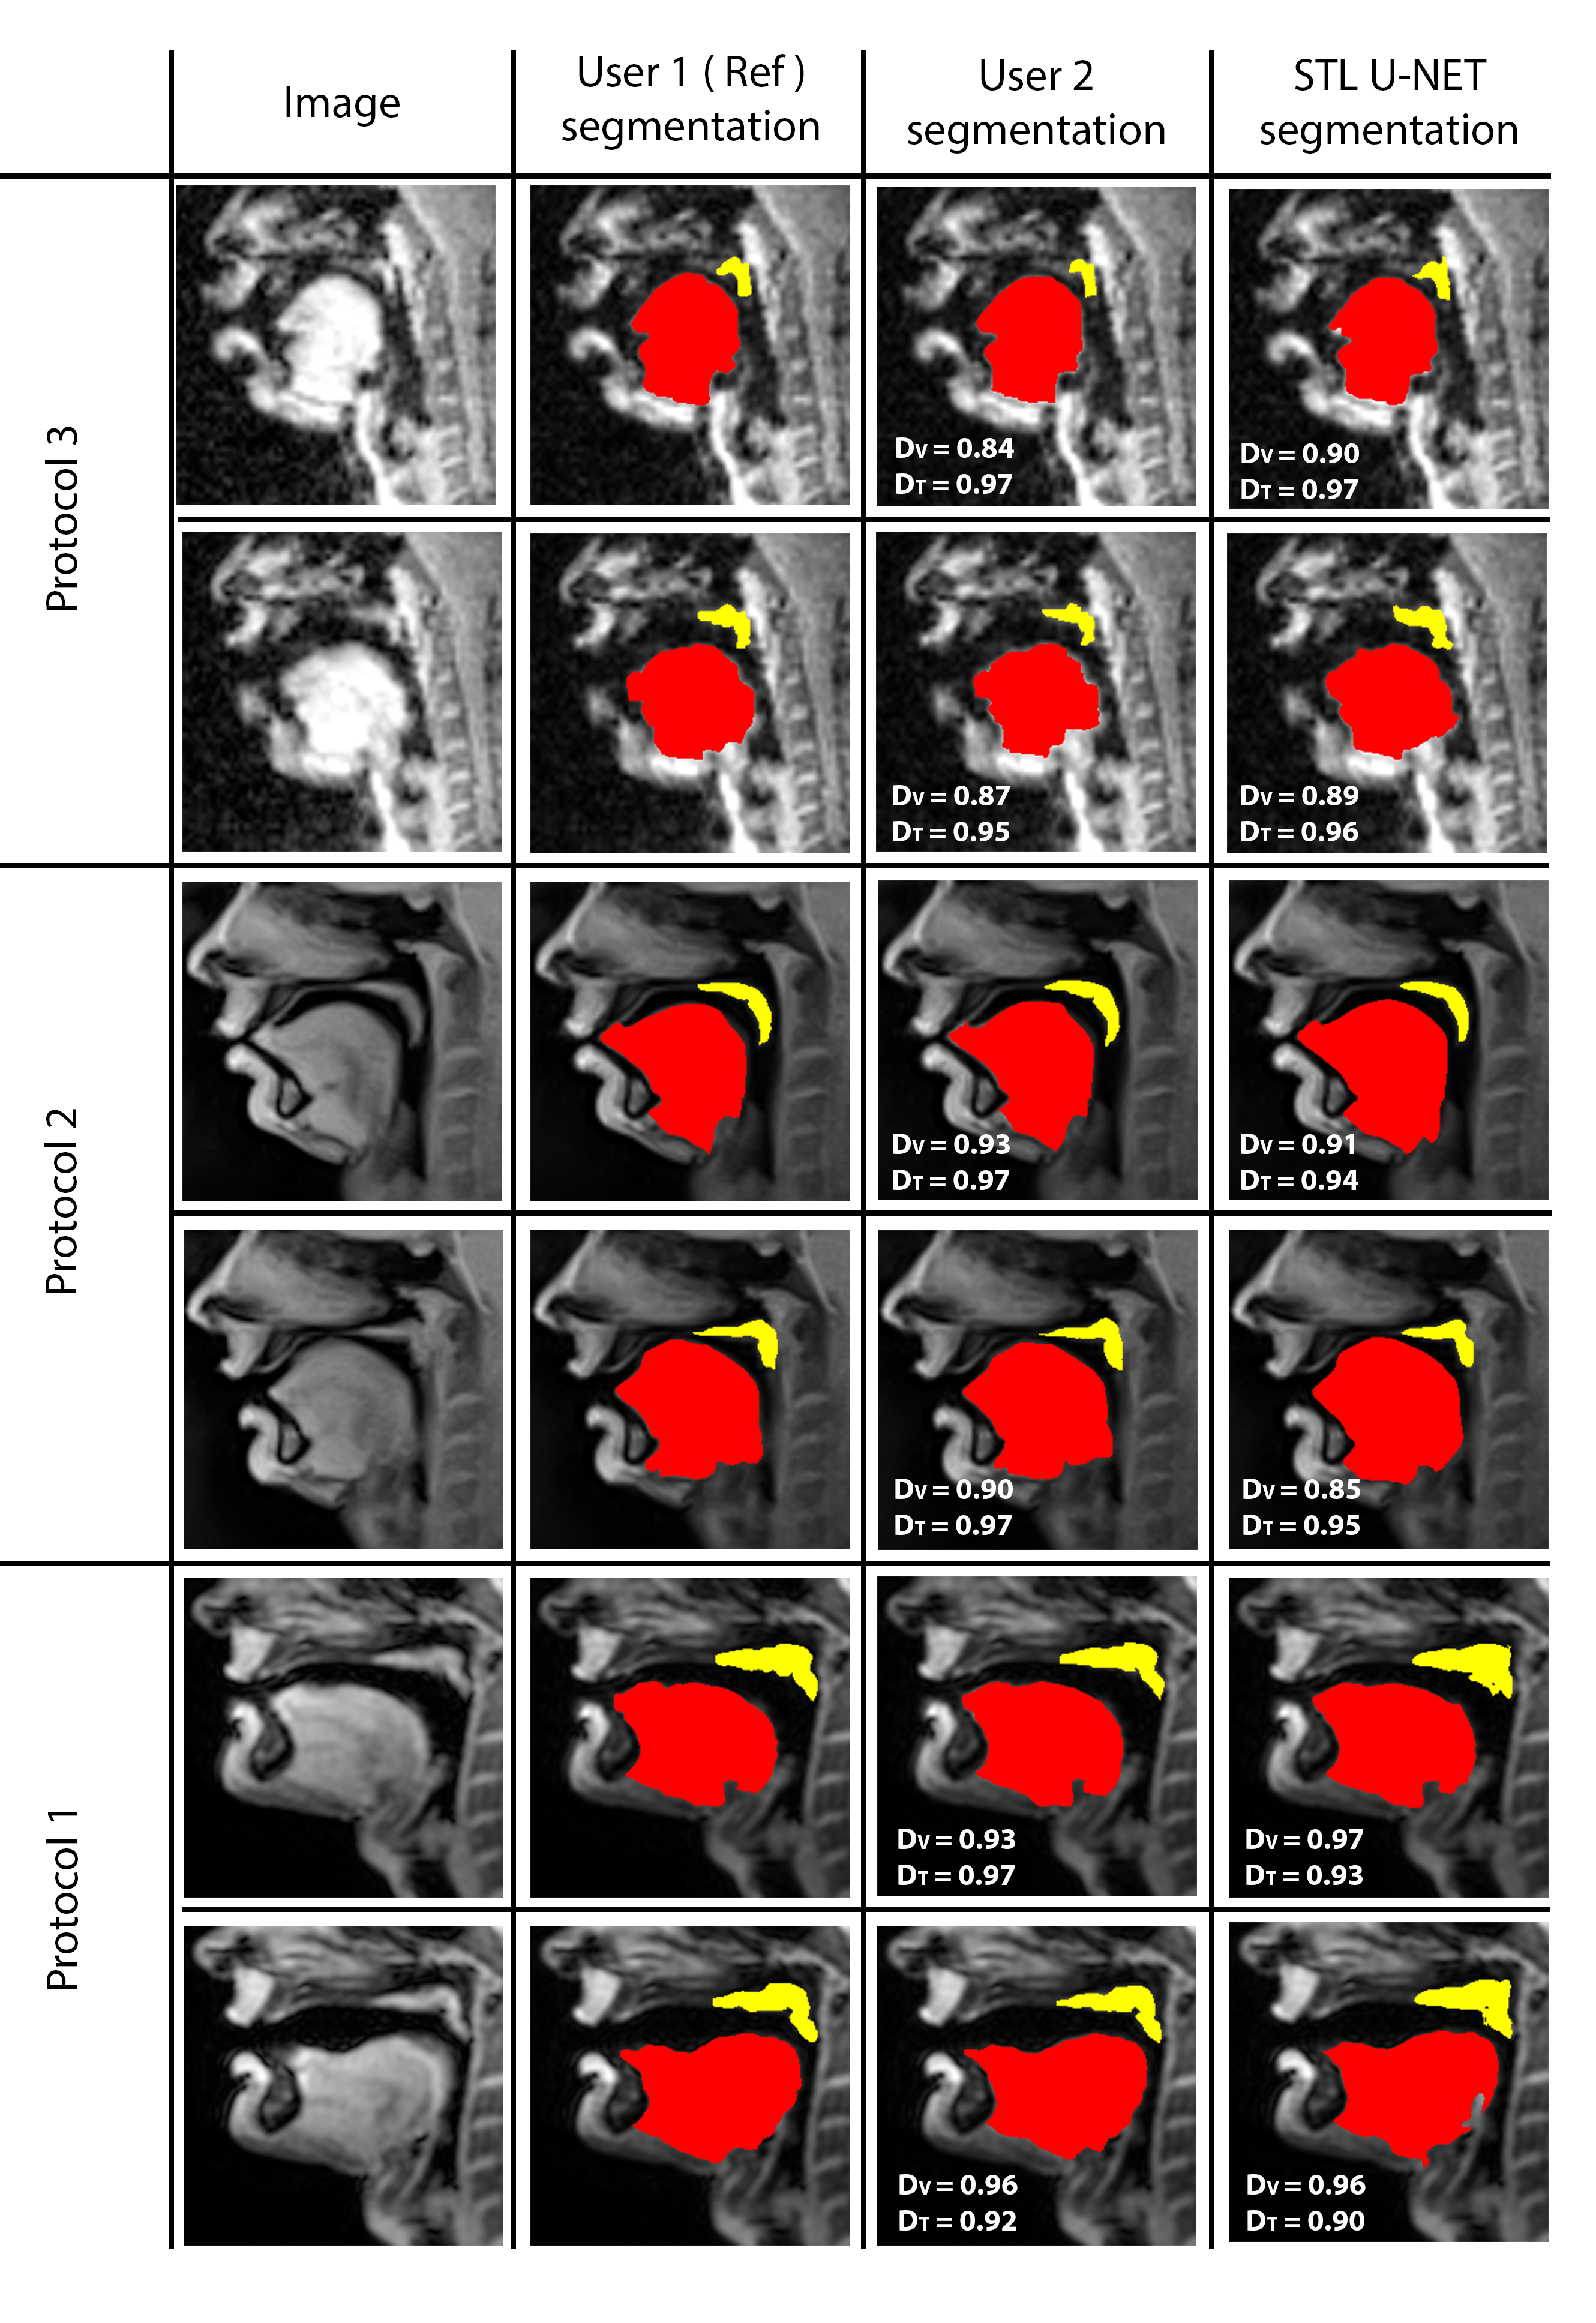
Figure 3 shows the DICE value comparison between mid-sagittal images from three different MRI protocols with their stacked U-NET segmentation and User 2 segmentation. It can be observed that the User 2 and STL U-NET had similar segmentation accuracies when compared against the reference segmentation. The min and max value dispersion on all the three speech datasets follow similar pattern as the User 2 segmentation. Figure 4 allows us to compare the similarity of STL U-NET segmentation visually and quantitatively with reference over all three protocols. Finally, figure 5 shows the animation of the segmentations on the dynamic MRI database on all the test images. Our STL U-NET also demonstrated faster processing times to generate the segmentation. The average mean processing times were 2 sec/image for STL U-NET, 122 sec/image for reference, and 100 sec/image for the User 2 segmentations.Conclusion
We successfully demonstrated soft tissue segmentation in speech MRI on three different acquisition protocols with very small dataset training using an STL U-NET architecture. The network is trained to learn the end-to-end mapping between mid-sagittal image and segment tongue and velum by leveraging training knowledge from large open-source datasets, and small protocol-specific datasets. Once trained, the model can perform soft tissue segmentation of the order of 2 second/slice on an Nvidia 2080 GPU. We demonstrated that STL U-NET architecture is protocol adaptive by training and testing three different protocol datasets. STL U-NET also showed similar dice scores when compared to a second manual annotator.Acknowledgements
Imaging dataset used in protocol 3 were acquired on an MRI instrument funded by the NIH-1S10OD025025-01References
1. Erattakulangara, S., and Lingala, S.G. (2020). Airway segmentation in speech MRI using the U-net architecture. In Proceedings - International Symposium on Biomedical Imaging (IEEE Computer Society), pp. 1887–1890.
2. Erattakulangara, S., and Lingala, S.G. U-net based automatic segmentation of the vocal tract airspace in speech MRI.
3. Ruthven, M., Miquel, M.E., and King, A.P. (2021). Deep-learning-based segmentation of the vocal tract and articulators in real-time magnetic resonance images of speech. Computer Methods and Programs in Biomedicine 198.
4. Sorensen, T., Skordilis, Z., Toutios, A., Kim, Y.C., Zhu, Y., Kim, J., Lammert, A., Ramanarayanan, V., Goldstein, L., Byrd, D., et al. (2017). Database of volumetric and real-time vocal tract MRI for speech science. In Proceedings of the Annual Conference of the International Speech Communication Association, INTERSPEECH (International Speech Communication Association), pp. 645–649.
5. Isaieva, K., Laprie, Y., Leclère, J., Douros, I.K., Felblinger, J., and Vuissoz, P.A. (2021). Multimodal dataset of real-time 2D and static 3D MRI of healthy French speakers. Scientific Data 8.
6. Rusho, R.Z., Alam, W., Ahmed, A.H., Kruger, S.J., Jacob, M., Goud, S., Roy, L., and Carver, J. Rapid dynamic speech imaging at 3Tesla using combination of a custom airway coil, variable density spirals and manifold regularization.
7. Menze, B.H., Jakab, A., Bauer, S., Kalpathy-Cramer, J., Farahani, K., Kirby, J., Burren, Y., Porz, N., Slotboom, J., Wiest, R., et al. (2015). The Multimodal Brain Tumor Image Segmentation Benchmark (BRATS). IEEE Transactions on Medical Imaging 34, 1993–2024.
8.Bakas, S., Reyes, M., Jakab, A., Bauer, S., Rempfler, M., Crimi, A., Shinohara, R.T., Berger, C., Ha, S.M., Rozycki, M., et al. (2018). Identifying the Best Machine Learning Algorithms for Brain Tumor Segmentation, Progression Assessment, and Overall Survival Prediction in the BRATS Challenge.
9. ISLES challenge (2018) http://www.isles-challenge.org/ISLES2018/.
10. ISLES challenge (2017) http://www.isles-challenge.org/ISLES2017/.
11. BRATS challenge (2018) https://www.med.upenn.edu/sbia/brats2018.html.
12. Abadi, M., Agarwal, A., Barham, P., Brevdo, E., Chen, Z., Citro, C., Corrado, G.S., Davis, A., Dean, J., Devin, M., et al. (2016). TensorFlow: Large-Scale Machine Learning on Heterogeneous Distributed Systems.
13. Bertels, J., Eelbode, T., Berman, M., Vandermeulen, D., Maes, F., Bisschops, R., and Blaschko, M. (2019). Optimizing the Dice Score and Jaccard Index for Medical Image Segmentation: Theory & Practice.
Figures