2160
Generalisability of Automated CNN-based Renal Segmentation for Multi-Vendor Studies1Sir Peter Mansfield Imaging Centre, University of Nottingham, Nottingham, United Kingdom, 2Centre for Cardiovascular Science, University of Edinburgh, Edinburgh, United Kingdom, 3Department of Radiology, University of Cambridge, Cambridge, United Kingdom, 4Department of Infection, Immunity and Cardiovascular Disease, University of Sheffield, Sheffield, United Kingdom, 5Neuroradiological Academic Unit, UCL Queen Square Institute of Neurology, University College London, London, United Kingdom, 6Dementia Research Centre, UCL Queen Square Institute of Neurology, University College London, London, United Kingdom, 7Wellcome Centre for Human Neuroimaging, UCL Queen Square Institute of Neurology, University College London, London, United Kingdom, 8Department of Radiology, Addenbrooke’s Hospital, Cambridge, United Kingdom
Synopsis
Manual segmentation of the kidneys is very time consuming and reader dependent, this renders measurements of total kidney volume (TKV) in large multi-site studies impractical. Here we use a convolutional neural network (CNN), trained on data from a single MRI vendor, to segment the kidneys of volunteers scanned with a harmonised FSE image protocol on MR scanners from three different vendors (GE, Philips and Siemens). The kidneys were manually segmented by two readers, both of which demonstrated a significant difference in TKV across vendors; no significant difference in TKV was found in the segmentations produced by the CNN.
Introduction
As clinical interest in renal MRI increases, so does the desire to perform research studies with large numbers of patients. This necessitates recruitment across multiple sites, often with different MR vendor scanners. Efforts have been made to standardise renal MRI acquisition1,2 and analysis3,4 across vendors, however these have focussed on quantitative renal MRI. Structural scans to enable segmentation of the kidneys and the associated analysis methods are a fundamental first step in processing pipelines but to-date have not been the focus of harmonisation efforts. Segmentations allow calculation of total kidney volume (TKV), currently the only FDA-recognised renal MRI biomarker5.Deep-learning-based approaches to automated segmentation are the most likely method to increase generalisability6. Previous work has shown excellent results segmenting the kidneys from T2-weighted Fast Spin Echo (FSE) images using a convolutional neural network (CNN) in both healthy controls and Chronic Kidney Disease subjects7, however this work was limited to a single site and single vendor. Here, the accuracy and precision of this network is evaluated using ‘travelling kidney’ data acquired on General Electric (GE), Philips, and Siemens platforms, to provide insight on whether a CNN trained with single vendor data can generalise to multi-vendor studies.
Methods
Data AcquisitionT2-weighted single-shot FSE images of four healthy volunteers (age 29±1 years) were acquired on 3T scanners of each vendor (GE, Siemens, and Philips; randomly labelled Vendor 1, 2 and 3). The acquisition was based on that previously used for automated CNN-segmentation7, with the field of view (FoV) and parallel imaging factor increased to allow for larger subject size. Parameters were harmonised across vendors (Voxel size 1.5x1.5x5mm3, 0.5 mm slice gap, FoV 384x384mm, 17 slices, TE 60ms, parallel imaging factor 3, ~17s breathhold).
Automated Data Processing
The automated processing pipeline is illustrated in Figure 1. The CNN implemented was trained on images with a FoV of 350x350mm7, thus the first pre-processing step cropped the input images to the same FoV. Image signal intensity values have a large variation between vendors, so normalisation was applied to rescale the voxel intensities between 0 and 255 based on the image volume’s mean and standard deviation. The CNN was then applied to the data with the mask output resampled to the original FoV. Finally, thresholding and post-processing mask clean-up steps were applied to remove all but the two largest mask regions, thus minimising isolated false positive regions such as miscategorised bowel regions. No data collected in this study was used to train the CNN; weights generated using a previously acquired single-vendor data set were used7.
Statistical Analysis
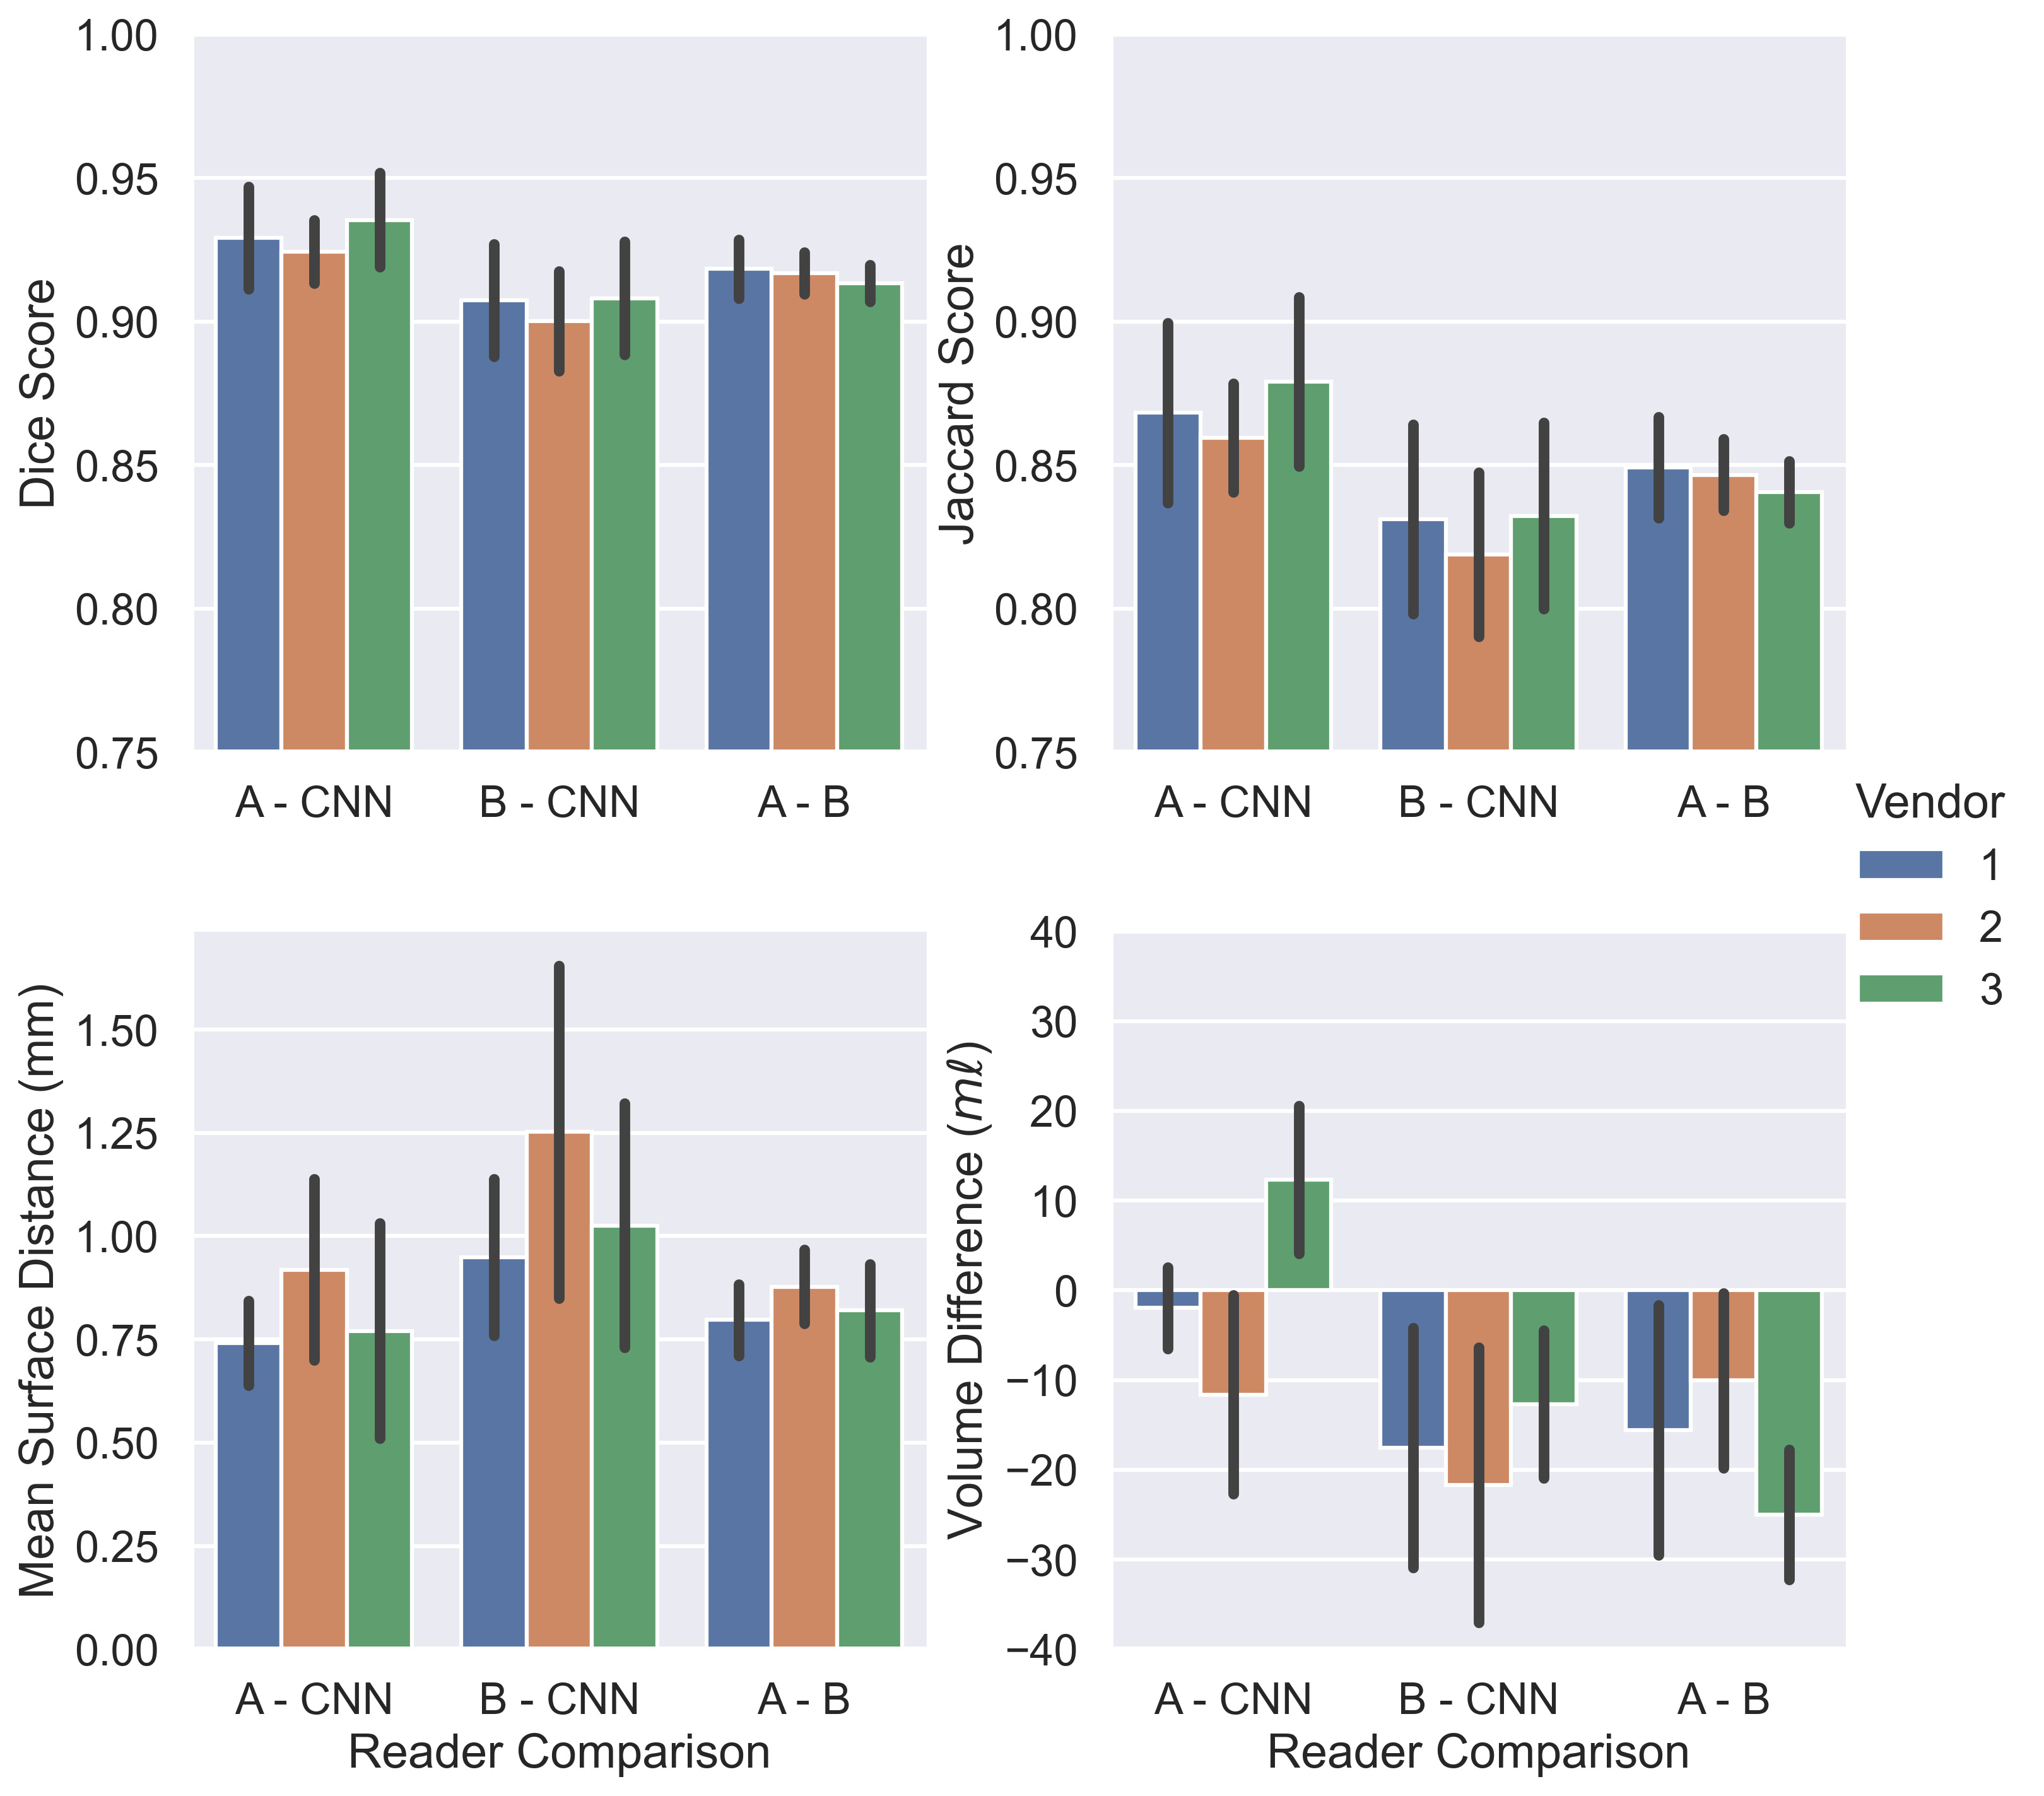
Each volume was segmented by two human readers (Reader A and B) to evaluate inter-reader variability compared to the CNN. The similarity of the masks generated by each reader was evaluated using voxel (Dice and Jaccard scores), surface (mean distance between the surfaces of the masks) and volume (TKV) based metrics. A repeated measurement analysis of variance (rmANOVA) was used to identify statistically significant differences in calculated volume across vendors for each reader. Additionally, the coefficient of variation (CoV) was calculated across vendors for each subject/reader combination.
Results
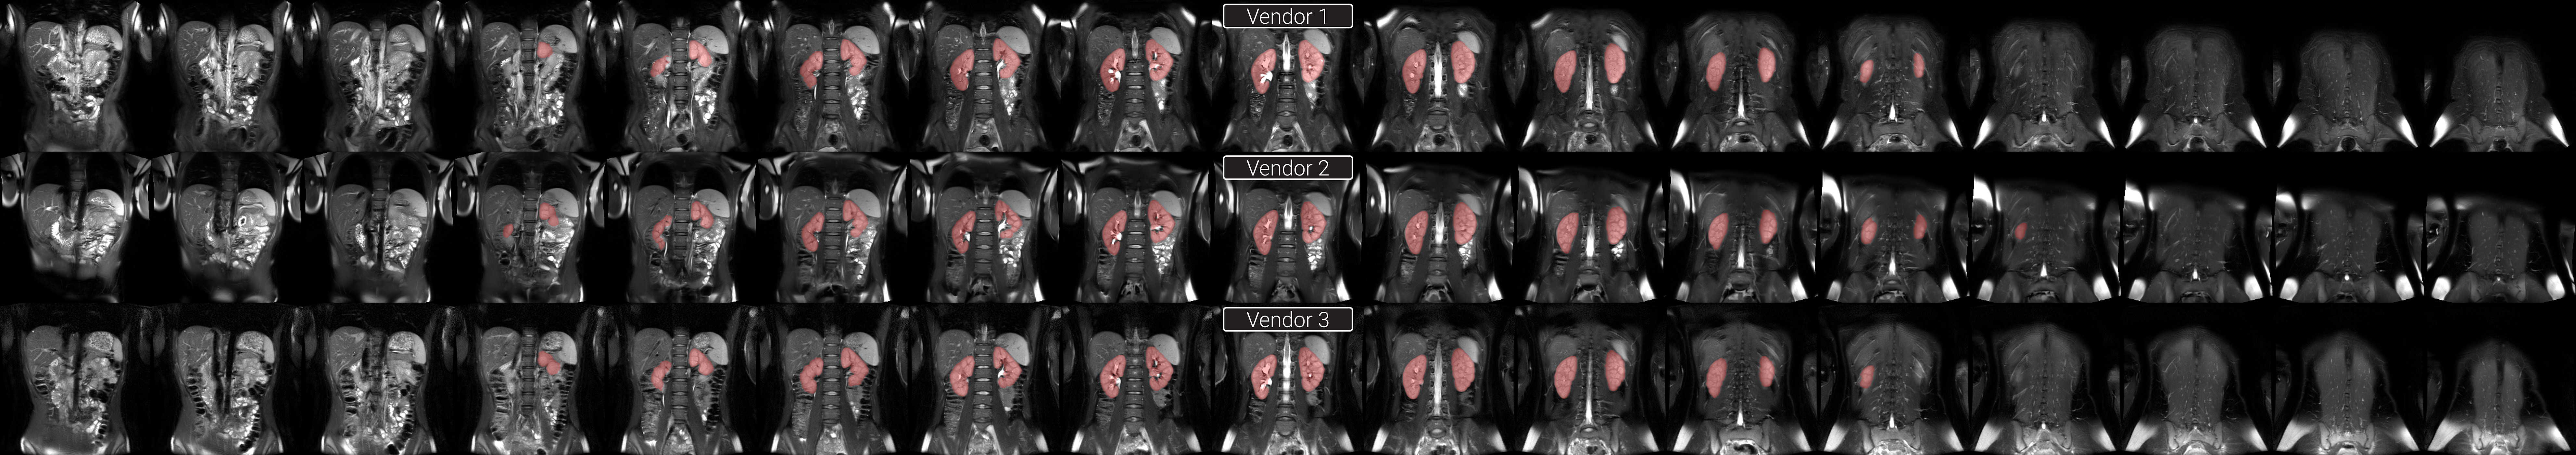
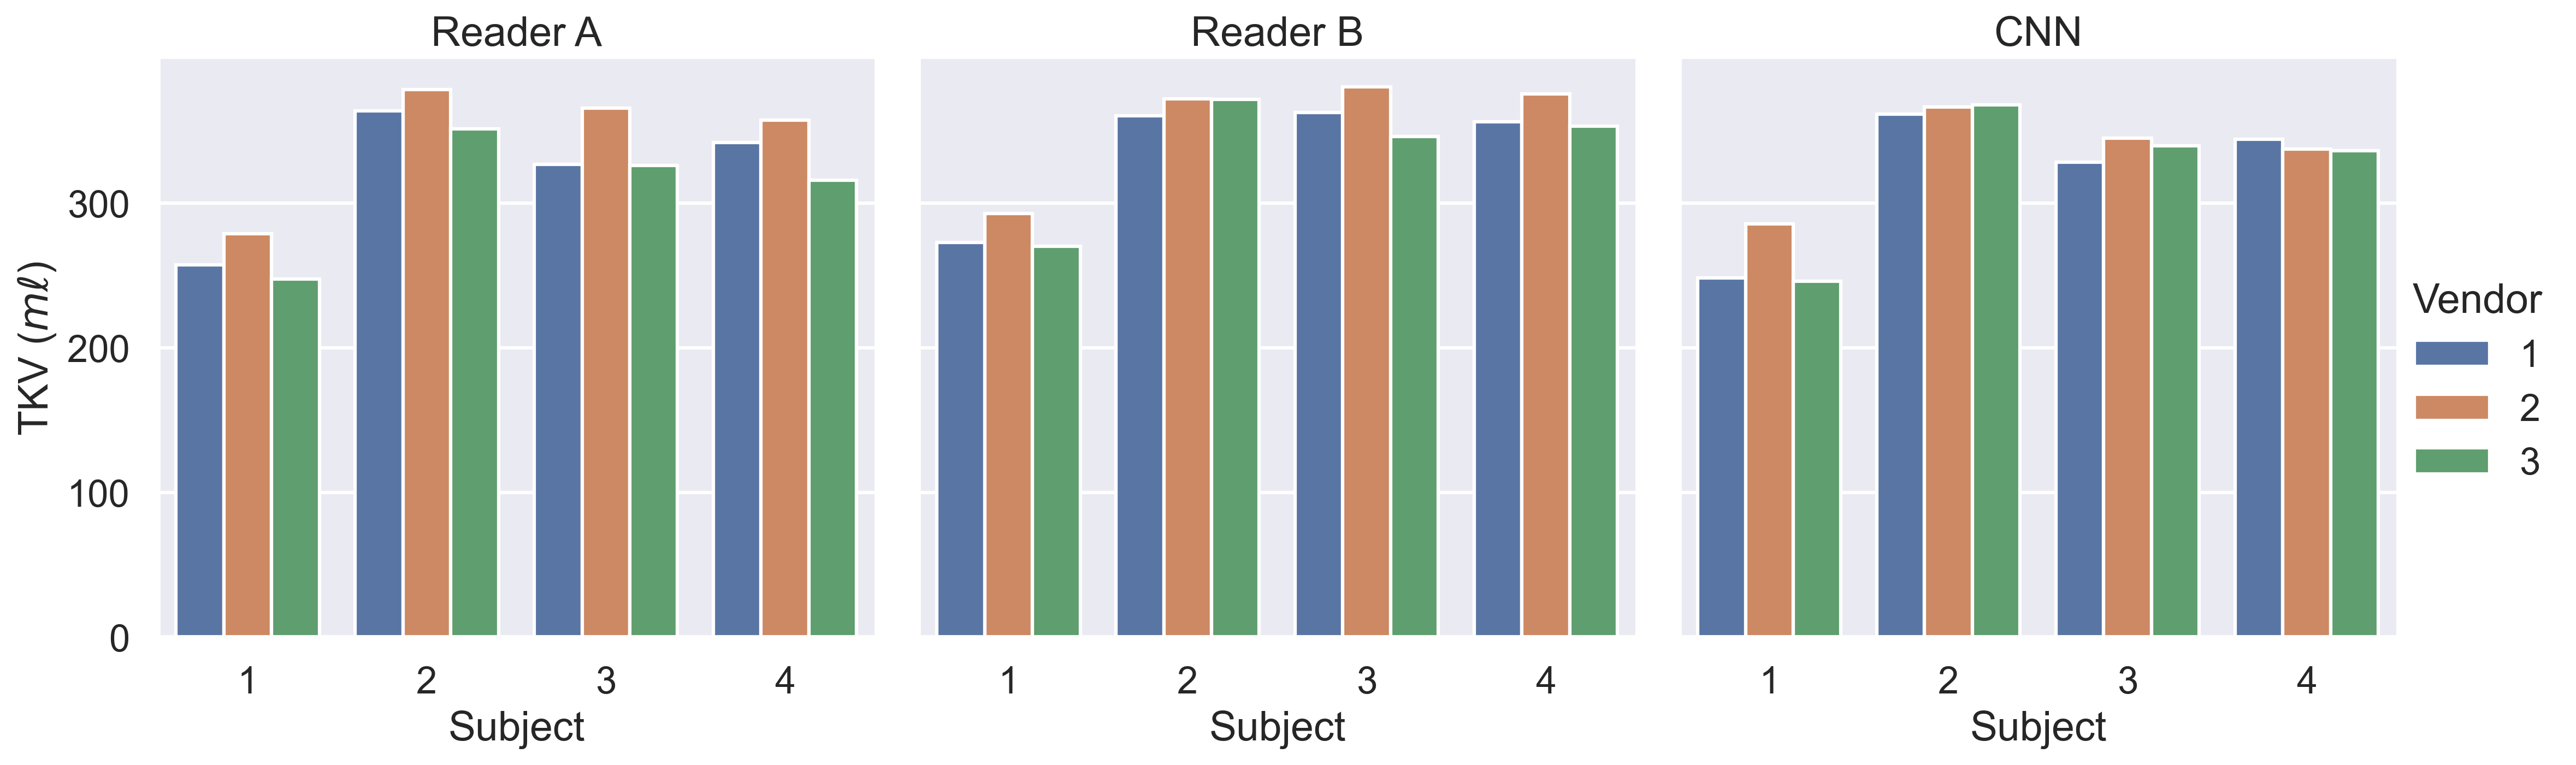
Example images are shown in Figure 2 following intensity normalisation. Qualitatively the images look very similar across vendors; excellent contrast is shown between the kidneys and surrounding tissue. Example masks produced for a single subject by the CNN on all three vendors are shown in Figure 3. Kidney volumes for each reader, subject and vendor are shown in Figure 4. The mean standard deviation in TKV measured for a given subject across vendors was 18ml for Reader A, 12ml for Reader B and 10ml for the CNN. No significant difference in TKV was reported when the CNN was used to segment images from each vendor (p=0.304), whereas both Readers A and B produced a significant difference in TKV between vendors (p=0.001 and p=0.020 respectively). None of the readers produced a significant difference in CoV across vendors (p=0.212). When assessing the similarity metrics for the masks produced by each reader, a high level of correspondence was observed both inter-reader and between the readers and CNN (Figure 5). No significant difference in segmentation accuracy across vendors were reported for any metric assessed.Discussion
Multi-vendor automated kidney segmentation provides a similar level of performance as previously reported single vendor work, with no systematic bias across vendors. When readers calculated TKV, a significant difference in TKV was reported across vendors. For the CNN, no significant difference was found while also showing sensitivity to TKV differences across the subjects, thus demonstrating the good generalisability of a CNN trained on data from a single vendor. Reader A was more concordant with the CNN than reader B. Further improvements may be achieved by applying bias field correction8 to further normalise the images by removing hardware-specific signal intensity gradients.Conclusion
A harmonised T2-weighted FSE sequence was used to automatically calculate TKV on GE, Philips and Siemens platforms. Data suggests automated methods should be employed for TKV measurement in multi-site multi-vendor studies, and this method will be used to process data from repeat measurements and in multi-centre clinical trials.The software used to segment images in this abstract is freely available at https://github.com/alexdaniel654/Renal_Segmentor9.
Acknowledgements
This work was supported by the UK Medical Research Council (MR/R02264X/1). We gratefully acknowledge the support of NVIDIA Corporation with the donation of the Titan Xp GPU used for this research.References
1. Buchanan, C. E. et al. Harmonisation of Multiparametric Renal MRI for Multi-Centre Studies. in Proc. Intl. Soc. Mag. Reson. Med. 29 vol. 29 0417 (2021).
2. Mendichovszky, I. et al. Technical recommendations for clinical translation of renal MRI: a consensus project of the Cooperation in Science and Technology Action PARENCHIMA. Magn. Reson. Mater. Phys. Biol. Med. 33, 131–140 (2020).
3. Daniel, A. J. et al. UKRIN Kidney Analysis Toolbox (UKAT): A Framework for Harmonized Quantitative Renal MRI Analysis. in Proc. Intl. Soc. Mag. Reson. Med. 29 vol. 29 3765 (2021).
4. Daniel, A. J., Nery, F., Sousa, J. & Buchanan, C. UKRIN Kidney Analysis Toolbox. (UKRIN-MAPS, 2021). doi:https://doi.org/10.5281/zenodo.4742470.
5. Qualification of Biomarker Total Kidney Volume in Studies for Treatment of Autosomal Dominant Polycystic Kidney Disease Draft Guidance for Industry. U.S. Food and Drug Administration https://www.fda.gov/regulatory-information/search-fda-guidance-documents/qualification-biomarker-total-kidney-volume-studies-treatment-autosomal-dominant-polycystic-kidney (2020).
6. Zöllner, F. G. et al. Kidney Segmentation in Renal Magnetic Resonance Imaging - Current Status and Prospects. IEEE Access 9, 71577–71605 (2021).
7. Daniel, A. J. et al. Automated renal segmentation in healthy and chronic kidney disease subjects using a convolutional neural network. Magn. Reson. Med. 86, 1125–1136 (2021).
8. Tustison, N. J. et al. N4ITK: Improved N3 Bias Correction. IEEE Trans. Med. Imaging 29, 1310–1320 (2010).
9. Daniel, A. J. alexdaniel654/Renal_Segmentor: v1.2.0. (University of Nottingham, 2021). doi:https://doi.org/10.5281/zenodo.4068850.
Figures
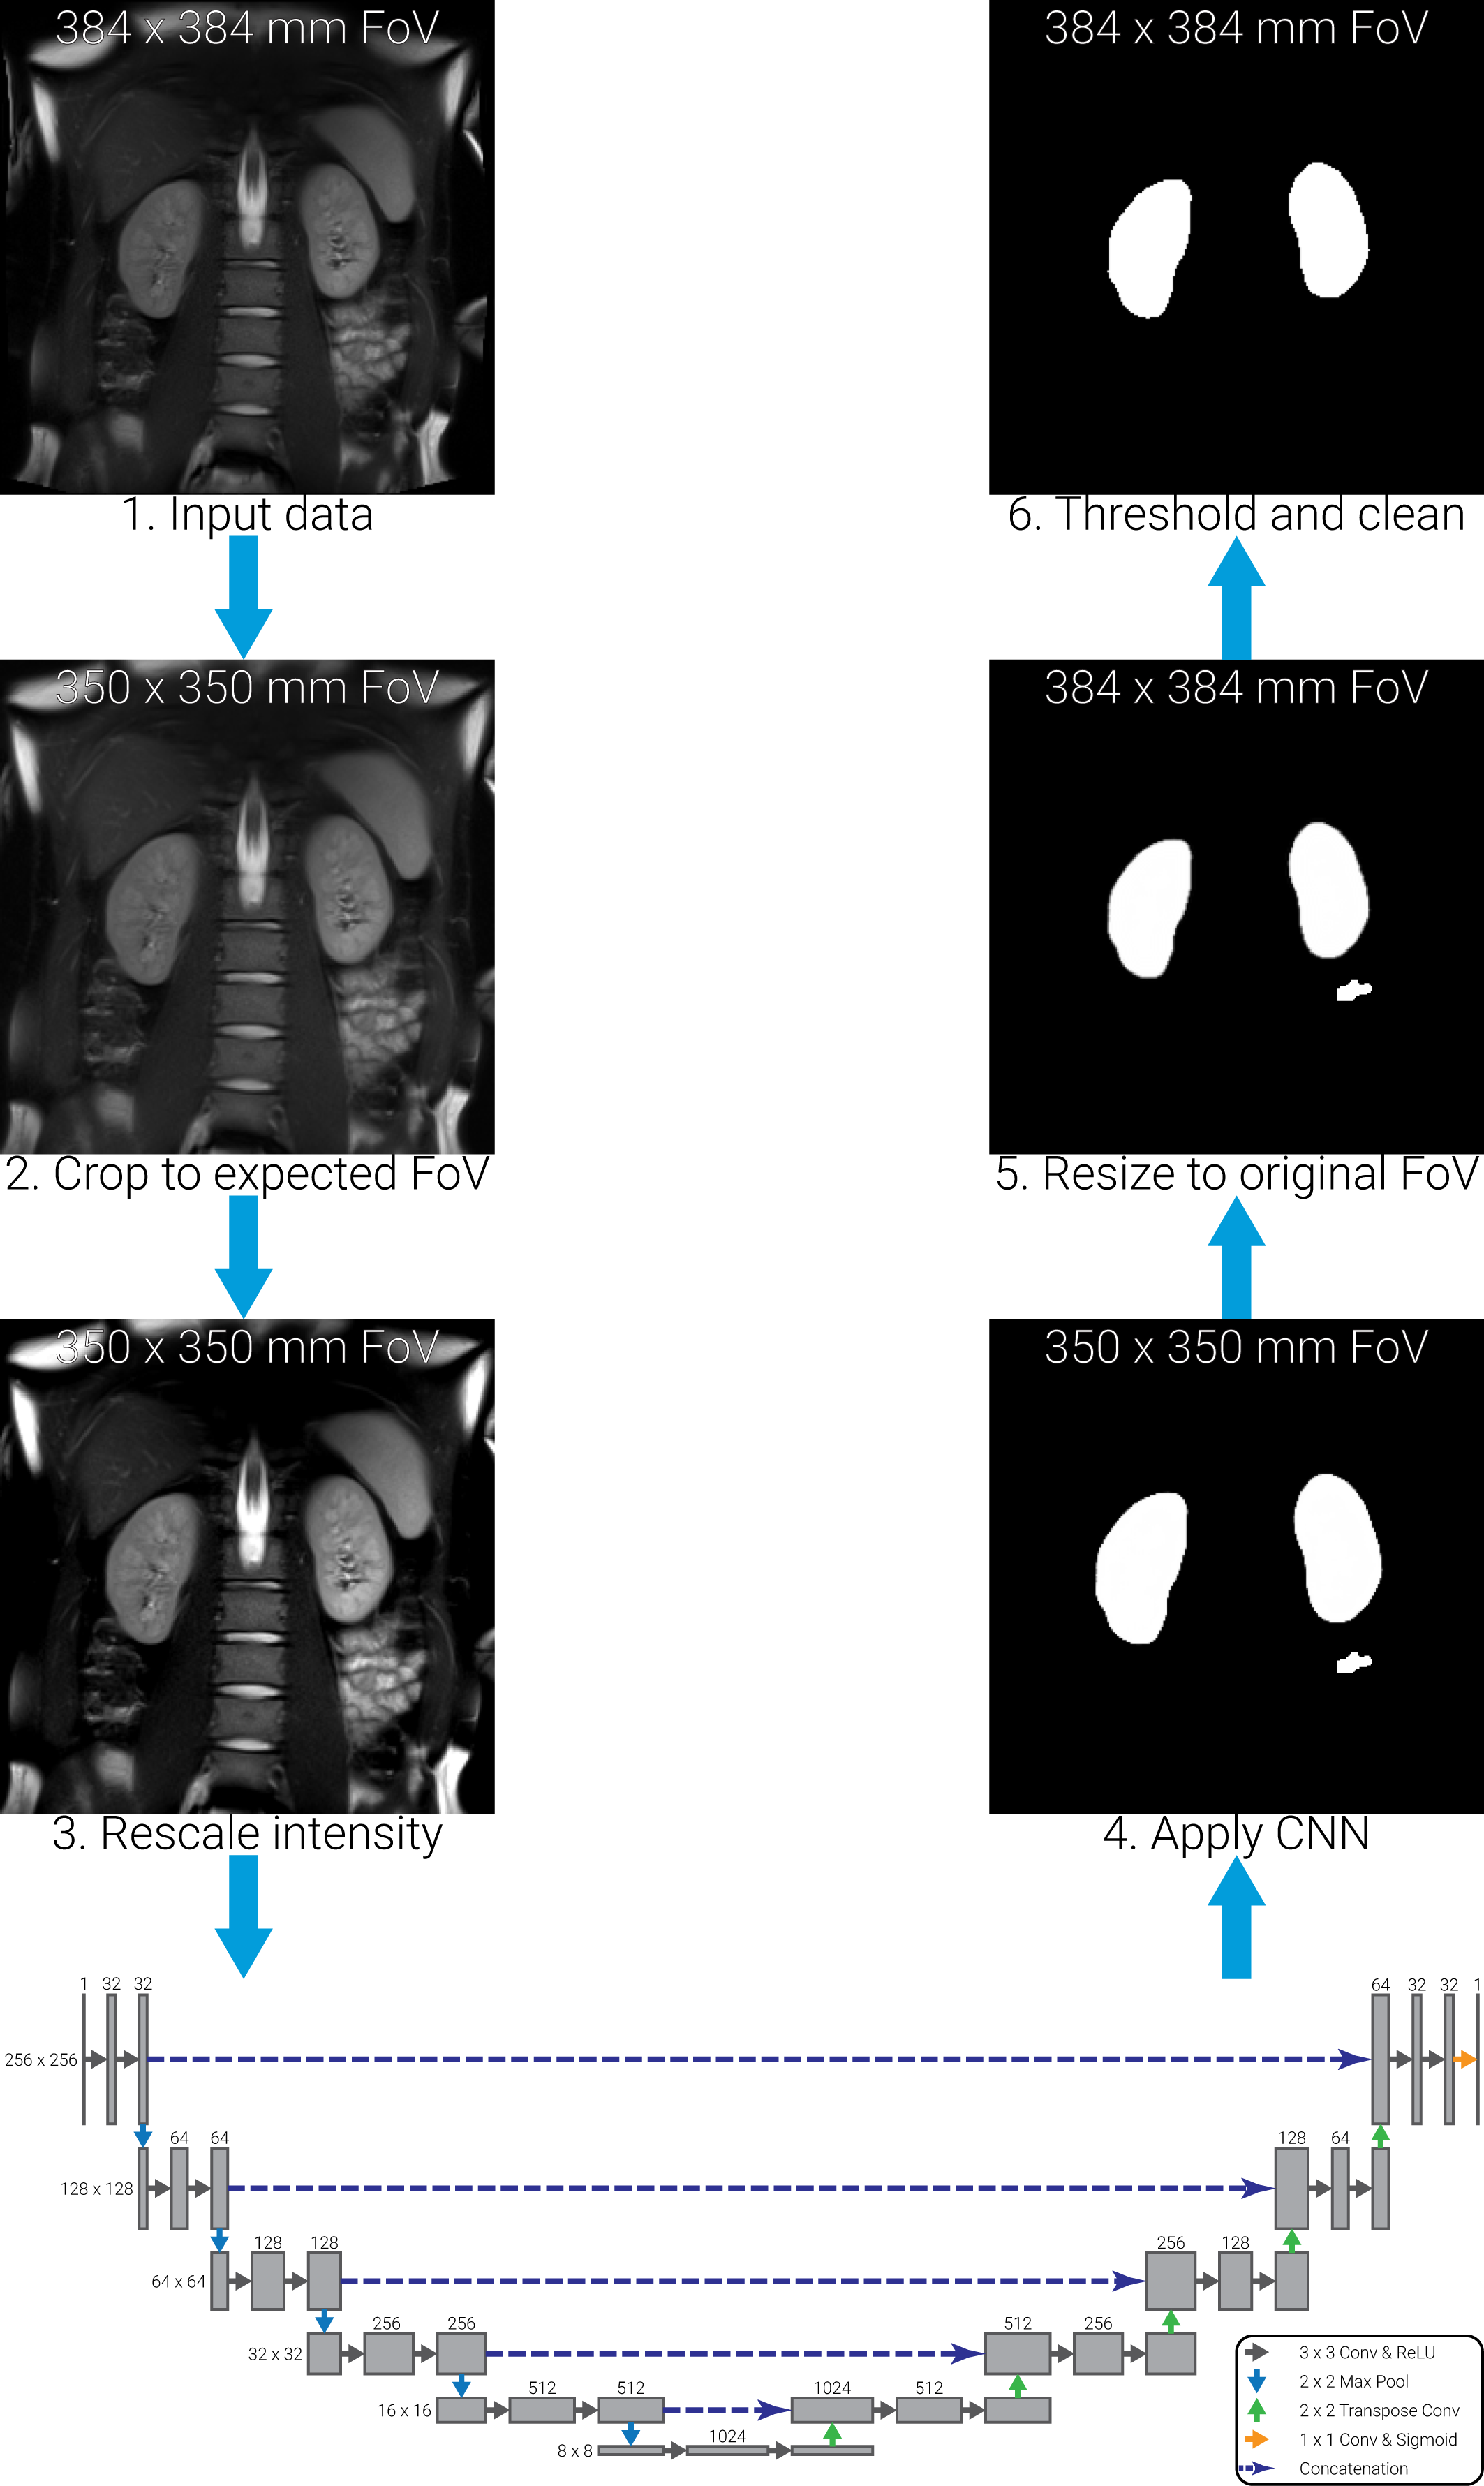
Figure 2: Example images from one subject acquired on three vendor scanners. Note: for illustrative purposes to match the slice, data from Vendor 1 and 3 have undergone a linear registration to the data from Vendor 2, resulting in blurring of Vendor 1 and 3 data sets. Images are windowed such that black is the mean voxel intensity minus half the standard deviation and white is the mean voxel intensity plus four times the standard deviation. This matches the intensity windowing used before processing by the CNN.