2146
Immediate changes in graph metrics following MRgFUS - an investigation using state-of-the-art diffusion image analysis1Brain and Mind Centre, The University of Sydney, Camperdown, Australia, 2Sydney Imaging, The University of Sydney, Camperdown, Australia, 3School of Biomedical Engineering, The University of Sydney, Camperdown, Australia, 4Sydney Neuroimaging Analysis Centre, Camperdown, Australia, 5St Vincent's Hospital Sydney, Sydney, Australia, 6GE Healthcare Australia, Melbourne, Australia, 7Department of Neurology, Royal Prince Alfred Hospital, Camperdown, Australia
Synopsis
MRgFUS (Magnetic Resonance guided focused ultrasound) is an emerging treatment for tremor. The neuroadaptations that accompany desirable clinical outcomes following treatment are not well understood. Diffusion imaging can non-invasively quantify the structural connectivity between brain regions and may help explain tremor suppression mechanisms. Here, advanced diffusion analysis techniques were used to construct structural connectomes before and immediately after MRgFUS treatment in 27 patients with tremor. Graph theory metrics were measured on baseline and follow-up connectomes and differences between sessions were investigated using paired t-tests. Network density, characteristic path length, global efficiency, degree and strength changed following surgery (p<0.05).
Introduction
MRgFUS (MR guided Focused Ultrasound) has recently been used to treat disabling tremor by creating a precise lesion usually located in the ventral intermediate nucleus (VIM). Given that MRgFUS treatment is relatively new, the neuroadaptations that occur after treatment are still being explored and are of interest as it may help guide treatment management, explain the underlying mechanisms of tremor suppression as well as contribute to our overall understanding of neurodegeneration.Diffusion weighted imaging (DWI), when combined with tractography and connectomics, can be used to quantify the structural connectivity between brain regions, and therefore serves as a powerful tool to study neuroadaptation. Information contained in structural connectomes can be analysed by using graph theory.
A recent study measured graph metrics in patients receiving MRgFUS and found a significant increase in global mean network degree 12-months after MRgFUS treatment1. A methodological limitation of that study is the use of tensor-based deterministic tractography, which is known to lead to unreliable tractograms2. Advances in diffusion analysis, such as the introduction of constrained-spherical-deconvolution and probabilistic tractography, overcome these limitations by modelling the effect of crossing fibres and noise.
Here, state-of-the-art diffusion analysis techniques were used to generate structural connectomes in patients with tremor receiving MRgFUS treatment, and graph measurements were used to investigate connectome changes immediately after treatment.
Methods
A convenience sample of 23 participants undergoing MRgFUS treatment for tremor were scanned using a 3-Tesla GE MRI scanner. DWI data were acquired 1-7 days prior to treatment (pre-treatment), and immediately after MRgFUS treatment (post-treatment). The image acquisition included a multi-shell diffusion sequence (b-values: 0, 700, 1000, 2800 s/mm2, with 8, 25, 40 and 75 directions, respectively, FOV: 230 mm, 1.8 mm isotropic resolution), a DWI image with reversed phase encoding to correct image distortion and a sagittal 3D T1-weighted anatomical images (TR: 8 ms, TE:3.2 ms, flip angle: 10° and resolution 1.2×0.5×0.5 mm).Image analysis
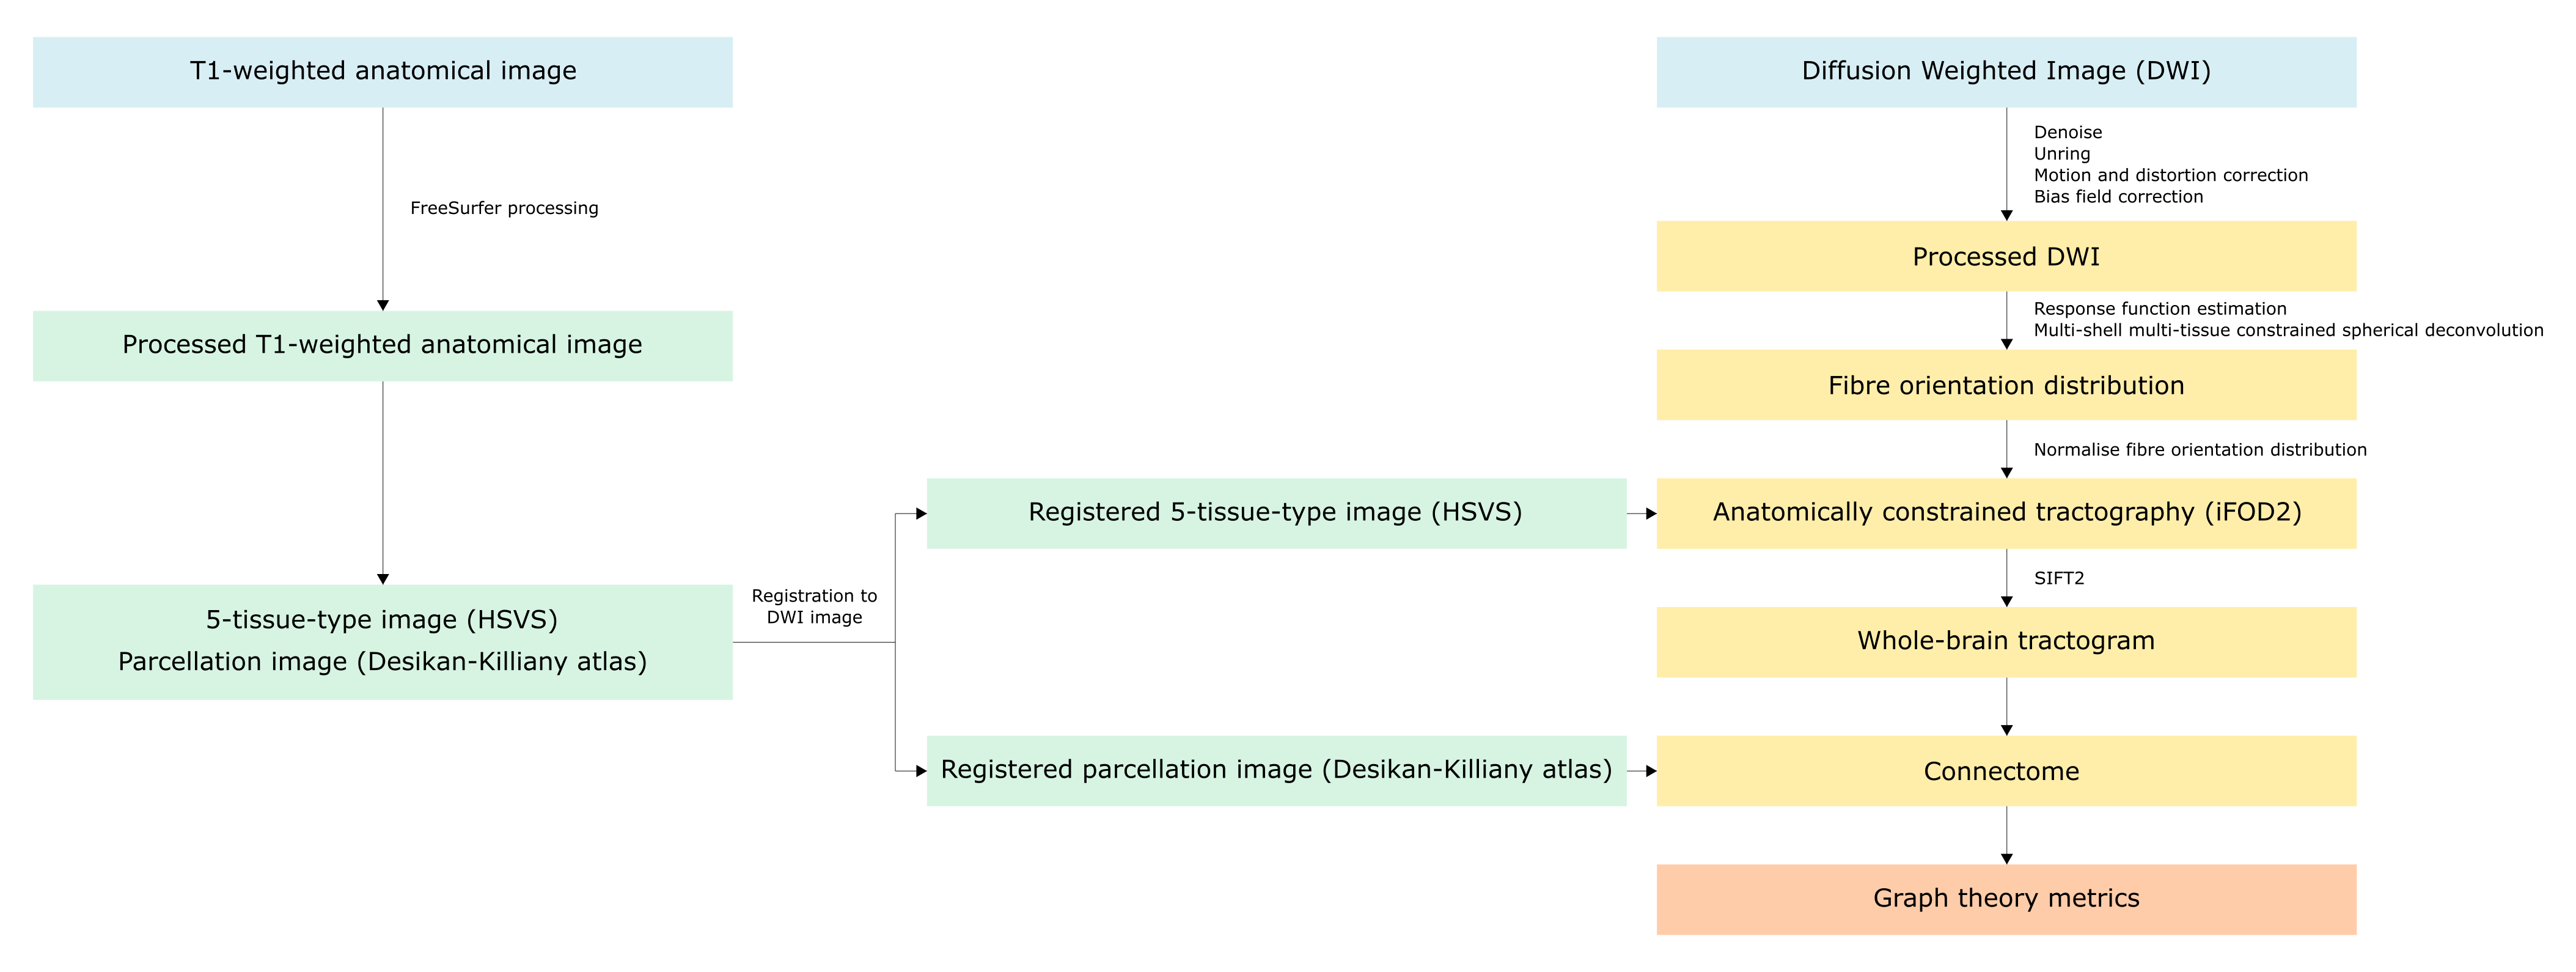
The image processing pipeline was conducted using MRtrix33,4 and is summarised in Figure 1. The following graph theory (weighted) metrics were measured from connectomes using the Brain Connectivity Toolbox5: density, transitivity, characteristic path length, global efficiency, mean degree, mean strength, mean betweenness centrality and mean clustering coefficient. Paired T-tests were used to determine whether graph metrics changed following MRgFUS treatment.
Results
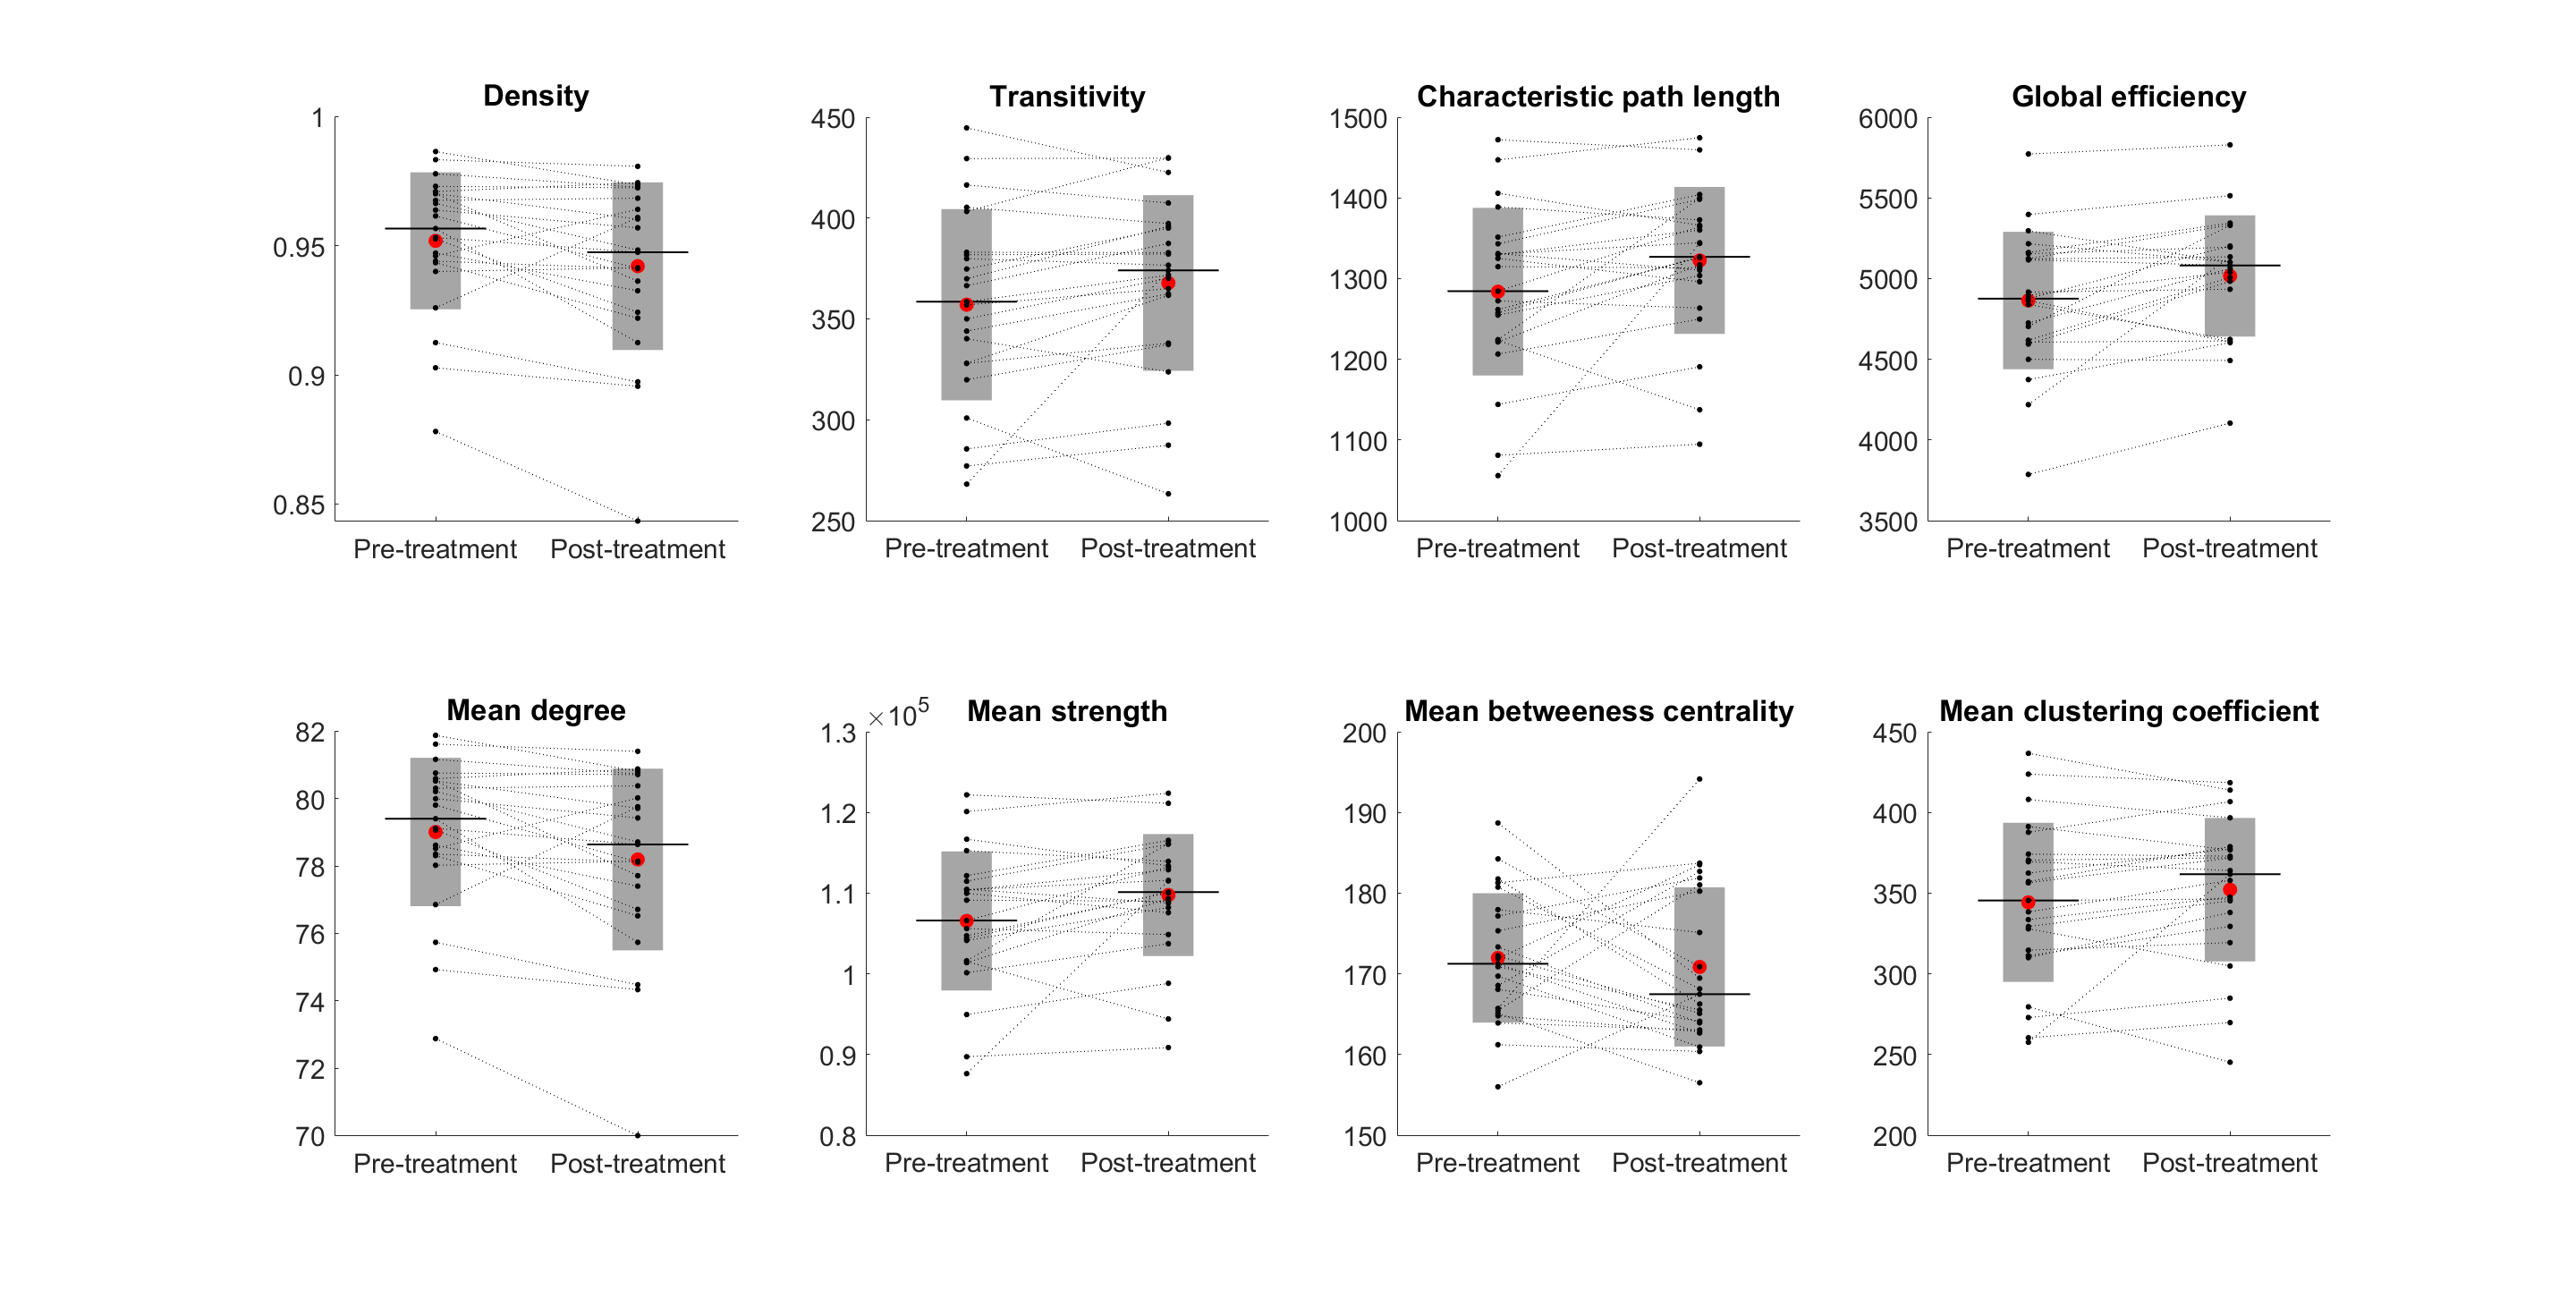
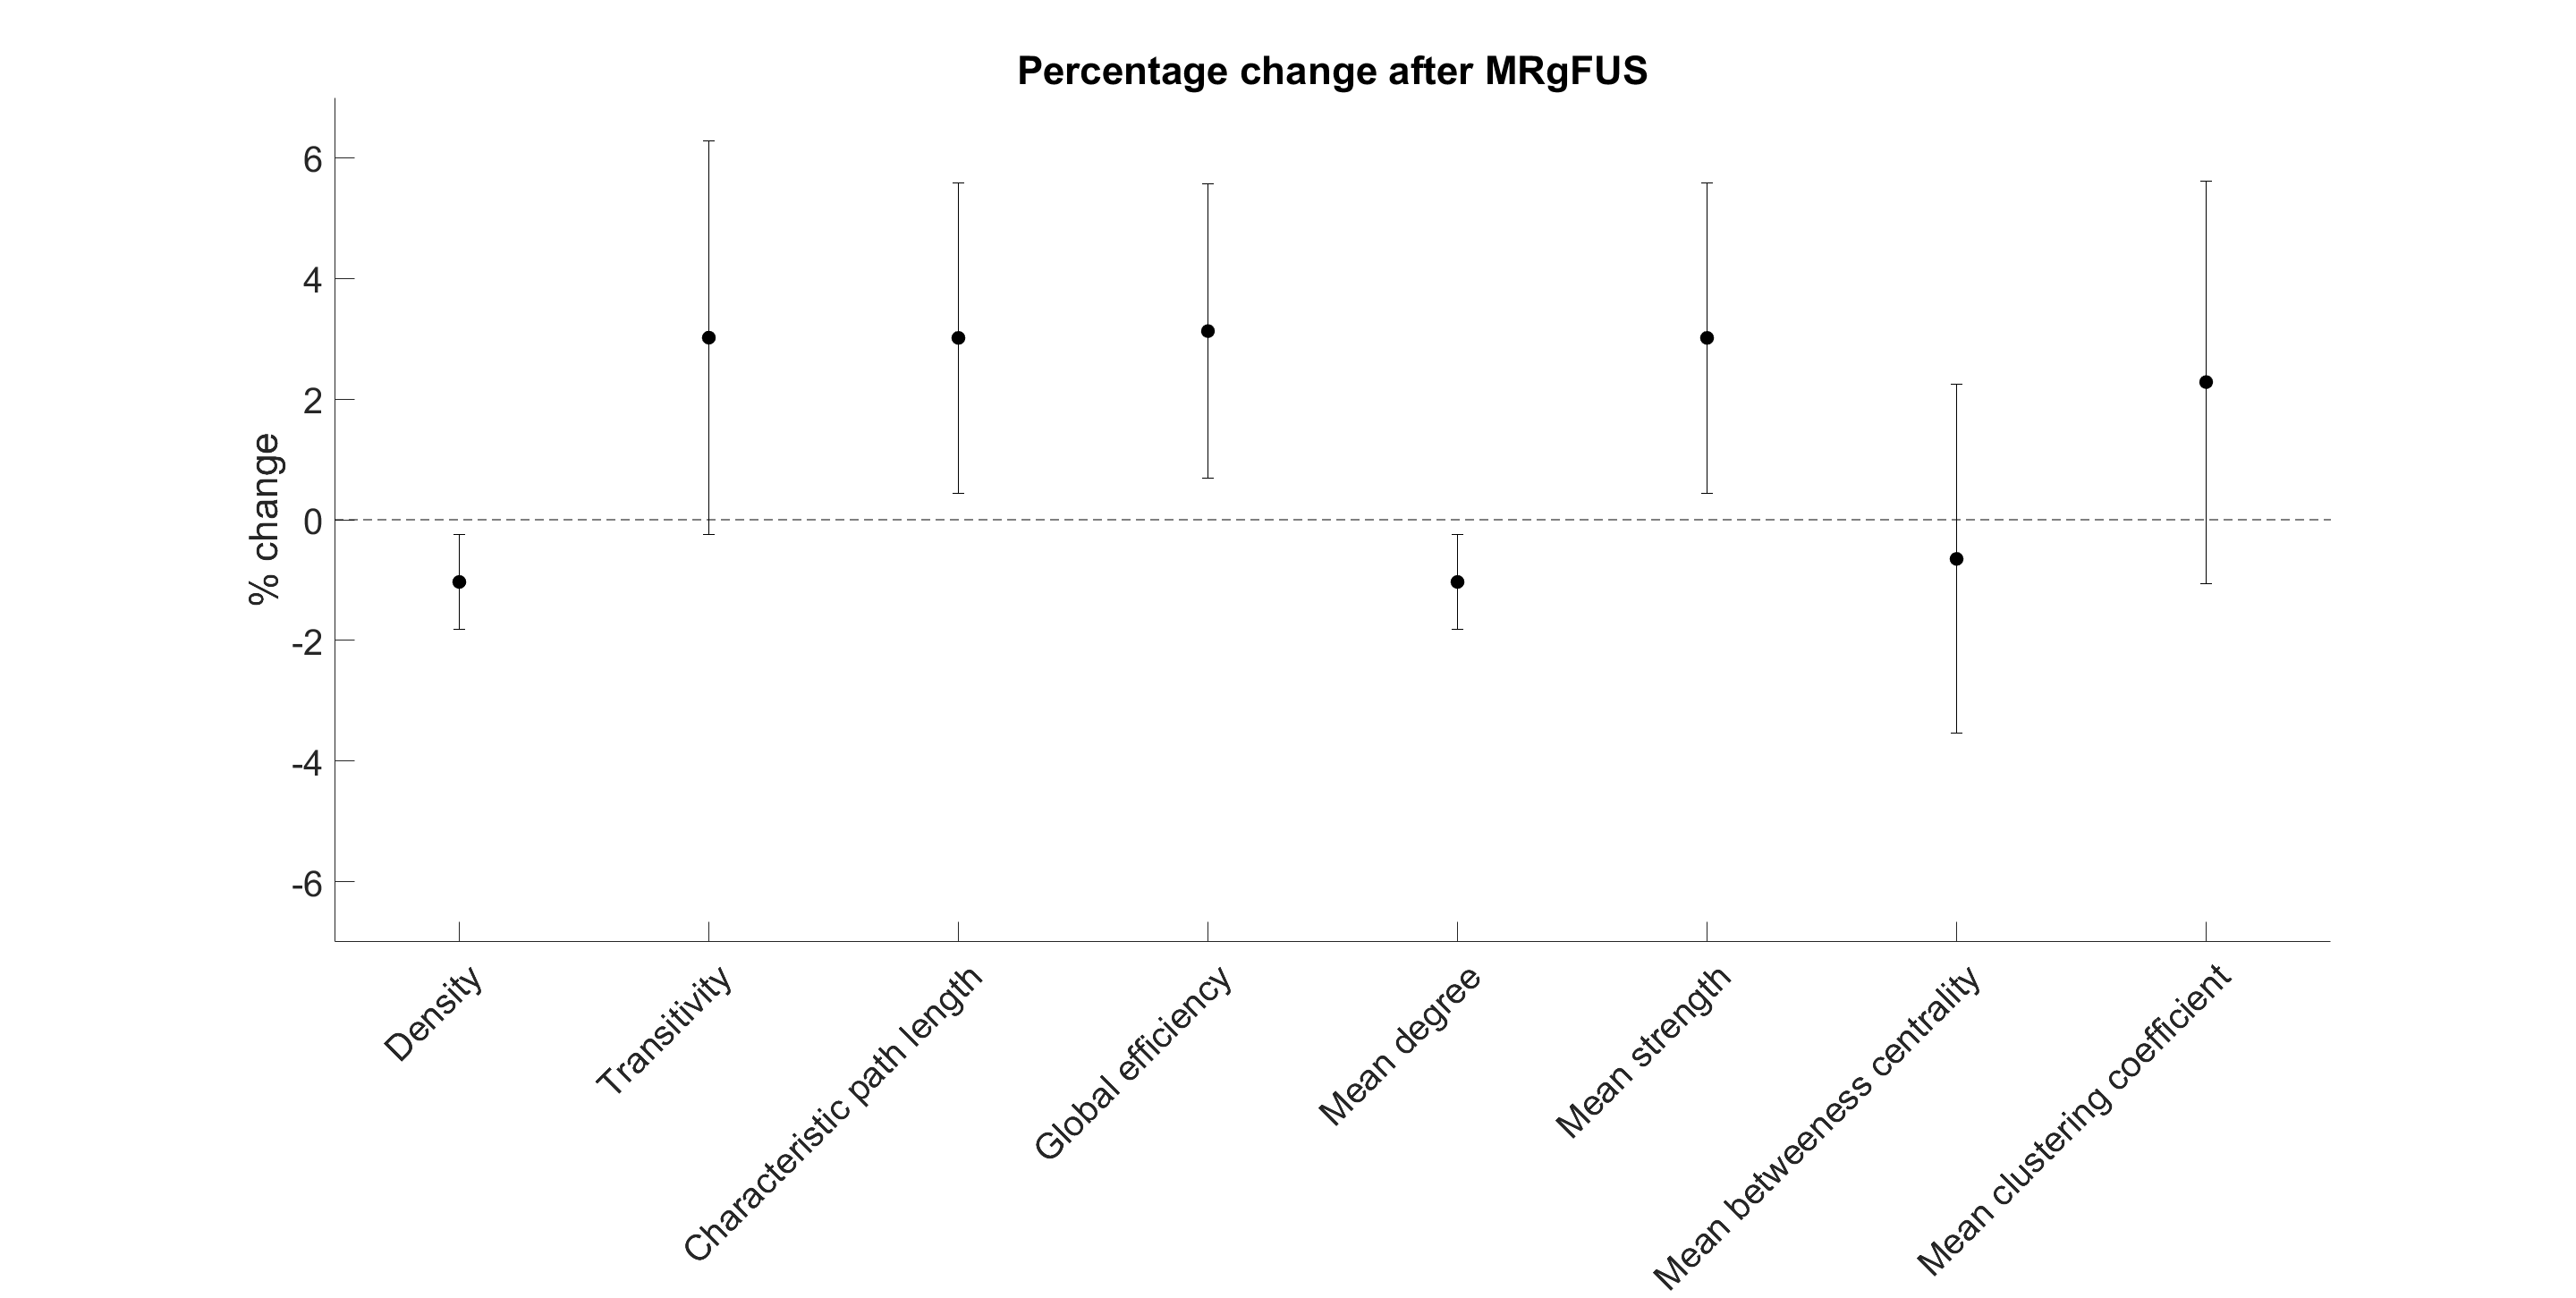
Immediately following MRgFUS treatment, on average, network density decreased by 1.03% (95%CI -0.25% to -1.81%, P=0.01), characteristic path length increased by 3.01% (0.44% to 5.59%, P=0.02), global efficiency increased by 3.13% (0.69% to 5.57% P=0.01), mean degree decreased by 1.03% (-0.25% to -1.81% P=0.01) and mean strength increased by 3.01% (0.44% to 5.59%, P=0.02) (Figure 2 and Figure 3). There were no differences in transitivity, betweenness centrality or mean clustering coefficient (P>0.05).Discussion
Advanced diffusion analysis techniques were used to generate structural connectomes in participants receiving MRgFUS treatment for tremor, and paired comparisons revealed several small yet statistically significant changes (ranging from ~1% to ~3%) in graph metrics immediately following MRgFUS.Immediately following MRgFUS, mean network degree decreased, indicating reduced total wiring strength and coherence in the connectome. This finding is not so surprising given that the MRgFUS treatment involves the precise and deliberate destruction of brain tissue. Network measures of integration (such as global efficiency) increased after treatment, indicating increased parallel information transfer within the connectome. The results reported here for global efficiency (which increased after treatment) as well as betweenness centrality and clustering coefficient (no change detected) are consistent with previous reports measured one month after surgery1. Conversely, the observed changes in degree (which decreased) and characteristic path length (which increased) are in the opposite direction to previous reports of later time point changes1. Transitivity has previously been reported to increase after treatment1 – here, no change in transitivity was detected.
The observed changes may relate to complete/partial destruction of VIM, which was lesioned in all participants. The VIM receives input from the cerebellum and plays a critical relay role in the cerebello-thalamo-cortical and striatal-thalamo-cortical circuits6. Given VIM’s key network role, it is not surprising that VIM ablation could result in immediate changes to global network measurements.
It is also possible that the observed changes are transient, potentially resulting from oedema after the ablation. Given that neurodegeneration of axons typically takes days7, it should be expected that changes in graph metrics resulting from brain remodelling would follow a similar timeframe. Observations of transient phenomena may explain why the changes in transitivity, network degree and characteristic path length reported here differ to previous reports. Our plan to add additional time points to the analysis should confirm whether the observations are transient.
Conclusion
MRgFUS treatment appears to have a small yet statistically significant effect on several graph metrics. Further work is required to confirm whether there are immediate neuroadaptations, or whether the observed changes are transient.Acknowledgements
The authors acknowledge the funding and expertise provided by GE Healthcare Australia, and the assistance provided by the team at St Vincent's Hospital Sydney.References
1. Lin J, Kang X, Xiong Y, et al. Convergent structural network and gene signatures for MRgFUS thalamotomy in patients with Parkinson's disease. NeuroImage. 2021;243:118550.
2. Calamante F. The Seven Deadly Sins of Measuring Brain Structural Connectivity Using Diffusion MRI Streamlines Fibre-Tracking. Diagnostics (Basel, Switzerland). 2019;9(3):115.
3. Tournier J-D, Smith R, Raffelt D, et al. MRtrix3: A fast, flexible and open software framework for medical image processing and visualisation. NeuroImage. 2019;202:116137.
4. Tournier J-D, Calamante F, Connelly A. MRtrix: Diffusion tractography in crossing fiber regions. International Journal of Imaging Systems and Technology. 2012;22(1):53-66.
5. Rubinov M, Sporns O. Complex network measures of brain connectivity: uses and interpretations. NeuroImage. 2010;52(3):1059-1069.
6. Zeng Q, Guan X, Guo T, et al. The ventral Intermediate nucleus differently modulates subtype-related networks in Parkinson’s disease. 2019;13:202.
7. Canty AJ, Jackson JS, Huang L, et al. In vivo imaging of injured cortical axons reveals a rapid onset form of Wallerian degeneration. BMC Biology. 2020;18(1):170.
8. Jeurissen B, Tournier J-D, Dhollander T, Connelly A, Sijbers J. Multi-tissue constrained spherical deconvolution for improved analysis of multi-shell diffusion MRI data. NeuroImage. 2014;103:411-426.
9. Tournier JD, Calamante F, Connelly A. Improved probabilistic streamlines tractography by 2nd order integration over fibre orientation distributions. Paper presented at: Proceedings of the international society for magnetic resonance in medicine2010.
10. Smith R, Skoch A, Bajada CJ, Caspers S, Connelly A. Hybrid surface-volume segmentation for improved anatomically-constrained tractography. 2020.
11. Smith RE, Tournier J-D, Calamante F, Connelly A. SIFT2: Enabling dense quantitative assessment of brain white matter connectivity using streamlines tractography. NeuroImage. 2015;119:338-351.
12. Desikan RS, Ségonne F, Fischl B, et al. An automated labeling system for subdividing the human cerebral cortex on MRI scans into gyral based regions of interest. NeuroImage. 2006;31(3):968-980.
Figures