2136
Development of an Efficient MRE/MRI Protocol for Multiparametric Assessment of Liver, Spleen, and Kidneys to Diagnose Hepatorenal Syndrome1Radiology, Mayo Clinic, Rochester, MN, United States, 2Gastroenterology, Mayo Clinic, Rochester, MN, United States, 3Mayo Clinic, Rochester, MN, United States
Synopsis
An efficient imaging protocol was developed to facilitate diagnosis of hepatorenal syndrome in patients with decompensated cirrhosis. Multiparametric MRI for quantifying perfusion, diffusion, and blood oxygenation, as well as multiparametric MRE for quantifying viscoelasticity and tissue pressure were optimized in preparation for the pilot study predicting hepatorenal syndrome. Results demonstrate the feasibility of the multiparametric protocol and provide motivation for commencing clinical testing.
Synopsis
An efficient imaging protocol was developed to facilitate diagnosis of hepatorenal syndrome in patients with decompensated cirrhosis. Multiparametric MRI for quantifying perfusion, diffusion, and blood oxygenation, as well as multiparametric MRE for quantifying viscoelasticity and tissue pressure were optimized in preparation for the pilot study predicting hepatorenal syndrome. Results demonstrate the feasibility of the multiparametric protocol and provide motivation for commencing clinical testing.Introduction
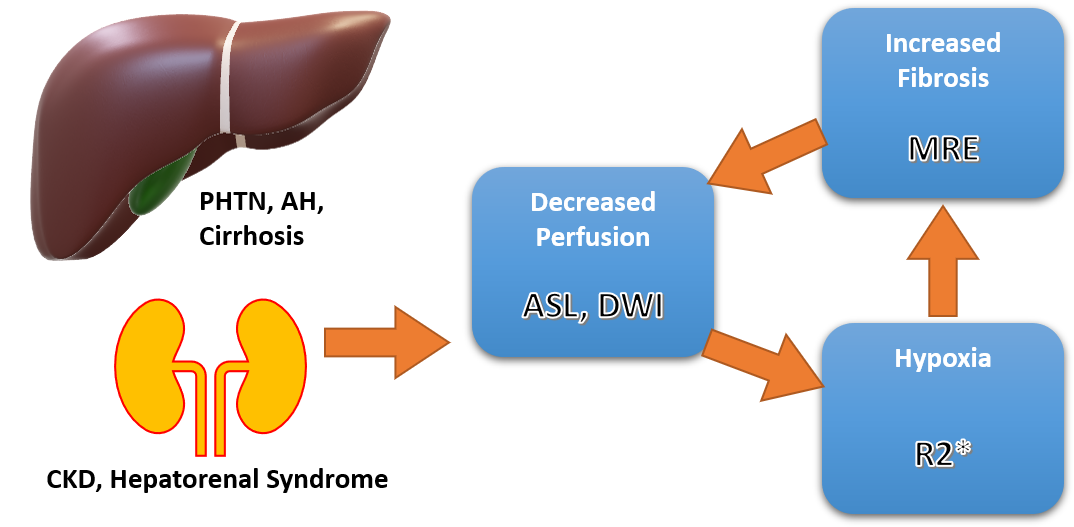
Hepatorenal syndrome (HRS) is a collection of severe complications due to the progression of hepatic cirrhosis. Mortality of this syndrome is high, with approximately 61% of cirrhotic patients dying from acute kidney injury (AKI) in the US within the last two decades1. In HRS, elevated sinusoidal resistance and augmented portal pressure leads to extreme underfilling of the arteries in splanchnic circulation2,3. As a response to the underfilling, the liver, spleen and other abdominal organs begin locally producing vasodilators to increase blood flow. Moreover, the prolonged vasodilating signals a homeostatic response to produce vasoconstrictors in the kidneys, leading to chronic kidney disease (CKD). Injury to the kidneys is only functional and not structural, thus a liver transplant can reverse the likelihood of perishing. However, clinical criteria for diagnosing HRS cannot differentiate between this etiology of CKD and others, decreasing the time necessary for transplantation. To differentiate HRS from other forms of CKD, a set of imaging biomarkers is proposed here to assess fibrosis in the liver, portal hypertension in the spleen, perfusion, and hypoxia in the kidneys (Figure 1). Viscoelasticity measures of MRE4, hemodynamic (arterial spin labeling, ASL)5,6, blood oxygenation (R2*), and diffusion (diffusion-weighted imaging, DWI) measures of MRI will be combined into a predictive model to predict future kidney injuries and clinical outcomes. (future kidney function decline).Methods
All activities related to human subjects were reviewed by Mayo Clinic’s institutional review board. Patients with cirrhosis and suspected CKD who are on the liver transplantation waitlist will be recruited. Subjects will be imaged on a SIGNA Premier 3.0 T scanner (GE Healthcare, Chicago IL) with a 30-channel-receive Air coil and transmit body coil. Unless explicitly stated, all images were acquired end-expiration to minimize respiration-related artifacts. Liver, spleen, and kidneys were targeted in the imaging sessions.- · MRE Experiments: Single (90Hz) and dual frequency (composite 60/120Hz) vibrations were driven to the organs of interest. Liver and spleen were assessed using an axial 3D spin-echo Echo Planar Imaging (EPI) sequence with motion encoding gradients along three orthogonal directions (±x, ±y, ±z). Kidneys, in addition to a coronal 3D spin-echo EPI, were also imaged with the TURBINE EPI sequence to allow for 3D free-breathing acquisitions7. Viscoelastic properties were calculated after applying the direct inversion method.
- · MRI Experiments: Coronal 2D prescriptions of the kidneys were taken with each sequence. Pseudo-continuous ASL (pCASL) acquisition was by a single slice, single-shot fast spin-echo (SSFSE) sequence with FOV=38 cm2, bandwidth=20.83 Hz/pix, and TR/TE=6 s/9 ms. Blood oxygenation was estimated using a gradient-echo Blood Oxygen Level Dependent (BOLD) sequence with 5 slices, FOV=50 cm2, bandwidth=31.25 Hz/pix, and TR/TE=90 ms/3 ms. Water diffusion through kidneys was captured using a spin-echo EPI sequence with b=100, 200, and 800, 23 slices, FOV=40 cm2.
Results
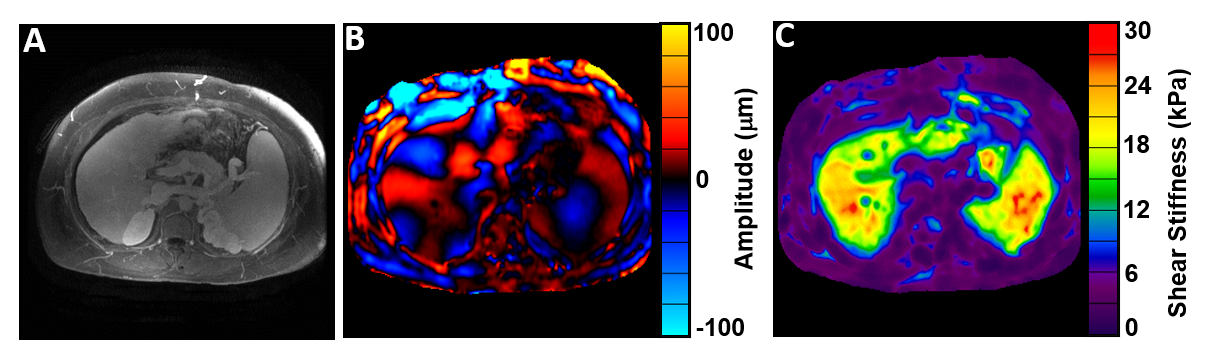
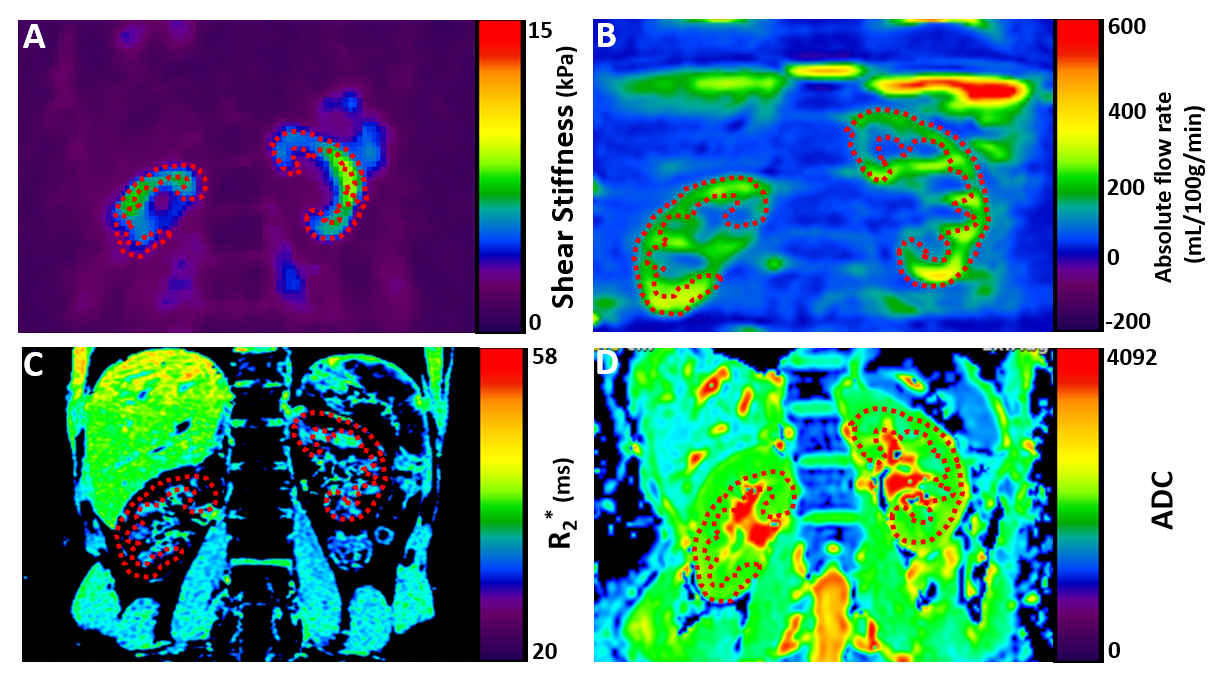
Figure 2 below shows an example of the MRE wave propagating through the liver, spleen, and kidneys. An example of the MRI biomarkers is shown in Figure 3 below. These were taken from volunteers as we optimized the imaging parameters.Discussion
Of the non-invasive methods being researched, imaging biomarkers show the most promise. MRE has shown high sensitivity and specificity in detecting hepatic fibrosis (liver stiffness) and portal hypertension (spleen stiffness) while applications in the kidneys reflect the same effectiveness. Warner et al. showed that kidney stiffness is modulated by lessened perfusion – as detected by MRE – and results in fibrosis, confirmed histologically4. This finding is of import in HRS because of the progressive decrease in blood flow due to the extreme vasoconstriction, signifying that MRE is sensitive to changes in liver stiffness. Hypoxia associated with decreased blood flow can be detected with R2* measures8. Additionally, the water retention by the kidneys in HRS may be detected by apparent diffusivity coefficient measure. Given the varying etiologies of CKD, it would be better to focus on the unique characteristics of HRS when diagnosing. In terms of technical development, inaccuracy of stiffness measures at the boundary of the kidney cortex and medulla needs to be addressed. We have observed in previous work on the kidneys that at the cortex-medulla boundary, the loss modulus could oscillate from positives to negatives, stemming from the violated assumption of local homogeneity of direct inversion algorithm in these regions9. The use of artificial neural networks in the estimation of MRE stiffness measures has been applied in the brain, where similar structural differences are seen in the grey and white matter10. We plan on including an artificial neural network framework to better the estimation of our stiffness measures for this study.Acknowledgements
We’d like to thank Mayo Clinic’s Center for Individualized Medicine for the Imaging Biomarker Award which funds this work.References
1 Desai, A. P. et al. Changing epidemiology and outcomes of acute kidney injury in hospitalized patients with cirrhosis - a US population-based study. J Hepatol 73, 1092-1099, doi:10.1016/j.jhep.2020.04.043 (2020).
2 Acevedo, J. G. & Cramp, M. E. Hepatorenal syndrome: Update on diagnosis and therapy. World J Hepatol 9, 293-299, doi:10.4254/wjh.v9.i6.293 (2017).
3 Ng, C. K., Chan, M. H., Tai, M. H. & Lam, C. W. Hepatorenal syndrome. Clin Biochem Rev 28, 11-17 (2007).
4 Warner, L. et al. Noninvasive In vivo assessment of renal tissue elasticity during graded renal ischemia using MR elastography. Invest Radiol 46, 509-514, doi:10.1097/RLI.0b013e3182183a95 (2011).
5 Pedrosa, I. et al. Arterial spin labeling MR imaging for characterisation of renal masses in patients with impaired renal function: initial experience. Eur Radiol 22, 484-492, doi:10.1007/s00330-011-2250-z (2012).
6 Taso, M., Guidon, A. & Alsop, D. C. Influence of background suppression and retrospective realignment on free-breathing renal perfusion measurement using pseudo-continuous ASL. Magn Reson Med 81, 2439-2449, doi:10.1002/mrm.27575 (2019).
7 Sui, Y. et al. TURBINE-MRE: A 3D hybrid radial-Cartesian EPI acquisition for MR elastography. Magnetic Resonance in Medicine 85, 945-952 (2021).
8 Zhang, J. et al. Can R2’ mapping evaluate hypoxia in renal ischemia reperfusion injury quantitatively? An experimental study. Magnetic Resonance in Medicine 86, 974-983, doi:https://doi.org/10.1002/mrm.28696 (2021).
9 Murphy, M. C. et al. Artificial neural networks for stiffness estimation in magnetic resonance elastography. Magnetic Resonance in Medicine 80, 351-360, doi:https://doi.org/10.1002/mrm.27019 (2018).
10 Scott, J. M. et al. Artificial neural networks for magnetic resonance elastography stiffness estimation in inhomogeneous materials. Medical Image Analysis 63, 101710, doi:https://doi.org/10.1016/j.media.2020.101710 (2020).
Figures