2131
The Subcutaneous Thickness Fraction: A new quantitative imaging metric that correlates with Lymphedema Stage.1Stanford University, Stanford, CA, United States
Synopsis
Given the dearth of quantitative metrics for staging lymphedema, we assessed subcutaneous and muscle tissue imaging metrics for patients with lower extremity lymphedema. Subcutaneous and muscle tissue thickness, subcutaneous thickness fraction (subcutaneous /sum of subcutaneous and muscle tissue thickness), and subcutaneous area fraction (subcutaneous / sum of subcutaneous and muscle tissue area) were measured. Leg subcutaneous measures strongly and significantly correlated with International Society of Lymphology lymphedema stage, while thigh subcutaneous measures demonstrated a trend to moderate correlation with stage. As lymphedema typically progresses from the distal to proximal extremity, the greater correlation with the leg is expected.
Introduction
The lymphatic system transports interstitial fluid, lymphocytes, cellular debris, and proteins, from peripheral tissues back into the blood circulation. Lymphedema occurs when this transport function fails and can be primary (congenital) or secondary (traumatic, iatrogenic) in origin. Lymphedema is clinically staged into four categories based on the International Society of Lymphology.1 The failure to diagnose and manage lymphedema can result in major adverse clinical outcomes such as progression of disease, loss of mobility, and hospital admission for cellulitis.2Total limb volume is a commonly used clinical metric for lymphedema, but this metric provides limited information about the subcutaneous compartment compared to the muscular compartments. Subcutaneous tissue thickness has been shown to correlate with lymphedema in the upper extremity of patients with breast cancer related lymphedema.3 Liposuction for breast cancer related lymphedema has been associated with decreased muscle volume potentially due to decreased load on the arm musculature.4 However, our understanding of the effects of lymphedema on the subcutaneous compartment compared to the muscular compared is limited. As new therapeutics for lymphedema are developed advanced imaging metrics are needed.5
In this study we assessed the subcutaneous and muscle tissue characteristics of the lower extremities in patients with lower extremity lymphedema. The goal was to record simple and replicable measurements that could be performed by a radiologist during regular clinical workflow.
Methods
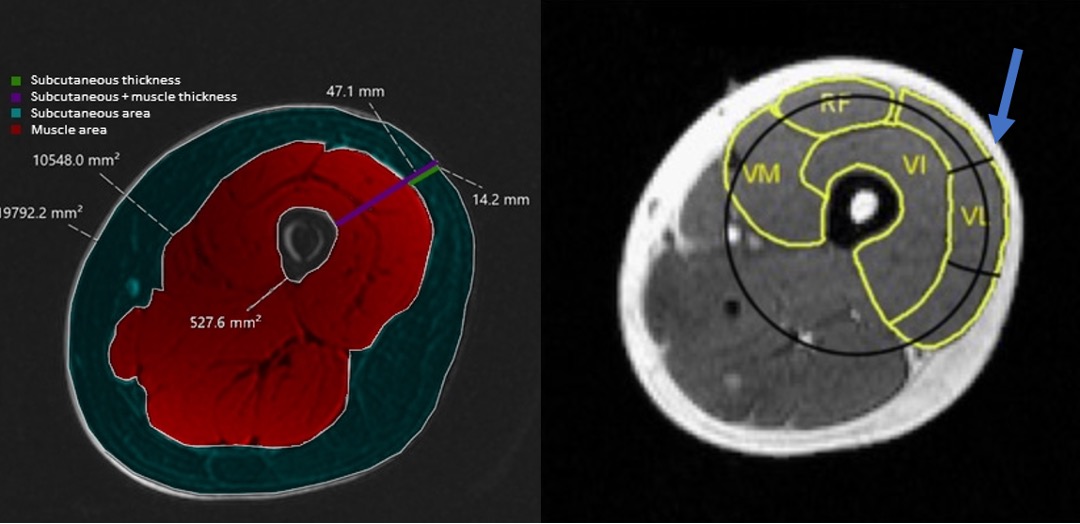
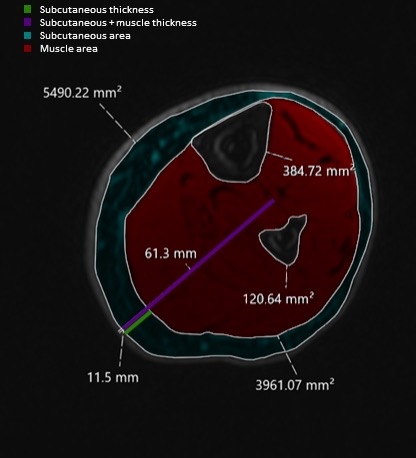
This was an IRB approved retrospective study that included 20 patients (15 female, 5 male) with clinically diagnosed lymphedema (14 with unilateral and 6 with bilateral lower extremity lymphedema) who had previously undergone routine MR lymphangiography (MRL) at our institution. Our clinical MRL protocol includes multi-station pre-contrast T1-weighted 3D SPGR sequences (DIXON fat separation, TE 1.1/2.2 ms, TR 5-15, Flip Angle 15°, matrix 320 x 320, slice thickness 1.6 mm, FOV 40-42 cm) acquired on a 3T magnet (GE Signa Architect). These pre-contrast images were retrospectively evaluated by one radiologist with 5 years of experience, on a total of 40 limbs, with the water phase used for all measurements. International Society of Lymphology (ISL) stage was obtained from the clinical record.Thickness and area measurements were obtained at the mid-thigh and mid-calf levels of both limbs as shown in Figures 1 and 2. The subcutaneous thickness fraction was calculated as the subcutaneous tissue thickness divided by the sum of subcutaneous and muscle tissue thickness. The subcutaneous area fraction was calculated by dividing the subcutaneous area by the sum of subcutaneous and muscle area.
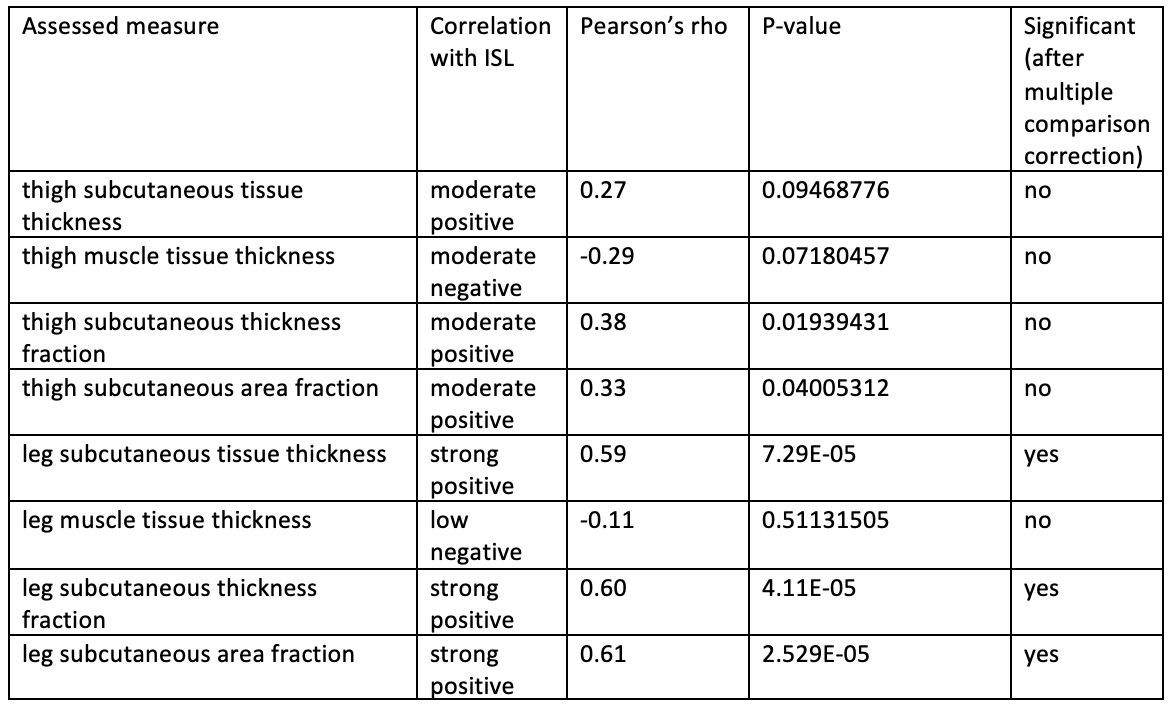
Pearson correlation tests were used to assess the correlation between subcutaneous and muscle thickness, subcutaneous thickness fraction, and subcutaneous area fraction, with ISL stage. Pearson’s rho values of <0.25, 0.25–0.49, 0.50-0.74, and 0.75-1.0 were considered to indicate low, moderate, strong, and excellent correlations, respectively. Significance was set at p<0.05 and tested using a two-tailed Fisher’s exact test, with a Holms-Bonferonni correction performed for multiple comparisons.
Results/Discussion
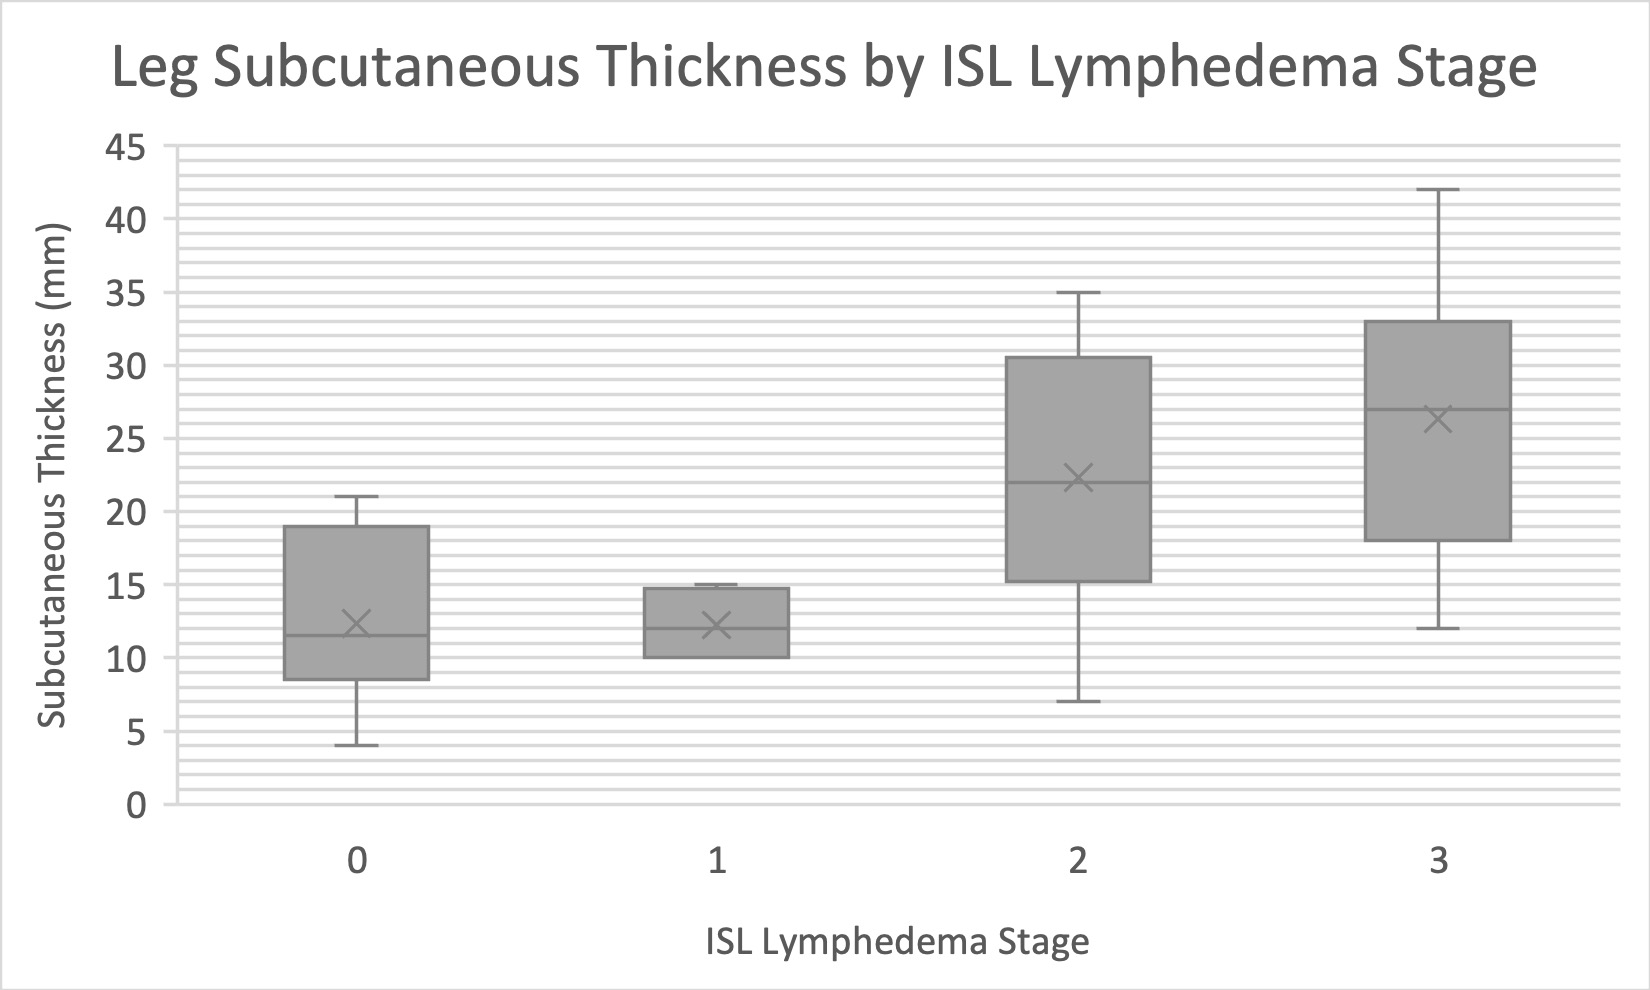
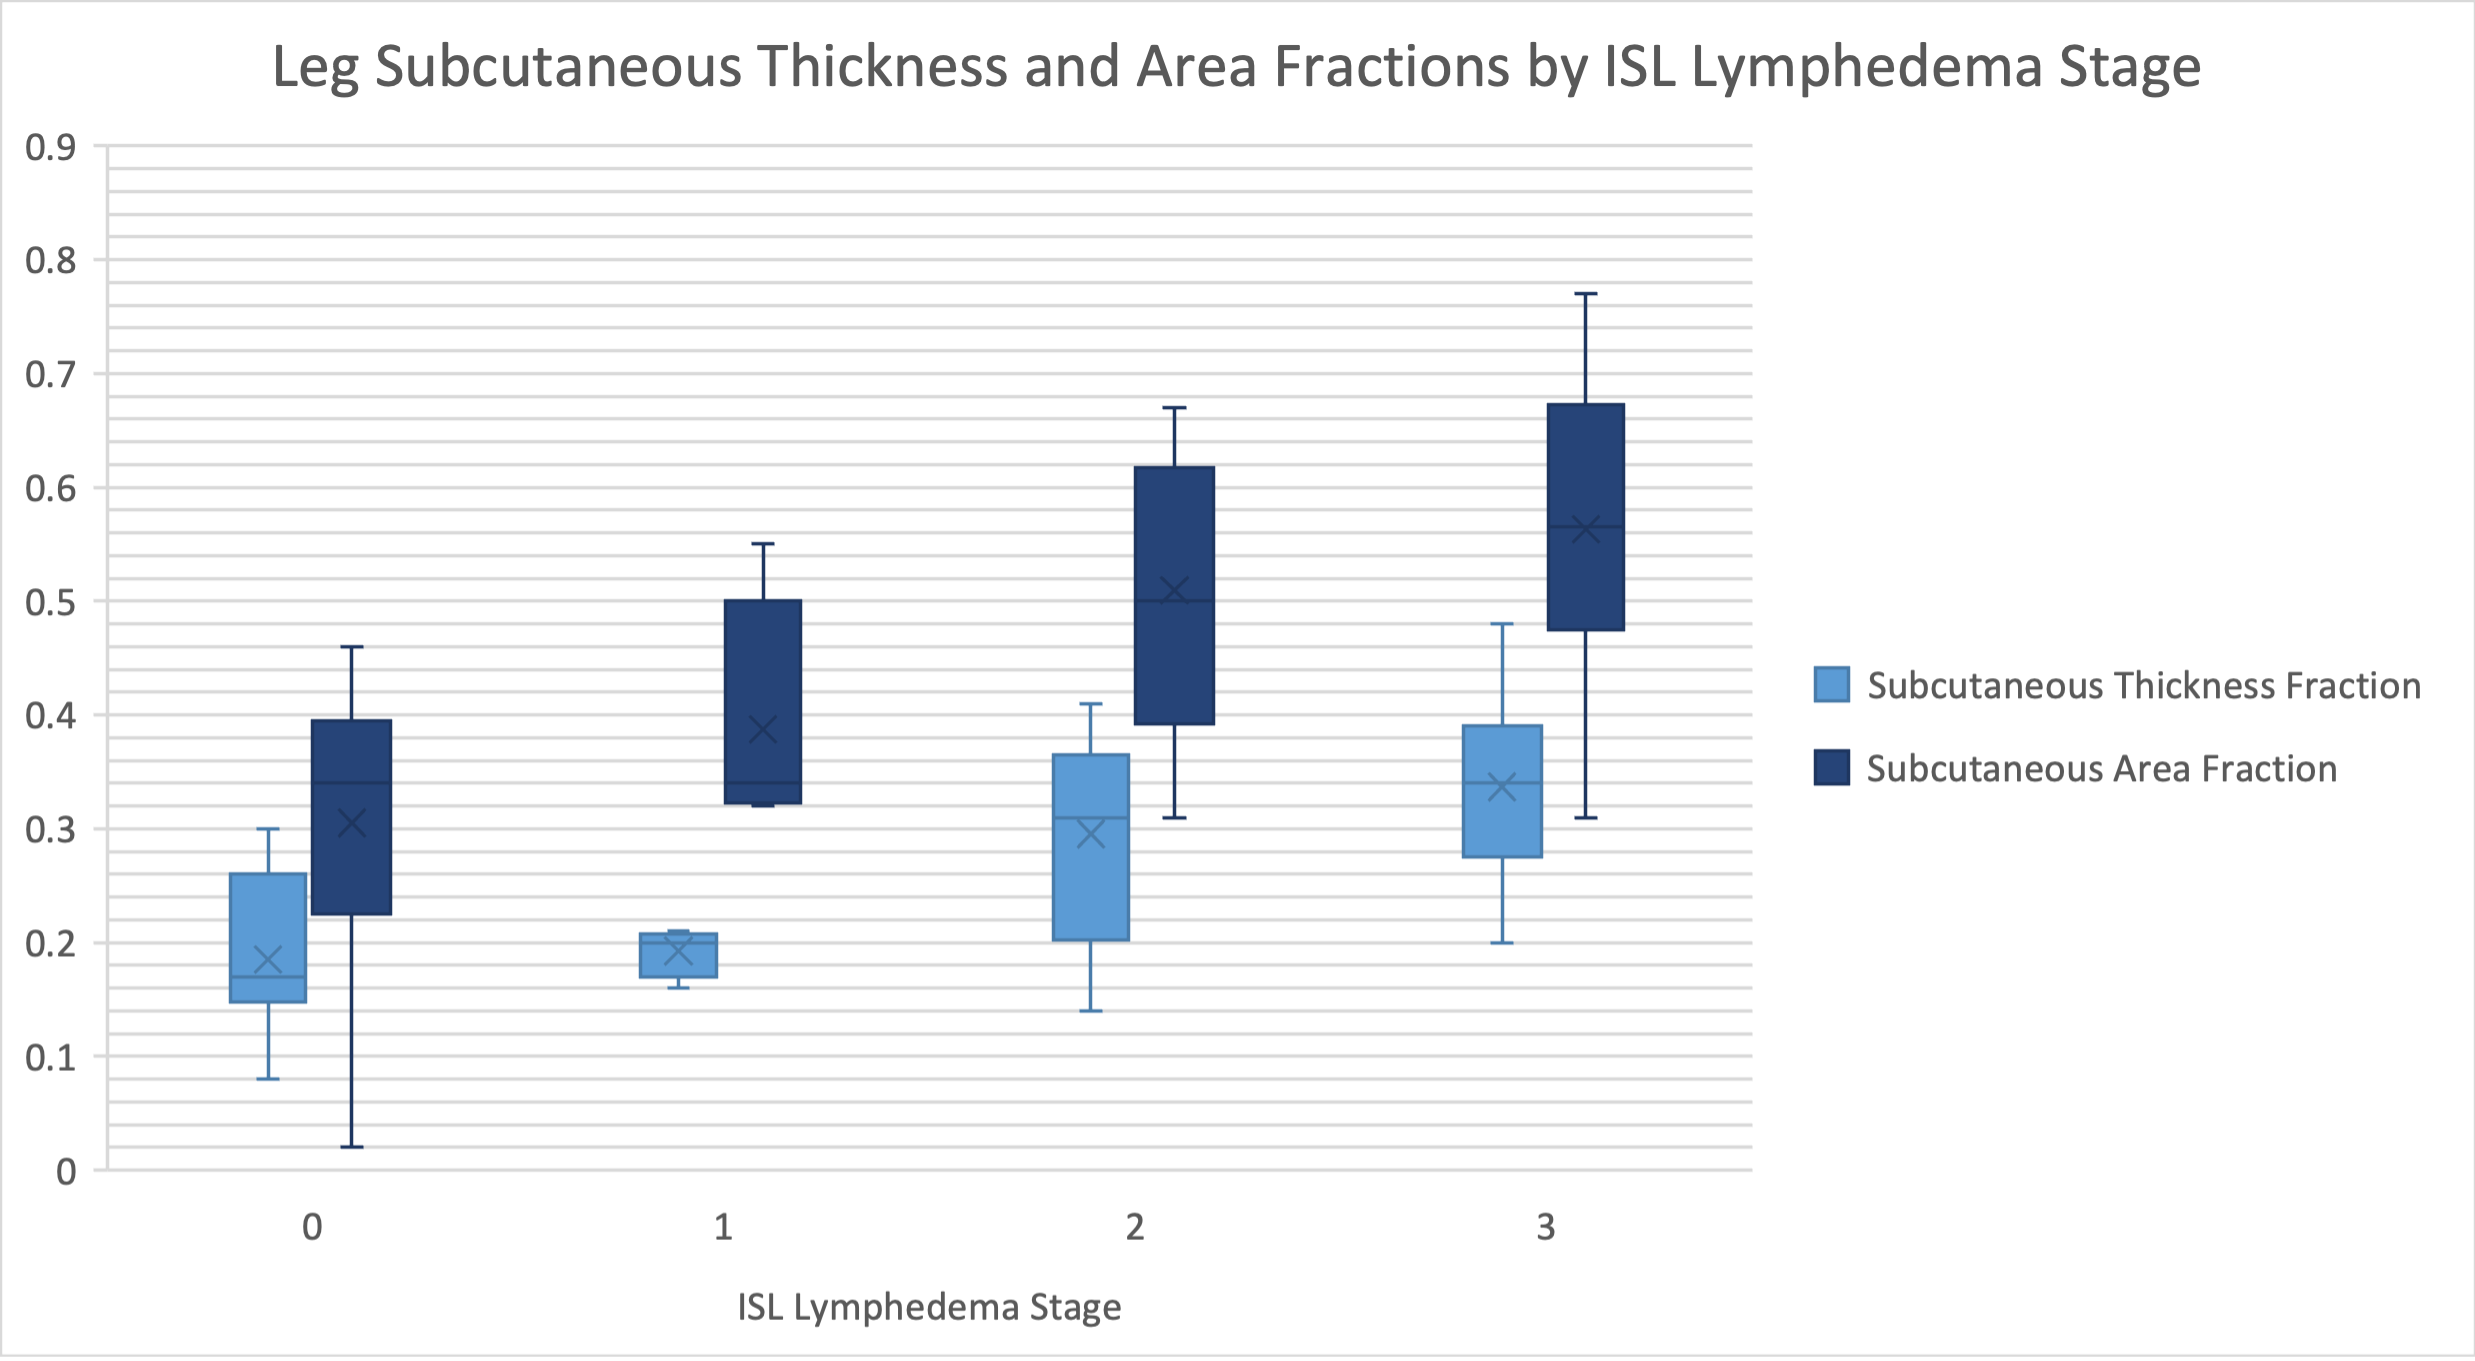
Correlations between assessed parameters and clinical ISL stage are shown in Table 1. This study revealed that leg subcutaneous thickness, subcutaneous thickness fraction, and subcutaneous area fraction of lower limb strongly correlate with ISL lymphedema stage. Thigh subcutaneous thickness, subcutaneous thickness fraction, and subcutaneous area fraction of the thigh only moderately correlated with ISL stage. As lymphedema typically progresses from the distal extremity to the proximal extremity the greater correlation with the lower limb is expected. The fact that subcutaneous tissue thickness and area increase with lymphedema stage is not surprising as subcutaneous adipose deposition is part of the disease process.Interestingly, a moderate negative correlation trend was observed with thigh muscle thickness with a non-significant p-value of 0.07. The differences between the measurement of muscle thickness in subsequent ISL stages were not statistically significant. A negative correlation was observed between both thigh muscle and leg muscle thickness when compared to ISL lymphedema stage. However, this correlation was not statistically significant. Further evaluation with muscle fat fraction analysis is of interest to our group.
Conclusion
Lower limb subcutaneous thickness fraction is a simple calculation based on quick non-contrast MRI measurements that in the leg significantly correlates with ISL stage. Though muscle thickness demonstrated a trend to a moderate negative correlation, this observation was not statistically significant based on this data. Further research is required to understand the relationship of lymphatic and muscular pathology.Acknowledgements
No acknowledgement found.References
1. Executive Committee. The Diagnosis and Treatment of Peripheral Lymphedema: 2016 Consensus Document of the International Society of Lymphology. Lymphology. 2016;49(4):170-184.
2. Moffatt CJ, Franks PJ, Doherty DC, et al. Lymphoedema: an underestimated health problem. QJM. 2003;96(10):731-738. doi:10.1093/qjmed/hcg126
3. Giray E, Yagci I. Diagnostic accuracy of interlimb differences of ultrasonographic subcutaneous tissue thickness measurements in breast cancer-related arm lymphedema. Lymphology. 2019;52(1):1-10.
4. Karlsson T, Karlsson M, Ohlin K, Olsson G, Brorson H. Liposuction of Breast Cancer-Related Arm Lymphedema Reduces Fat and Muscle Hypertrophy. Lymphatic Research and Biology. Published online March 2, 2021. doi:10.1089/lrb.2020.0120
5. Pons G, Clavero JA, Alomar X, Rodríguez-Bauza E, Tom LK, Masia J. Preoperative planning of lymphaticovenous anastomosis: The use of magnetic resonance lymphangiography as a complement to indocyanine green lymphography. Journal of Plastic, Reconstructive & Aesthetic Surgery. 2019;72(6):884-891. doi:10.1016/j.bjps.2019.02.024
Figures