2129
Correlation between 18F-FDG PET/MR imaging parameters and histopathological factors from image-guided biopsy in breast1Nuclear Medicine, IRCCS San Raffaele Scientific Institute, Milan, Italy, 2Radiology, IRCCS San Raffaele Scientific Institute, Milan, Italy, 3Institute of Molecular Bioimaging and Physiology, National Research Council (IBFM-CNR), Milan, Italy, 4Vita-Salute San Raffaele University, Milan, Italy, 5Breast Surgery Unit, IRCCS San Raffaele Scientific Institute, Milan, Italy
Synopsis
This work investigates the correlations between PET/MR imaging parameters and histopathological factors of breast tumors extracted from image-guided biopsy. Results from our work show that PET and some MR parameters are statistically correlated to histopathological factors. Moreover, the integration of PET and MR (DCE-MR and ADC) parameters might help in the prediction of histopathological factors.
Introduction
Breast cancer (BC) is the most diagnosed cancer in women worldwide1. Positron Emission Tomography (PET) and Magnetic Resonance (MR) imaging could have an essential role in BC diagnosis and in the evaluation of tumor response therapy. MR provides excellent soft tissue characterization defining tumor extension. PET detects tumor metabolic activity, so it can be used for systemic staging in selected cases. Hybrid PET/MR combines PET specificity and MR sensitivity, enabling simultaneous acquisition of functional and anatomical information, offering an accurate evaluation of primary cancer, lymph-nodal involvement, distant metastases and response to systemic therapy in a single clinical session.Aim of this study is to investigate correlations between PET/MR imaging parameters and histopathological factors of breast tumors extracted from image-guided biopsy.
Methods
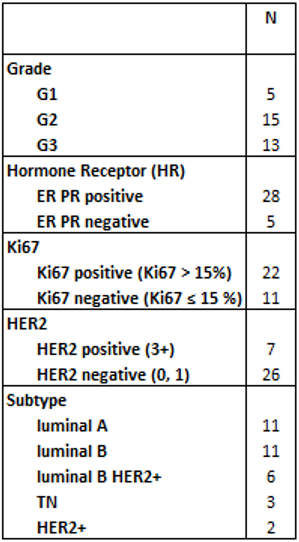
Thirty-two patients (mean age: 55±12), who were diagnosed with cT1-3, N0-3 BC and were candidates to upfront surgery or primary systemic therapy, were included in two prospective trials and analyzed in this study.Estrogen Receptor (ER), Progesterone Receptor (PR), Human Epidermal growth factor receptor 2 (HER2) and Ki67 were obtained from image-guided biopsy before PET/MR acquisition. Three differentiation levels of tumor grading were used (G1, G2, G3). Based on ER, PR, HER2 and Ki67 values, five tumor subtypes were found: luminal A, luminal B, luminal B Her2+, triple negative and Her2+. Values of Ki67≤15% were considered negative.
Patients underwent 18F-FDG PET/MR using a fully hybrid PET/MR 3T system (SIGNA PET/MR, GE Healthcare, Waukesha, WI). High statistic breast PET scan and MR images were acquired with patients in prone position with an 8-channel dedicated breast coil. Dynamic Contrast Enhanced (DCE) and Diffusion Weighted (DW) images were included in the study protocol. Apparent Diffusion Coefficient (ADC) maps were calculated.
PET and MR breast lesions were independently segmented on 3DSlicer2 by an expert nuclear medicine physician and radiologist, respectively. PET segmentation was performed by using a fixed-threshold segmentation algorithm (40% of the maximum uptake value), followed by manual adjustment. For each lesion, two PET quantitative parameters (SUVmax, SUVmean), two ADC quantitative parameters (ADCmin, ADCmean) and ten DCE-MR semiquantitative parameters were calculated. Specifically, from DCE, five post-contrast SI enhancement percentages (Ei, with 1≤i≤5) were calculated in respect to the pre-contrast3, Maximum Slope of Increase (MSI), Early Signal Enhancement Ratio (ESER), Slope4, Signal First Enhancement Ratio (SFER)5 and Positive Enhancement Integral (PEI)6.
Spearman’s correlation coefficients (r) and p values were calculated for the comparisons between MRI and PET parameters and between imaging parameters and ER, PR and Ki67. Mann-Whitney U test was used to assess relationship between imaging parameters and grade, Ki67, hormone receptors (HR, considering together ER and PR), HER2 and subtype (luminal A vs luminal B). P < 0.05 was considered significant.
Results
Figure 1 shows an example of acquired images on PET/MR system.Thirty-three breast lesions were segmented in PET and DCE-MR images, while thirty were included in ADC map analysis. The number of lesions for each histological parameter are listed in Table 1.
ESER, Slope and SFER showed a significant but low correlation with SUVmax (r=0.388, r=-0.373, r=0.408) and SUVmean (r=0.397, r=-0.384, r=0.419). Between ADCmean and SUVmean a trend of low inverse correlation was found (r=-0.337 and p=0.069). No other correlations between MRI and PET parameters were significant.
ESER, Slope and SFER were found significantly low correlated with Ki67 (r=0.422, r=-0.412, r=0.437). Both SUVmax and SUVmean were significantly correlated with ER (r=-0.551, r=-0.515 and both p<0.01), PR (r=-0.547, r=-0.525 and both p<0.01) and Ki67 (r=0.844, r=0.793 and both p<0.0001).
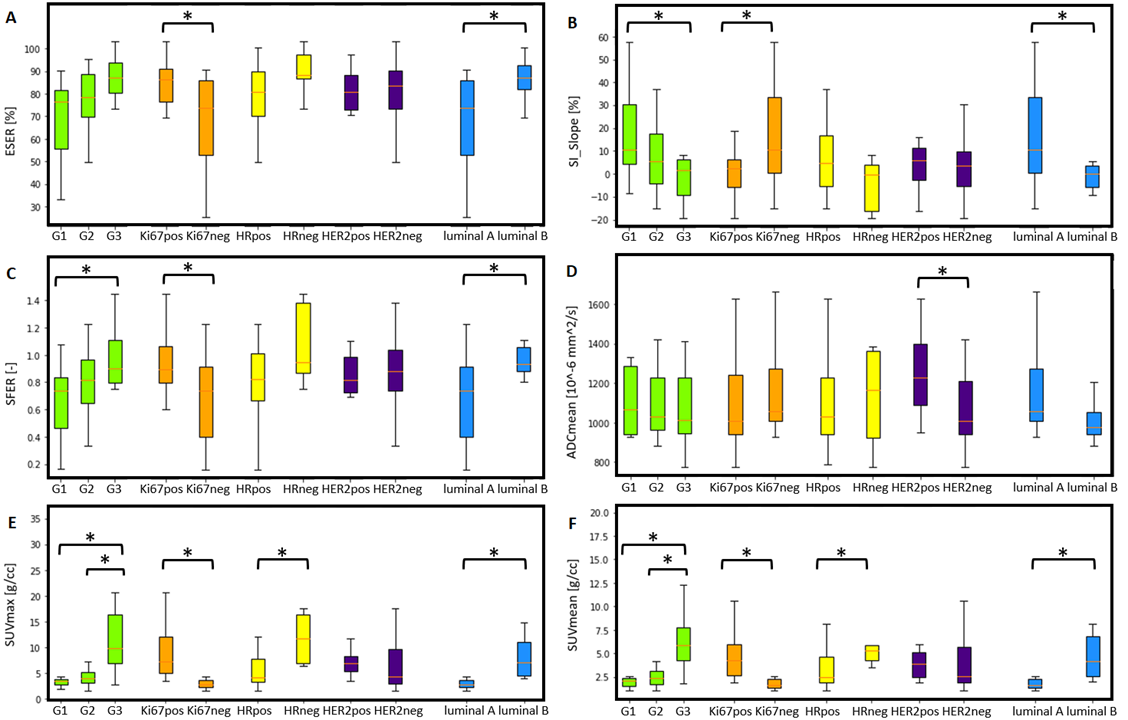
In Figure 2, the capabilities of some imaging parameters in differentiating grade, Ki67, HR, HER2 and subtype (luminal A vs luminal B) are represented by a series of boxplot. Significant difference in G1vsG3 and G2vsG3 was found for SUVmax (p=0.002, p=0.0005) and SUVmean (p=0.002, p=0.0005). Slope and SFER were significantly different in G1vsG3 (p=0.047, p=0.038). Positive and negative Ki67 values were significantly differentiated by three DCE-MR parameters (ESER, Slope and SFER), by SUVmax (p=0.00001) and by SUVmean (p=0.00003). HR was statistically differentiated by SUVmax and SUVmean (p=0.016, p=0.027). ADCmean significantly differentiated HER2 (p=0.029). In subtype analysis, SUVmax, SUVmean, E1, ESER, Slope and SFER had significant p value in differentiating luminal A and luminal B (p=0.0001, p=0.0003, p=0.044, p=0.015, p=0.028, p=0.028).
Discussion and Conclusions
From these preliminary results, we found a significant correlation between PET and three DCE parameters (ESER, Slope and SFER). Differently from Kitajima et al7, but similarly to Inglese et al8, no significant correlation between any of PET and ADC quantitative parameters was observed. Significant correlations and relationships were found between imaging parameters (mainly SUVmax, SUVmean, ESER, Slope and SFER) and histopathological factors. As shown in Figure 2, it can be noticed that many of the histopathological factors, except HER2, were statistically differentiated by PET parameters. Only ADCmean statistically differentiated HER2. In conclusion, it could be asserted that the integration of PET and MR (DCE-MR and ADC) parameters might help in the prediction of histopathological factors. Further analysis are needed to confirm these results.Acknowledgements
This research was funded by Associazione Italiana per la Ricerca sul Cancro, grant number IG 2018 Id.21840 and Ministero della Salute Italiana (Italian Ministry of Health) for Ricerca Finalizzata Ordinaria, grant number RF-2018-12368096. Signa PET/MRI system (GE Healthcare, Waukesha, WI) used in the present work was purchased with funding from the Italian Ministry of Health.
References
1. Sung H., et al. Global cancer statistics 2020: GLOBOCAN estimates of incidence and mortality worldwide for 36 cancers in 185 countries. CA: a cancer journal for clinicians 2021;71(3): 209-249.
2. Fedorov A., et al. 3D Slicer as an image computing platform for the Quantitative Imaging Network. Magnetic resonance imaging 2012;30(9): 1323-1341.
3. Umutlu L., et al. Multiparametric Integrated 18F-FDG PET/MRI-Based Radiomics for Breast Cancer Phenotyping and Tumor Decoding. Cancers 2021;13(12): 2928.
4. Song L., Li C., and Yin J. Texture Analysis Using Semiquantitative Kinetic Parameter Maps from DCE-MRI: Preoperative Prediction of HER2 Status in Breast Cancer. Frontiers in Oncology 2021;11: 2083.
5. Liu Z., et al. Preoperative prediction of lymphovascular invasion in invasive breast cancer with dynamic contrast‐enhanced‐MRI‐based radiomics. Journal of Magnetic Resonance Imaging 2019;50(3): 847-857.
6. Nadrljanski M., et al. Positive enhancement integral values in dynamic contrast enhanced magnetic resonance imaging of breast carcinoma: ductal carcinoma in situ vs. invasive ductal carcinoma. European journal of radiology 2014;83(8): 1363-1367.
7. Kitajima K., et al. Correlation of the SUVmax of FDG-PET and ADC values of diffusion-weighted MR imaging with pathologic prognostic factors in breast carcinoma. European journal of radiology 2016;85(5): 943-949.
8. Inglese M., et al. A multi‐parametric PET/MRI study of breast cancer: Evaluation of DCE‐MRI pharmacokinetic models and correlation with diffusion and functional parameters. NMR in Biomedicine 2019;32(1): e4026.
Figures