2126
Effect of a lifestyle intervention with plant-based diet on liver and muscle lipids in metabolic syndrome-associated osteoarthritis patients1Amsterdam UMC, University of Amsterdam, Department of Radiology and Nuclear Medicine, Amsterdam Gastroenterology Endocrinology Metabolism, Meibergdreef 9, Amsterdam, Netherlands, 2Amsterdam Rheumatology and Immunology Center, Reade, 1056 AB, Amsterdam, Netherlands, 3Amsterdam UMC, Amsterdam Medical Center, 1105 AZ, Amsterdam, Netherlands
Synopsis
The aim of this study was to evaluate the effect of a 16-week multidisciplinary lifestyle intervention with a plant-based diet on hepatocellular, intra- and extramyocellular lipid levels in patients with metabolic syndrome-associated osteoarthritis as measured by proton MR spectroscopy. The intervention group (n=17) was compared with the control group receiving usual care (n=15). At the end of the intervention the intervention group showed reduced hepatocellular lipid levels and total body fat mass and improved metabolic and inflammatory markers compared to the control group. There was no observable change of intra- and extramyocellular lipid levels.
Introduction
Metabolic syndrome, a combination of risk factors including high fat mass, hypertension, insulin resistance and dyslipidemia, is more common in patients with osteoarthritis (OA), compared to those without OA, and plays a role in its etiology and progression.1,2 Low-grade chronic inflammation is seen as a key component of metabolic syndrome and is associated with OA.2-4 Furthermore, hepatocellular and intramyocellular lipid (IMCL) and extramyocellular lipid (EMCL) accumulation are associated with insulin resistance, while hepatocellular lipid (HCL) accumulation is also correlated with other components of the metabolic syndrome and inflammation.5-7 Inflammation and insulin resistance may help explain the relationship between metabolic syndrome and OA and could be targeted to reduce progression of OA. Studies show lifestyle interventions, such as hypocaloric and whole-food plant-based diets (WFPD), mindfulness, and/or exercise interventions, can reduce inflammation and symptoms in patients with OA.8-11 Also, a WFPD has been shown to reduce both HCL and IMCL levels.12 Yet, no studies have investigated the synergistic effects of a multidisciplinary lifestyle intervention in OA patients and its effect on HCL, IMCL, and EMCL levels.Methods
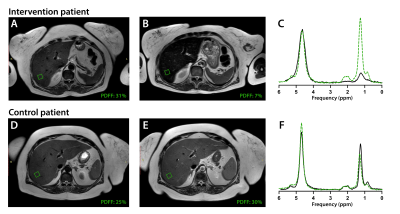
Adults with knee and/or hip OA and metabolic syndrome were randomized into a 16-week multidisciplinary lifestyle program, “Plants for Joints” group (PFJ), or a control group (CG).13 The PFJ group received personal diet and exercise counseling followed by 10 group meetings with 6-12 participants consisting of theoretical and practical training on a WFPD, exercise, and stress management. The CG received usual care; medication was unchanged in both groups. In a subgroup of 32 participants (n=17 PFJ, n=15 CG) a MR spectroscopy (MRS) study was performed on a 3T scanner (Philips Healthcare, Best, The Netherlands) using a posterior coil located in the table and an anterior torso-coil covering the abdominal region and the upper leg. MRS acquisitions and secondary outcomes were acquired at baseline and after 16 weeks.MRS data were acquired in accordance with a previous study.14,15 Briefly, data were acquired using a multi-echo stimulated-echo acquisition mode (STEAM). Five spectra were acquired with echo times of 10, 15, 20, 25, and 30ms and a repetition time of 3500ms. For HCL, a single voxel (20×20×20mm3) was positioned in the right hepatic lobe, avoiding major blood vessels, bile ducts and liver margins (Figure 1). For IMCL and EMCL, a single voxel (15×25×25 mm3) was placed in the right rectus femoris halfway between the knee joint and groin. HCL was determined using the proton density fat fraction (PDFF) calculated from spectral data fitted in jMRUI version 4.0 and Matlab R2021a (Mathworks, Natick, MA, USA).16,17 IMCL and EMCL spectra, acquired at an echo time of 11ms, were manually phased using jMRUI and referenced to the creatine-methyl resonance at 3 ppm. AMARES was used to estimate lipid signal amplitudes to calculate the total muscle fat, IMCL, and EMCL. Outcomes are expressed as percentage of the sum of unsuppressed water and total fat peaks.
Secondary outcomes included total body fat mass (FM) via DEXA, blood serum measurements (HbA1c, C-reactive protein (CRP), fasting blood glucose, total cholesterol, LDL-cholesterol, HDL-cholesterol, and triglycerides), blood pressure, and anthropometric measurements (waist circumference, weight, and height).
A linear regression analysis was performed to compare MRS and secondary outcomes between the PFJ group and CG after 16 weeks (controlled for baseline values, sex, age and BMI). Differences between groups at baseline, as well as within groups between baseline and end, were analyzed respectively with a two-sample or one-sample t-test when normally distributed or a Wilcoxon-Rank test when skewed. Results were reported as mean (SD) or median [Q3 – Q1] depending on data distribution. A p-value of <0.05 was considered significant.
Results
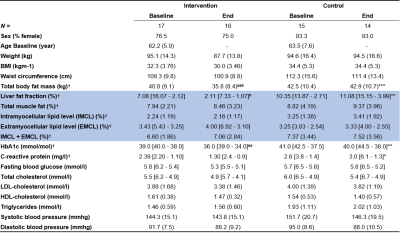
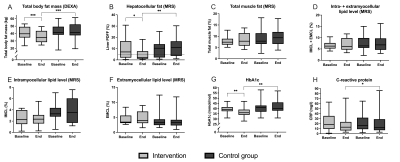
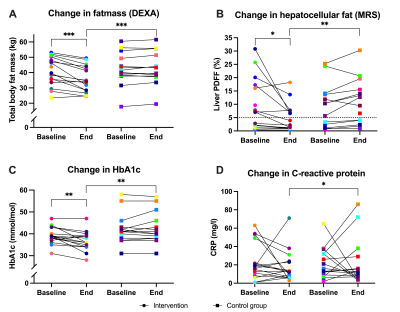
Participants were 62.8 (6.7) years old (84.4% female) (Table 1). Two from each group dropped out before the second MRI and several spectra were excluded or missing from baseline or end (PFJ group: liver n=1 and muscle n=8; CG: liver n=2; muscle n=3). The groups were similar at baseline and within the CG there was no change (Table 1). After 16 weeks the PFJ group had lower HCL (p <0.001) and FM (p <0.001) levels compared to the CG (Figures 2A-B and 3A-B). There was no difference in muscle fat distribution between groups at end-intervention (Figures 2C-F). Both HbA1c and CRP were lower in the PFJ group compared to the CG (Figures 2G-H and 3C-D). Specific metabolic syndrome components (fasting blood glucose and waist circumference) and total and LDL-cholesterol improved after the intervention (Table 1).Discussion
The WFPD lifestyle intervention reduced HCL and FM and improved metabolic and inflammatory markers in patients with OA compared to usual care. There were no observable changes in muscle fat distribution within or between groups, however the low number of quantifiable spectra for muscle fat may have impaired our ability to detect changes. The reduction in HCL levels is larger than results shown after an exclusive WFPD intervention.12 Furthermore, the simultaneous reductions of HCL, FM, HbA1c, and CRP in this study supports the previously described associations between body and liver fat, insulin resistance, and inflammation.5,6Conclusion
A 16-week WFPD multidisciplinary lifestyle program resulted in a reduction of total body FM and HCL and improved metabolic and inflammatory markers in patients with metabolic syndrome-associated OA.Acknowledgements
Research was funded by ZonMW (The Netherlands Organization for Health Research and Development) grant number 555003210.References
1. Puenpatom RA, Victor TW. Increased prevalence of metabolic syndrome in individuals with osteoarthritis: an analysis of NHANES III data. Postgrad Med 2009 Nov;121(6):9-20.2. Yoshimura N, Muraki S, Oka H, Tanaka S, Kawaguchi H, Nakamura K, et al. Accumulation of metabolic risk factors such as overweight, hypertension, dyslipidaemia, and impaired glucose tolerance raises the risk of occurrence and progression of knee osteoarthritis: a 3-year follow-up of the ROAD study. Osteoarthritis Cartilage 2012 Nov;20(11):1217-1226.
3. Bijlsma JW, Berenbaum F, Lafeber FP. Osteoarthritis: an update with relevance for clinical practice. Lancet 2011 Jun 18;377(9783):2115-2126.
4. Furman D, Campisi J, Verdin E, Carrera-Bastos P, Targ S, Franceschi C, et al. Chronic inflammation in the etiology of disease across the life span. Nat Med 2019 Dec;25(12):1822-1832.
5. Cariou B, Byrne CD, Loomba R, Sanyal AJ. Nonalcoholic fatty liver disease as a metabolic disease in humans: A literature review. Diabetes Obes Metab 2021 May;23(5):1069-1083.
6. Coen PM, Goodpaster BH. Role of intramyocelluar lipids in human health. Trends Endocrinol Metab 2012 Aug;23(8):391-398.
7. Goodpaster BH, Thaete FL, Kelley DE. Thigh adipose tissue distribution is associated with insulin resistance in obesity and in type 2 diabetes mellitus. Am J Clin Nutr 2000 Apr;71(4):885-892.
8. Clinton CM, O'Brien S, Law J, Renier CM, Wendt MR. Whole-foods, plant-based diet alleviates the symptoms of osteoarthritis. Arthritis 2015;2015:708152.
9. Fransen M, McConnell S, Harmer AR, Van der Esch M, Simic M, Bennell KL. Exercise for osteoarthritis of the knee: a Cochrane systematic review. Br J Sports Med 2015 Dec;49(24):1554-1557.
10. Lee AC, Harvey WF, Price LL, Han X, Driban JB, Wong JB, et al. Mindfulness Is Associated With Treatment Response From Nonpharmacologic Exercise Interventions in Knee Osteoarthritis. Arch Phys Med Rehabil 2017 Nov;98(11):2265-2273.e1.
11. Messier SP, Mihalko SL, Legault C, Miller GD, Nicklas BJ, DeVita P, et al. Effects of intensive diet and exercise on knee joint loads, inflammation, and clinical outcomes among overweight and obese adults with knee osteoarthritis: the IDEA randomized clinical trial. JAMA 2013 Sep 25;310(12):1263-1273.
12. Kahleova H, Petersen KF, Shulman GI, Alwarith J, Rembert E, Tura A, et al. Effect of a Low-Fat Vegan Diet on Body Weight, Insulin Sensitivity, Postprandial Metabolism, and Intramyocellular and Hepatocellular Lipid Levels in Overweight Adults: A Randomized Clinical Trial. JAMA Netw Open 2020 Nov 2;3(11):e2025454.
13. Walrabenstein W, van der Leeden M, Weijs P, van Middendorp H, Wagenaar C, van Dongen JM, et al. The effect of a multidisciplinary lifestyle program for patients with rheumatoid arthritis, an increased risk for rheumatoid arthritis or with metabolic syndrome-associated osteoarthritis: the “Plants for Joints” randomized controlled trial protocol. Trials 2021;22(1):715.
14. Runge JH, Smits LP, Verheij J, Depla A, Kuiken SD, Baak BC, et al. MR Spectroscopy-derived Proton Density Fat Fraction Is Superior to Controlled Attenuation Parameter for Detecting and Grading Hepatic Steatosis. Radiology 2018 Feb;286(2):547-556.
15. Troelstra MA, Witjes JJ, van Dijk AM, Mak AL, Gurney-Champion O, Runge JH, et al. Assessment of Imaging Modalities Against Liver Biopsy in Nonalcoholic Fatty Liver Disease: The Amsterdam NAFLD-NASH Cohort. J Magn Reson Imaging 2021 May 15.
16. Stefan D, Cesare FD, Andrasescu A, Popa E, Lazariev A, Vescovo E, et al. Quantitation of magnetic resonance spectroscopy signals: the jMRUI software package. Measurement Science and Technology 2009;20(10):104035.
17. Gu J, Liu S, Du S, Zhang Q, Xiao J, Dong Q, et al. Diagnostic value of MRI-PDFF for hepatic steatosis in patients with non-alcoholic fatty liver disease: a meta-analysis. Eur Radiol 2019 Jul;29(7):3564-3573.
Figures

Table 1. Descriptives and results reported as mean (SD) when normally distributed and median [Q3 – Q1] when skewed. MRS metrics are highlighted in blue. Metrics included in statistical analysis=†. A linear regression analysis was performed between groups after 16 weeks (p-value=*) (controlled for baseline values, sex, age and BMI). Differences between and within groups at baseline and/or end, were analyzed respectively with a two or one-sample t-test when normally distributed or a Wilcoxon-Rank test when skewed (p-value=#). P-value: ***<0.001, **<0.01, *<0.05.

Figure 1. Axial T2W liver MRI of an intervention and control patient before (A,D) and after a 16-week lifestyle intervention (B,E). The green boxes visualize the corresponding MRS voxel placement for hepatocellular fat quantification (proton density fat fraction, PDFF) derived from the acquired MRS spectra (C,F) at baseline (dotted green line) and end-intervention measurements (black line).

Figure 2. Results MRS and secondary outcomes. Box plots show median [Q3 – Q1] with error bars (5 – 95 percentile). A linear regression analysis was used to compare the intervention and control groups after 16 weeks (controlled for baseline values, sex (not D-F), BMI (only G and H) and age). Differences between and within groups at baseline and/or end, were analyzed respectively with a two or one-sample t-test when normally distributed or a Wilcoxon-Rank test when skewed. Dotted line in B shows the cut-off for NAFLD. P-value: ***<0.001, **<0.01, *<0.05.

Figure 3. Line graphs showing changes in MRS, DEXA, and laboratory outcomes before and after the 16-week lifestyle intervention or usual care for individual patients (given a color). A linear regression analysis compared the study groups after 16 weeks (controlled for baseline values, sex, BMI (only C and D) and age). Differences between and within groups at baseline and/or end, were analyzed respectively with a two-sample or one-sample t-test when normally distributed or a Wilcoxon-Rank test when skewed. Dotted line in B=cut-off for NAFLD. P-value: ***<0.001, **<0.01, *<0.05.