2122
The role of Cerebellum in a visuomotor task: A Dynamic Causal Modeling approach1Department of Brain and Behavioural Sciences, University of Pavia, Pavia, Italy, 2Department of Diagnostic Radiology, College of Applied medical sciences, King Abdulaziz University, Jeddah, Saudi Arabia, 3NMR Research Unit, Queen Square Multiple Sclerosis Centre, Department of Neuroinflammation, UCL Queen Square Institute of Neurology, UCL, London, United Kingdom, 4Department of Mental Health and Dependence, ASST of Pavia, Pavia, Italy, 5Brain Connectivity Center, IRCCS Mondino Foundation, Pavia, Italy
Synopsis
Dynamic Causal Modelling(DCM) is a framework enabling the quantification of the causal relationship between functionally connected brain regions. Here we included the cerebellum in a visuomotor network to investigate its role in motion prediction and how different Grip-Force levels modulate the effective connectivity between cerebellum and primary visual cortex. We estimated different DCMs models and we used Bayesian Models Selection to assess the best model at group-level. This study paves the way for investigating the source of BOLD non-linearities when applying different grip-forces in terms of modulations of the cerebro-cerebellar connections.
Introduction
Dynamic Causal Modelling (DCM) is a framework that enables establishing causal relationships between interconnected brain regions1,2. Thus, it is widely used in clinical and research functional MRI (fMRI) studies. DCM relies on Bayesian inference that estimates the connectivity parameters combining priors with the observed Blood Oxygenation Level Dependent (BOLD) signals3,4. This framework evaluates the “effective connectivity” between brain regions, which corresponds to quantifying the effect of one brain region onto another, determining the connectivity directionality and establishing direct causal influences between the same.This framework has already been used to investigate how cerebral motor connectivity is modulated by the applied Grip-Force (GF) during an event-related fMRI visuomotor task5,6. Here we aim to investigate the role of the cerebellum in terms of action execution(AE) prediction. For this achievement, we define a visuomotor network including: Primary Visual Cortex(V1), Supplementary Motor Area(SMA), Primary Motor Cortex(M1) and the Cerebellum(CRBL)(Fig.2).Different non-linear polynomial relationships between GF and BOLD have been found in the regions included in our network5. We focused on CRBL-V1 bi-directional effective connectivity and we investigated the direction of the GF non-linear modulation between these regions.Methods
Subjects: 5 right-handed healthy volunteers were included(25±1.4 years; 3 males).MRI protocol: A 3T Philips Achieva MRI scanner with a 32-channel head coil was used to perform a 3DT1 anatomical scan (Inversion prepared gradient-echo sequence with TR/TE/TI=6.9/3.1/824 ms, flip angle=8°, 1mm3 isotropic resolution) and three T2*-weighted EPI fMRI series (TR/TE=2500/35ms, 3mm3 isotropic resolution, FOV=192×192mm2, SENSE factor=2, flip angle=90°, 200 volumes).
Task: Subjects performed a dynamic power grip task with their right hand, using a squeeze-ball. An event-related visually guided paradigm was used, comprising 75 active trials divided equally among 5 grip forces (GF: 20%, 30%, 40%, 50%, 60%) of each subject's maximum voluntary contraction, interleaved with 75 rest trials.
Pre-processing: Using SPM12, standard fMRI pre-processing steps were applied, including slice timing, realignment, normalization and smoothing.
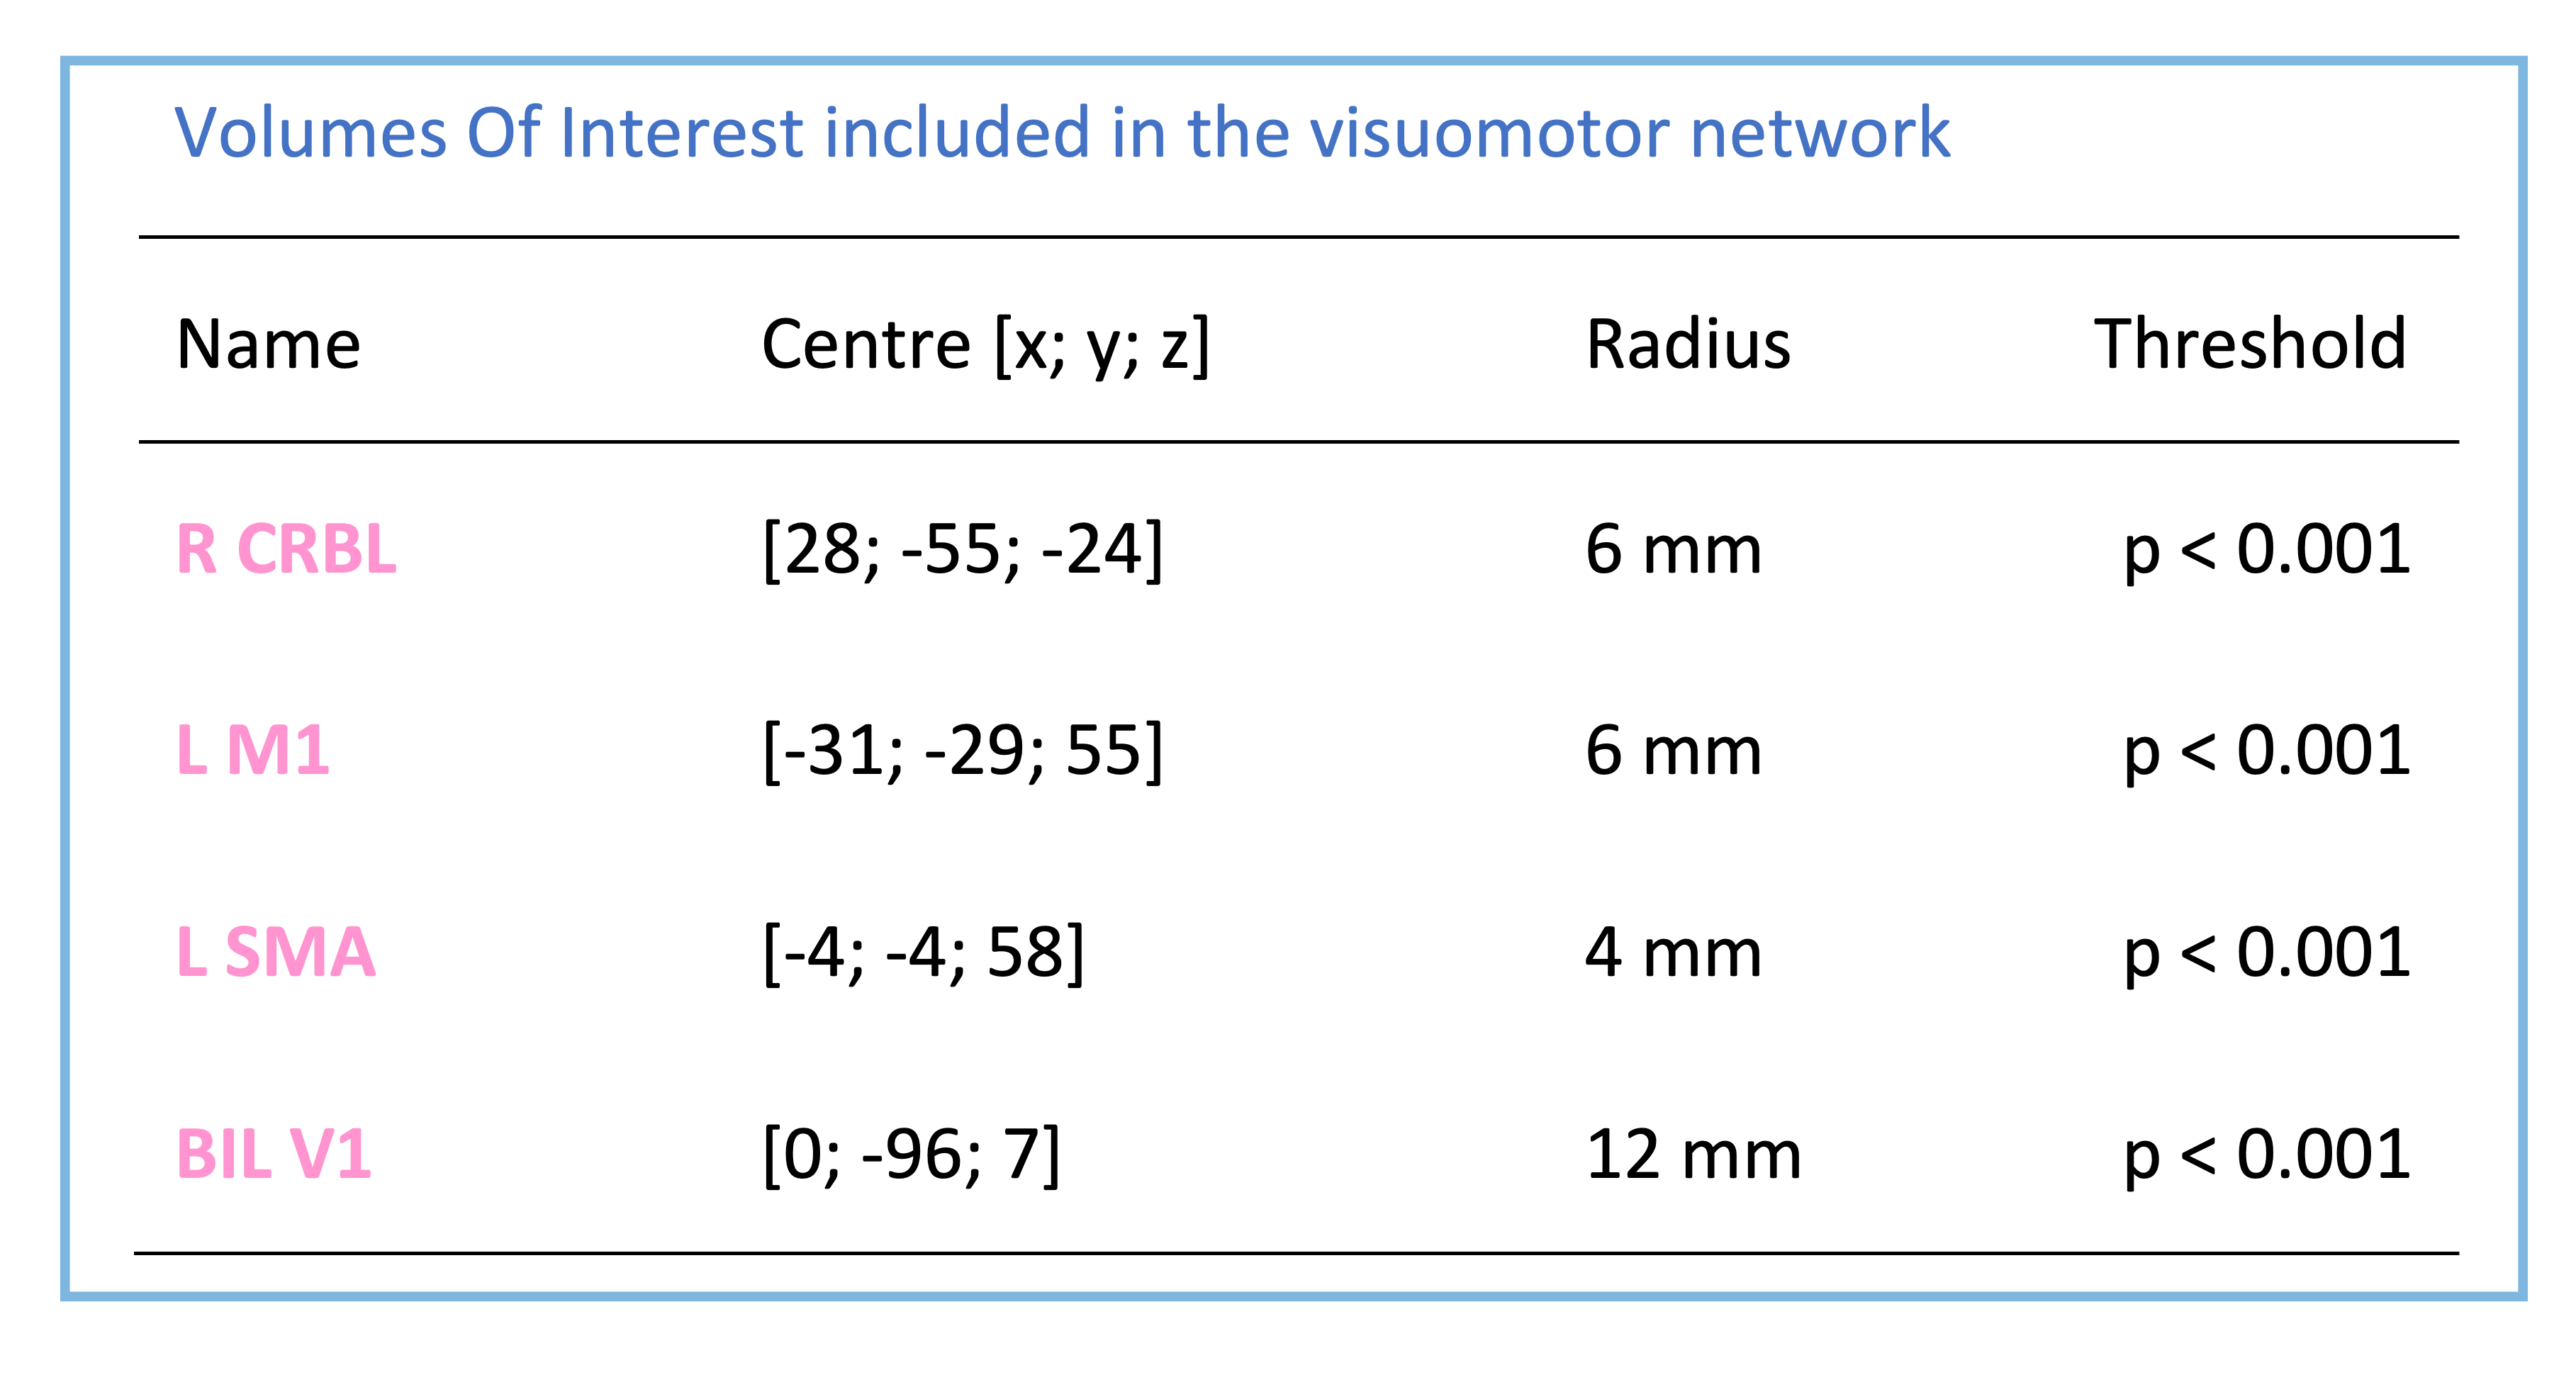
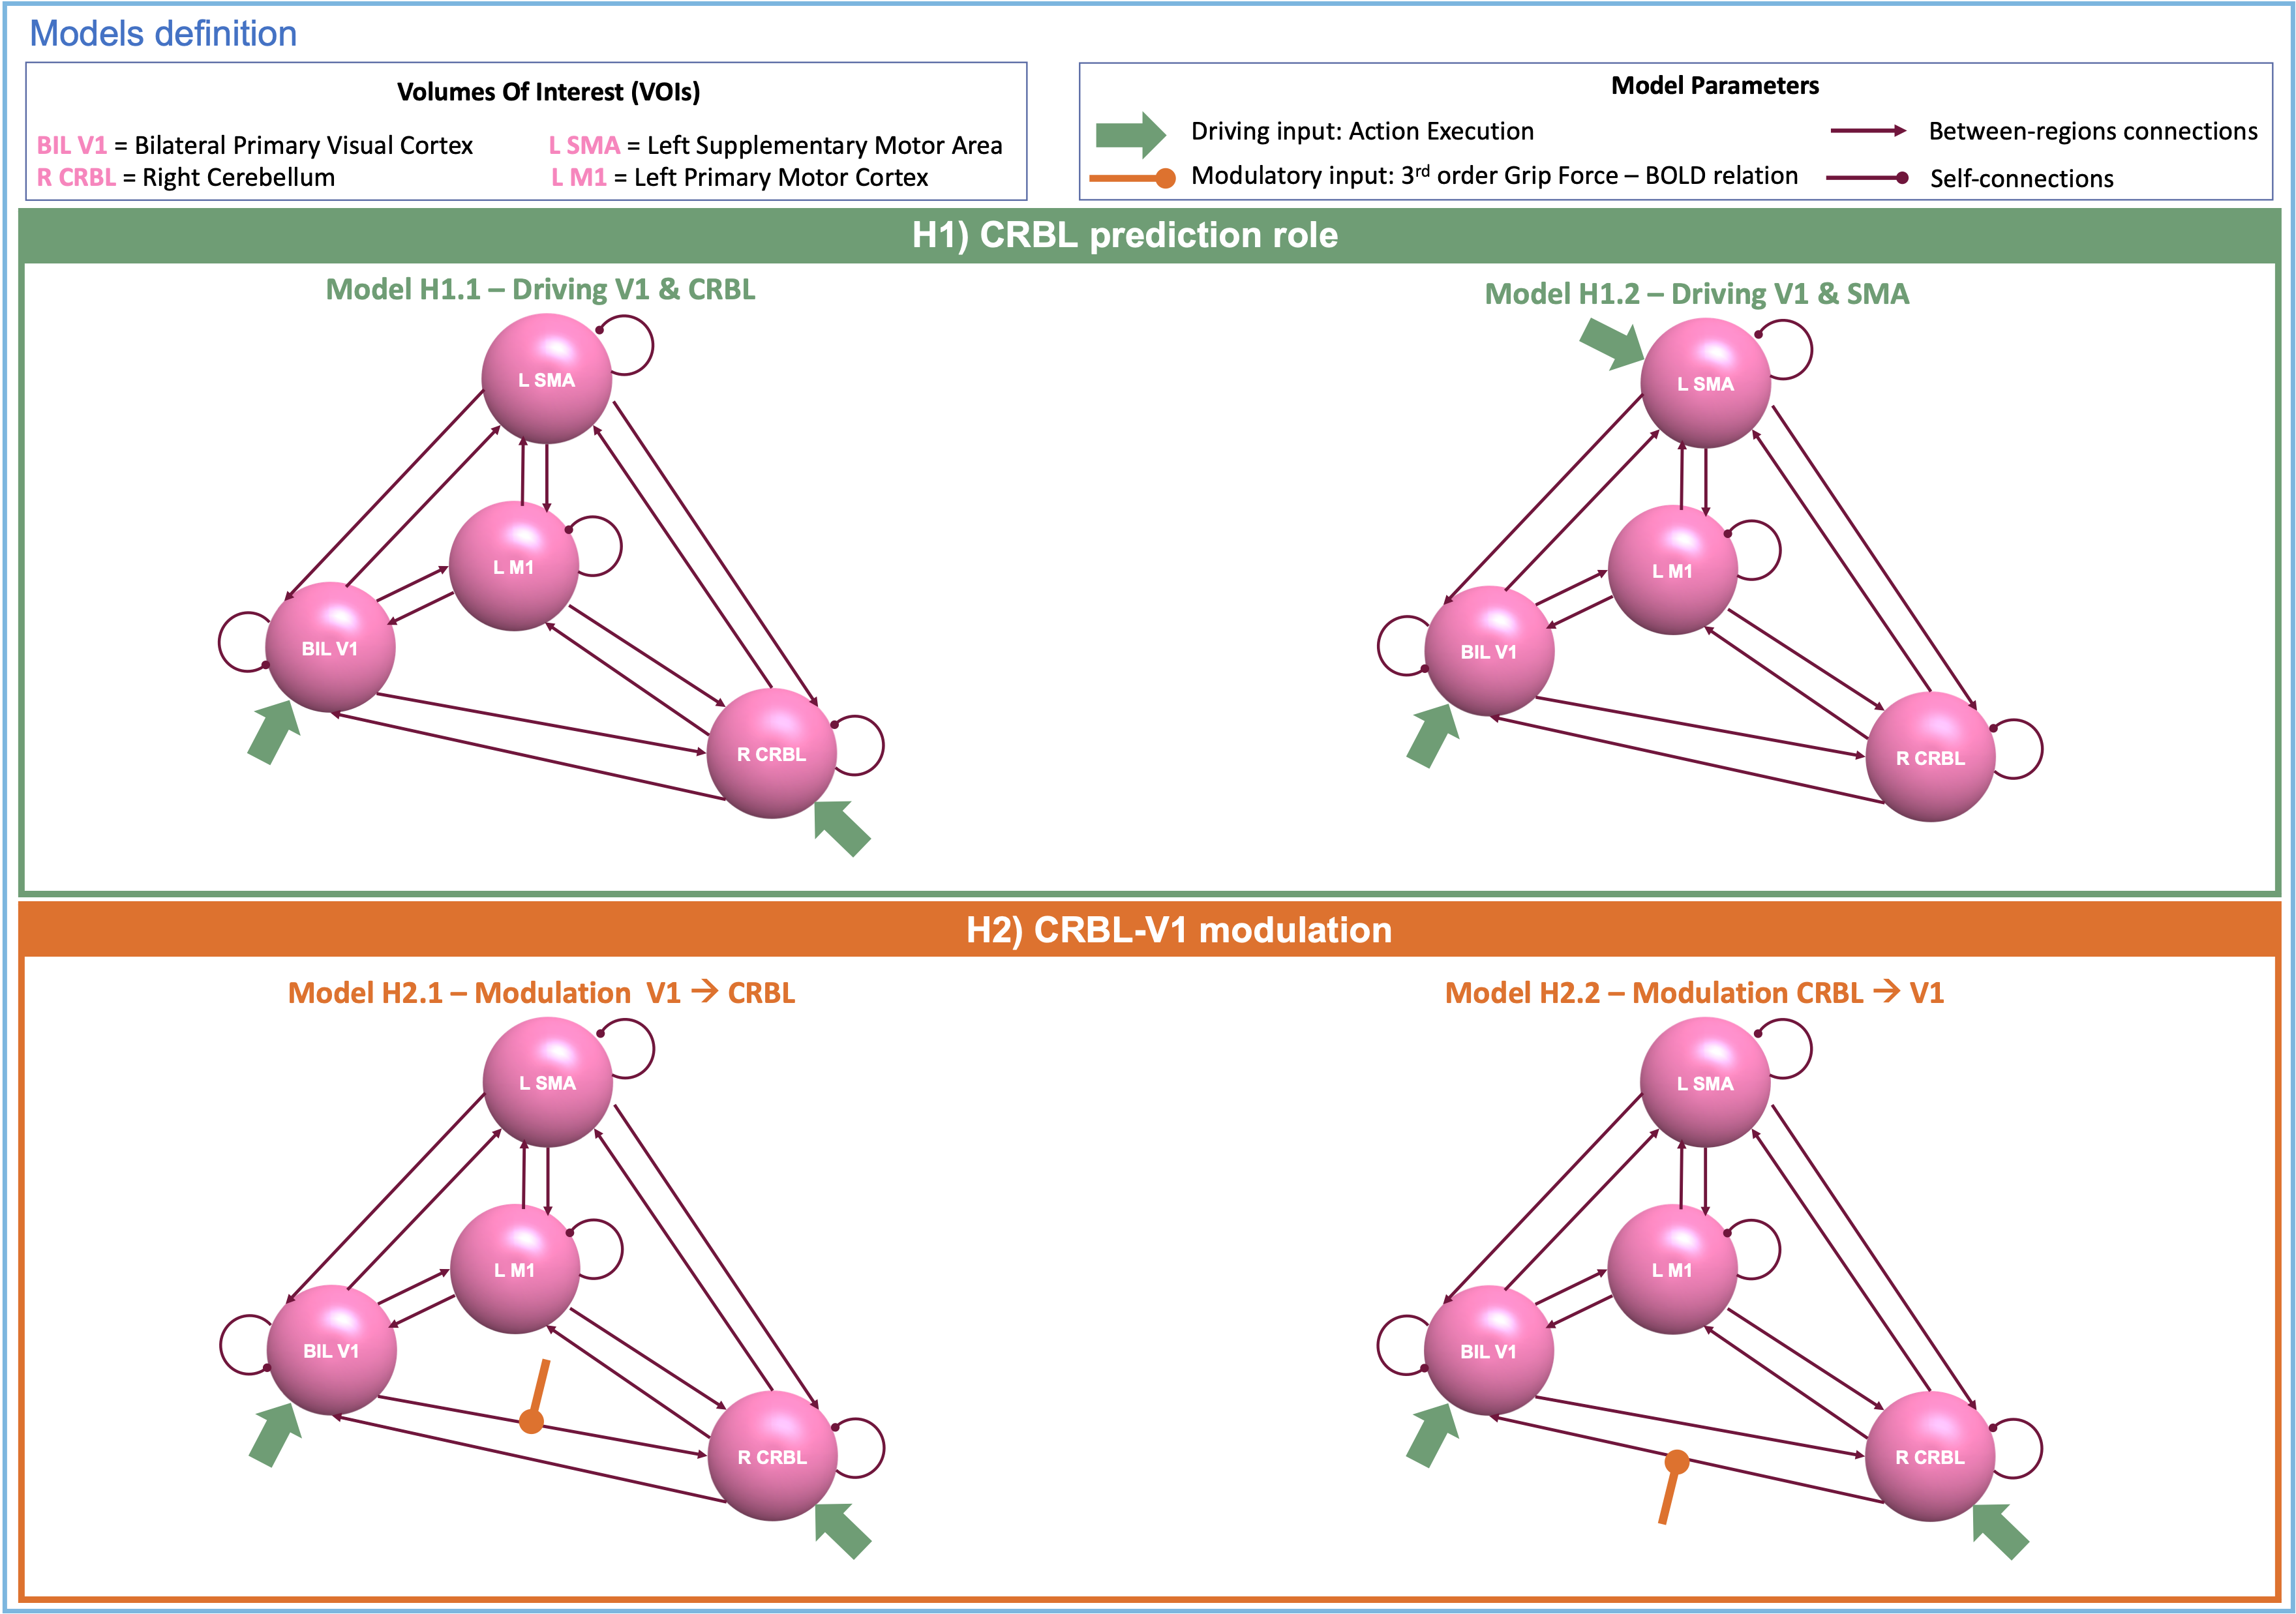
Models: Four spherical VOIs were included in the visuomotor network: right CRBL (R CRBL), left M1 (L M1), left SMA (L SMA) and bilateral V1 (BIL V1)(Fig.1 for details). For each of them, fMRI time-series were extracted. Multiple DCM models were built to test two hypotheses: (i) the cerebellum plays a predictive role in this visuomotor task (H1); (ii) GF non-linearly (3rd order) modulates V1-CRBL connections (H2).
H1) Two fully-connected models were specified and estimated: Action Execution(AE) was set as the external driving input for V1 and CRBL(Fig.2-Model H1.1) and for V1 and SMA(Fig.2-Model H1.2).
H2) Two models were specified and estimated: modulatory inputs were set on V1-to-CRBL connection(Fig.2-Model H2.1) and vice-versa(Fig.2-Model H2.2). Structural connectivity and input nodes were defined in accordance with the H1-winning model.
DCM analysis: H1) CRBL prediction role inference: Fixed Effects Bayesian Model Selection (FFX-BMS) was performed to select the best model in explaining experimental time-series7. In detail, between-regions connectivity posterior probability at subject-level was estimated through Bayesian model inversion, and Group Bayesian Factor (GBF) was computed on those posterior probabilities to identify the best-model. Since no a priori assumption on effective connectivity was imposed (fully-connected model), a post-hoc analysis was performed on the best-model selected at group-level to assess the most significant connections (H1-winning model). H2) CRBL-V1 modulation inference: Based on a priori knowledge5, we used the 3rd order negative polynomial expansion of the GF-BOLD relation as modulatory input for the V1-CRBL connection. Bayesian model inversion was performed on the resulting models both at subject-level and group-level. FFX-BMS was used for best-model selection (H2-winning model)
Results
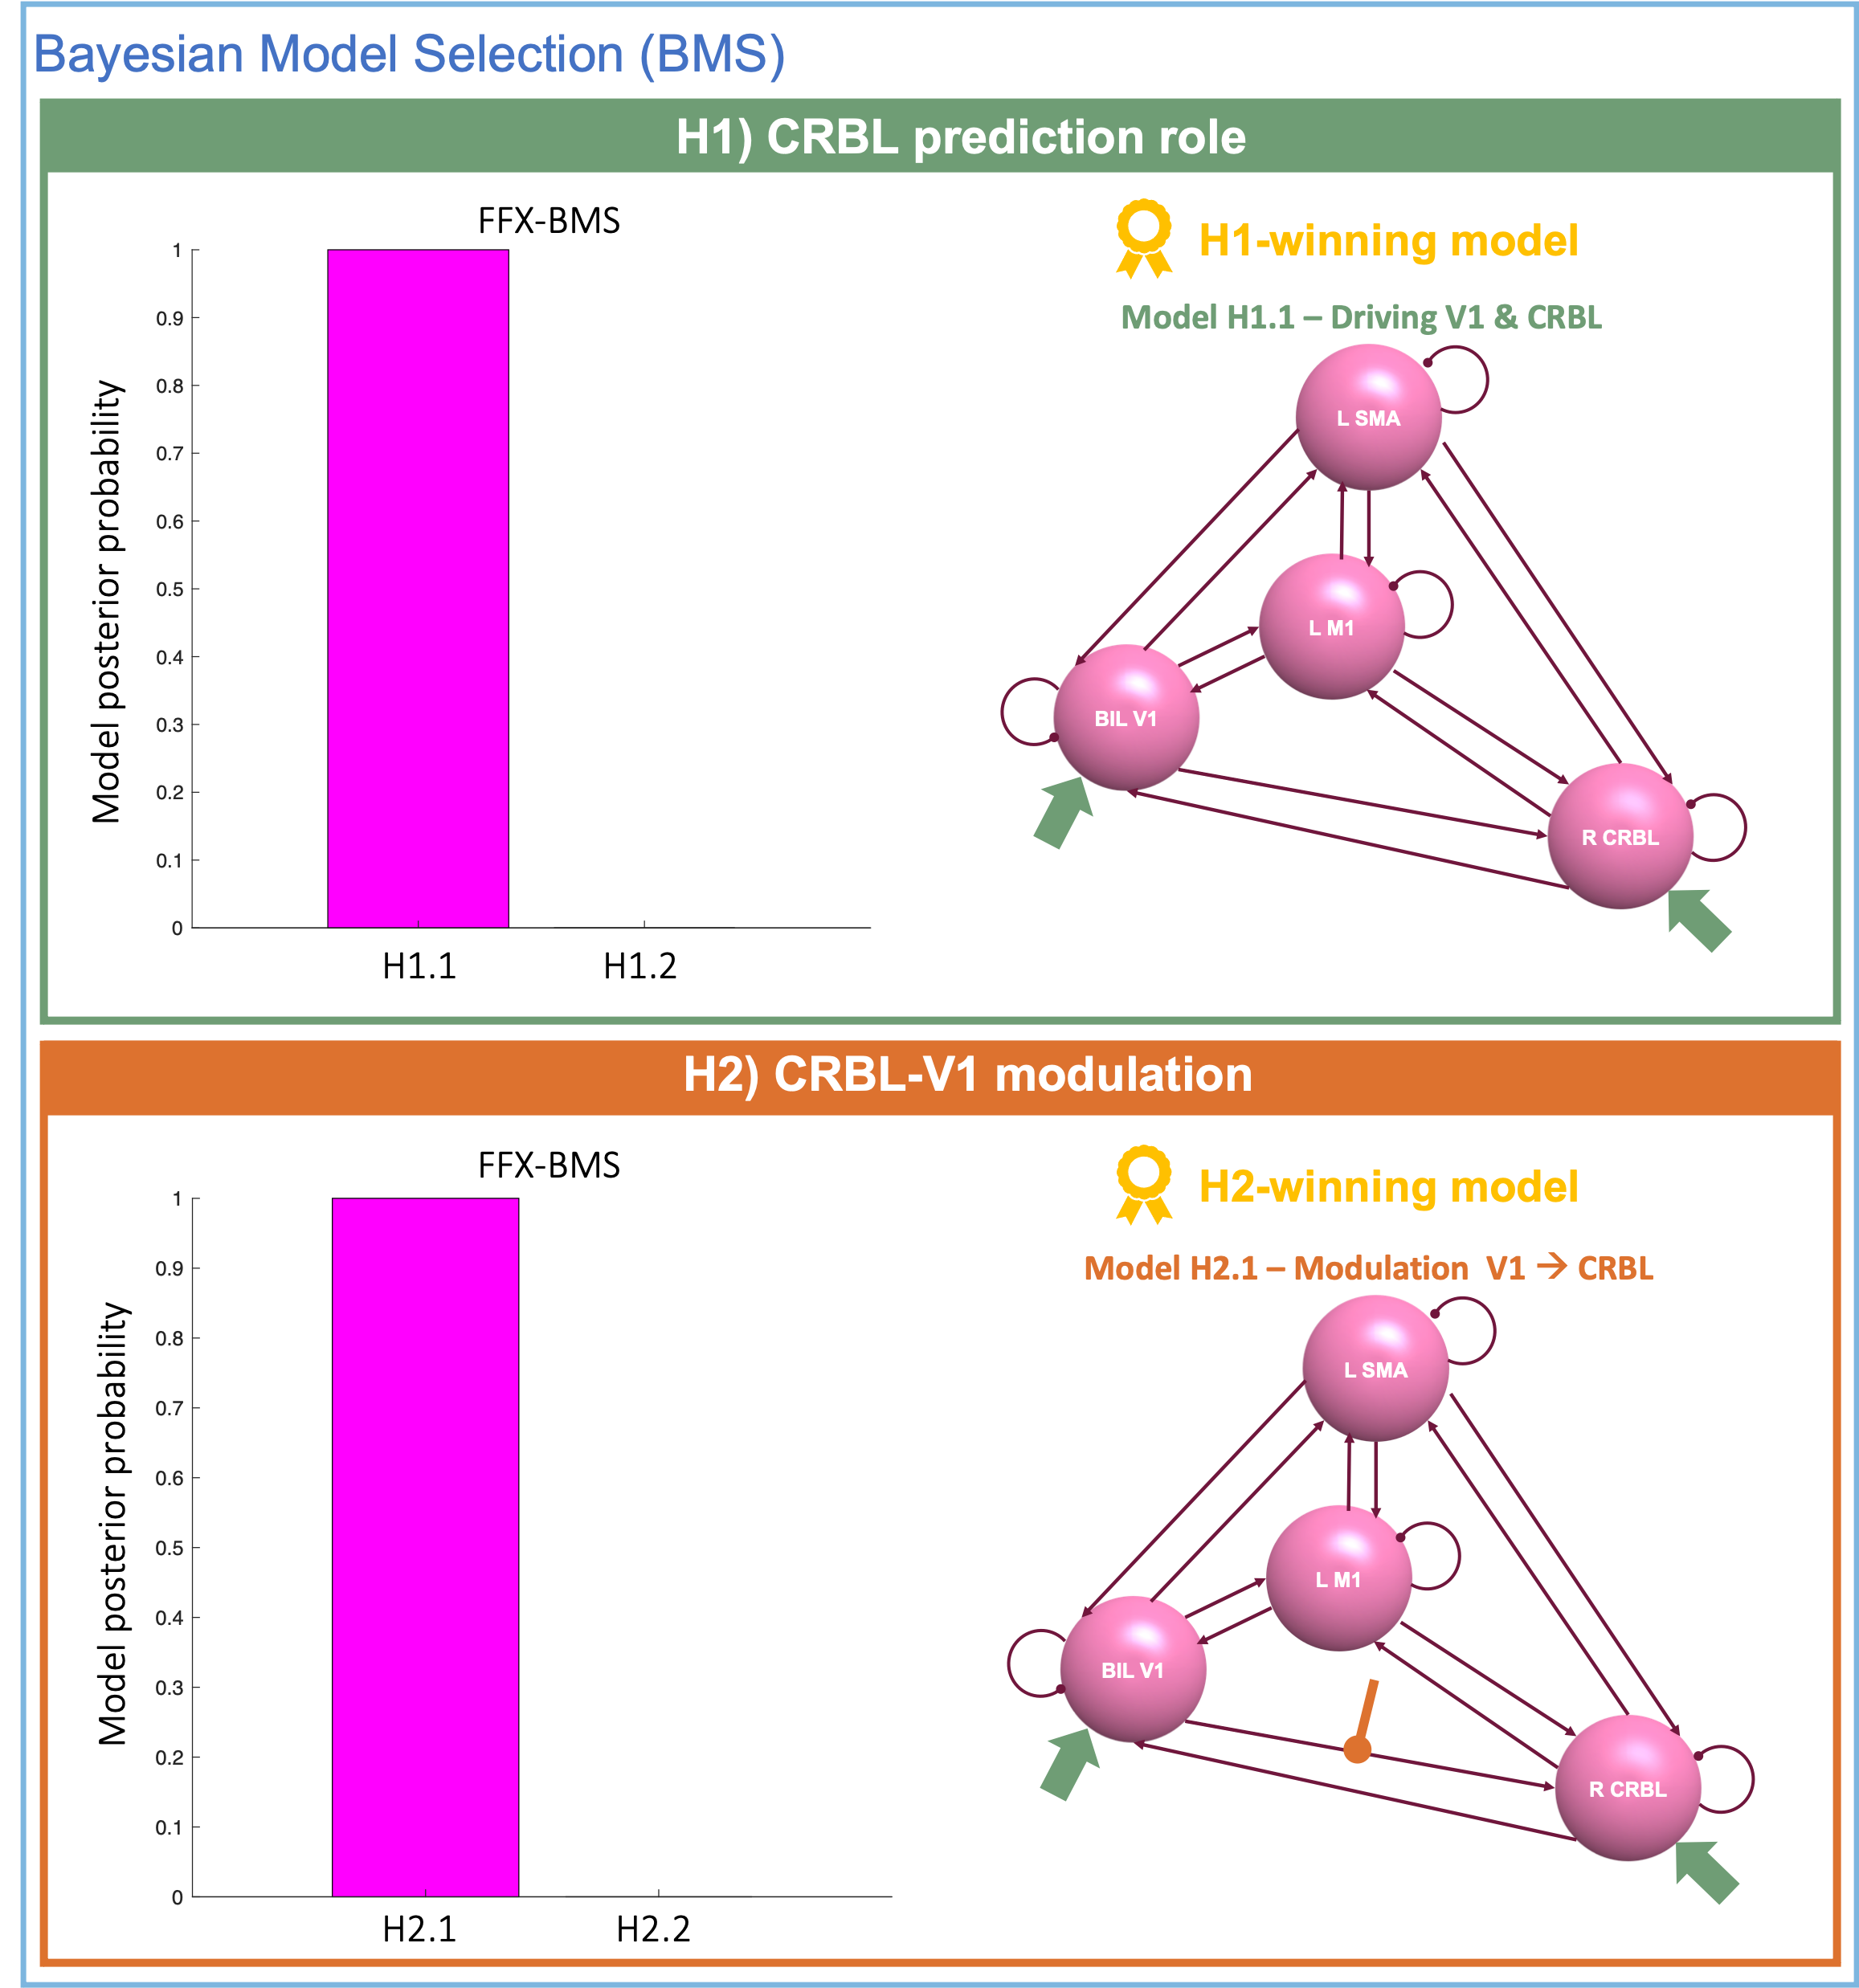
Fig.3 reports FFX-BMS outcomes for H1) and H2). Model posterior probability computed in terms of GBF is almost 1 for Model H1.1 (Fig.3-green box), identifying this model as the “winner” in explaining the experimental time-series. Post-hoc analysis revealed that all connections were important to describe the causal relationship between VOIs. Fig.3-orange box shows that H2.1 represents the best-model both at subject- and group-level.Discussion
H1-winning model(Fig.3-green box) captures the relevance of the cerebellum in predicting AE in the proposed visuomotor task. Furthermore, post-hoc analysis shows that all the cerebro-cerebellum connections (inward and outward) are significant, confirming the relevance of its full effective connectivity with the cortical areas included in our model. H2-winning model(Fig.3-orange box) suggests that in a visuomotor network where both V1 and CRBL are set as driving input, V1 modulates the CRBL activity. Future work is needed to validate our results in a larger cohort of subjects. Further steps will be the expansion of this visuomotor network to include Pre-Motor Cortex, Superior Parietal Lobule and Cingulate Cortex, which are relevant for studying the GF-BOLD non-linearity5,6. Furthermore, to provide a complete overview of the cerebellar impact on the non-linear modulation of the cortical areas, we will extend our hypothesis with the inclusion of 1st and 2nd order as modulatory inputs. Needless to say that this overview on the effective connectivity of the visuomotor network could be of great interest for understanding BOLD variation in neurological disease involving these regions. In addition, we are implementing a biological-realistic cerebellar model, which is still missing from DCM. Once validated, we aim to include the cerebellar-specific equations in this framework, improving the DCM power in studying the effective connectivity of cerebro-cerebellar loops.Acknowledgements
ED and FP receive funding from H2020 Research and Innovation Action Grants Human Brain Project (#785907, SGA2 and #945539, SGA3). ED receives funding from the MNL Project “Local Neuronal Microcircuits” of the Centro Fermi (Rome, Italy). CGWK receives funding from the MS Society (#77), Wings for Life (#169111), Horizon2020 (CDS-QUAMRI, #634541), BRC (#BRC704/CAP/CGW), UCL Global Challenges Research Fund (GCRF), MRC (#MR/S026088/1). CGWK is a shareholder in Queen Square Analytics Ltd. AM receives funding from the Italian Ministry of Health (RC2020).References
1. Friston KJ, Harrison L, Penny W. Dynamic causal modelling. Neuroimage 2003;19(4):1273–1302.Available from: https://linkinghub.elsevier.com/retrieve/pii/S1053811903002027
2. Friston KJ, Preller KH, Mathys C, et al. Dynamic causal modelling revisited. Neuroimage 2019;199(February 2017):730–744.Available from: https://doi.org/10.1016/j.neuroimage.2017.02.045
3. Friston KJ, Kahan J, Biswal B, Razi A. A DCM for resting state fMRI. Neuroimage 2014;94:396–407.Available from: http://dx.doi.org/10.1016/j.neuroimage.2013.12.009
4. Havlicek M, Roebroeck A, Friston KJ, et al. On the importance of modeling fMRI transients when estimating effective connectivity: A dynamic causal modeling study using ASL data. Neuroimage 2017;155(March):217–233. Available from: http://dx.doi.org/10.1016/j.neuroimage.2017.03.017
5. Alahmadi AAS, Samson RS, Gasston D, et al. Complex motor task associated with non-linear BOLD responses in cerebro-cortical areas and cerebellum. Brain Struct. Funct. 2016;221(5):2443–2458.
6. Casiraghi L, Alahmadi AAS, Monteverdi A, et al. I See Your Effort: Force-Related BOLD Effects in an Extended Action Execution–Observation Network Involving the Cerebellum. Cereb. Cortex 2019;29(3):1351–1368.
7. Friston KJ, Litvak V, Oswal A, et al. Bayesian model reduction and empirical Bayes for group (DCM) studies [Internet]. Neuroimage 2016;128:413–431.Available from: http://dx.doi.org/10.1016/j.neuroimage.2015.11.015
Figures