2120
Reducing Between-Subject Variability in Stimulus-Evoked BOLD fMRI Using Breath Hold-Derived Vascular Covariates1Department of Neuroscience, Imaging, and Clinical Sciences, D'Annunzio University of Chieti-Pescara, Chieti, Italy, 2Institute for Advanced Biomedical Technologies, D'Annunzio University of Chieti-Pescara, Chieti, Italy, 3Cardiff University Brain Research Imaging Centre (CUBRIC), School of Psychology, Cardiff, United Kingdom, 4Department of Neurophysics, Max Planck Institute for Human Cognitive & Brain Sciences, Leipzig, Germany, 5Physical Therapy and Human Movement Sciences, Feinberg School of Medicine, Northwestern University, Chicago, IL, United States, 6MS Centre, Neurology Unit, SS. Annunziata University Hospital, Chieti, Italy, 7Division of Psychological Medicine and Clinical Neurosciences, School of Medicine, Cardiff University, Cardiff, United Kingdom, 8Helen Durham Centre for Neuroinflammation, University Hospital of Wales, Cardiff, United Kingdom
Synopsis
The representation of changes in neural activity by blood oxygenation level-dependent (BOLD) fMRI is affected by vascular properties including cerebral blood volume (CBV) and cerebral vascular reactivity (CVR). Here, we investigate these factors using a breath-hold BOLD fMRI experiment. We show that a group-level correction of the stimulus-evoked BOLD fMRI signal by these vascular properties reduces between-subject variability and improves sensitivity to the task response. Notably, correcting with a marker of relative CBV does not require individual recordings of exhaled carbon dioxide (in contrast with CVR) and resulted in the highest increase in sensitivity to the task.
Introduction
The signal measured in a blood oxygenation level-dependent (BOLD) contrast fMRI experiment reflects changing neural activity through its coupling to local cerebral blood flow (CBF). However, the representation of neural activity is modulated by local vascular properties. These include the BOLD-sensitive cerebral blood volume (CBV) and cerebral vascular reactivity (CVR), which is the relative increase in CBF in response to a vasodilatory stimulus. CVR can be probed using carbon dioxide (CO2) manipulations through, for example, breath-holding. In a breath-hold (BH) BOLD fMRI experiment, parametric maps of CVR are calculated based on the measured trace of exhaled CO2.1 However, this approach quantifies CVR in terms of voxel-wise BOLD signal rather than relative change in CBF, with its own dependence on CBV, and also relies on accurate quantification of end-tidal CO2, which can be experimentally challenging. Here, we investigate an alternative approach to account for variability in the local BOLD response using a BOLD-sensitive relative CBV (rCBV) marker. The rCBV marker represents the ratio of the voxel-wise BH-induced BOLD signal change to that induced in the superior sagittal sinus (SSS), where CBV approaches 1. Here, we compare the use of a BH BOLD-CVR covariate with our proposed rCBV-weighted covariate in accounting for inter-subject variability in the BOLD fMRI response to a visuomotor task.Methods
Twenty-seven healthy subjects (38.1±11.0 years old, fifteen females) underwent MRI on a GE Signa HDx 3 T system (GE Medical Systems, WI, US) using an 8-channel head coil. The MRI protocol included structural T1-weighted, stimulus-evoked and BH BOLD fMRI, and B0 inhomogeneity field map acquisitions with the parameters shown in Table 1.During BOLD fMRI, subjects performed a serial reaction time (SRT) task in which the position of a visual stimulus was localised by pressing the corresponding key on a four-key keypad.2 The task comprised Sequence (16 s), Random (16 s) and Rest blocks (15 s). Sequence blocks included four repeats of eight stimuli. One Random block was presented every three Sequence blocks. Rest blocks presented a static image matching the task.
During BH-BOLD fMRI (total duration=250 s), subjects were instructed to perform a BH consisting of four 15-s BH repeats interleaved with 35-s recovery periods. Continuous CO2 partial pressure signals were measured in the expired air via a nasal cannula from which end-tidal CO2 partial pressure (PetCO2) was estimated.
BH-BOLD fMRI images were motion-corrected using MCFLIRT,3 expressed as fractional BOLD changes relative to their temporal mean, high-pass (60 s) gaussian filtered and aligned with the MNI template using FNIRT.3 CVR maps expressed as BOLD signal percent change per unit of PetCO2 were then calculated using the General Linear Model framework using the subject-wise PetCO2 traces as a regressor.
To provide a marker of local rCBV, a region of interest (ROI) was manually delineated in the posterior SSS based on the T1-weighted image and aligned with the BH fMRI image using FLIRT.3 Grey matter segmentations were obtained from the T1-weighted images using FAST4. Parametric maps of rCBV were calculated as follows. To mitigate partial volume effects in the SSS, the voxel-wise BH-BOLD signal within the SSS was regressed against the mean grey matter BH-BOLD signal. Based on this analysis, the average BH-BOLD signal (SSSBH-BOLD) was calculated from the high covarying voxels (≥90th percentile). Relative CBV maps were calculated by regressing the whole-brain voxel-wise BH-BOLD signal change against SSSBOLD-BH.
Task BOLD fMRI images were analysed using FEAT.5,6 Subject-level analyses were performed by modelling the BOLD signal with a block task regressor plus its temporal derivative.7 Group-level analyses were performed using three models: the first modelled the task response; the second (SRT+covrCBV) and third (SRT+covCVR) modelled the task response and added the individual rCBV or CVR maps as voxel-dependent covariates. To assess the extent of brain activation in the motor cortex (precentral gyrus), for each model, group Z-score statistical maps were compared at increasing thresholds (Z=3, 3.5, 4, 4.5 and 5).
Results
Figure 1 shows the mean and standard deviation (SD) of the CO2 traces (A) and SSSBH-BOLD signals (B) across subjects during the repeated breath-holding. Both group-level corrections for vascular covariates (SRT+covrCBV and SRT+covCVR) increased the significance of activation to the task in the motor cortex at superior levels, where the largest increase was observed in SRT+covrCBV (Figure 2A). Moreover, the rCBV covariate showed a spatially larger and stronger correlation with the task response (Figure 2B). Finally, both SRT+covrCBV and SRT+covCVR resulted in larger areas of activation compared to SRT (Figure 3A), where SRT+covrCBV had the largest increase reflecting the larger area of association with the task response (Figure 3B).Discussion and Conclusion
The improved sensitivity of group-level fMRI when using SRT+covrCBV and SRT+covCVR agreed with previous results demonstrating that correction for BH responsiveness or vascular reactivity increases the spatial extent and statistical significance of detected activation.1 The larger improvement in sensitivity observed when using SRT+covrCBV compared to SRT+covCVR suggests that an SSS-derived CBV marker, which does not require recording end-tidal CO2, may offer a more robust way to account for local vascular properties than BOLD-CVR measurements relying on CO2 recordings. This finding may reflect the effect of inter-subject variation in end-tidal CO2 recordings, which can be heavily influenced by erroneous readings in practice.Acknowledgements
The study was supported by the MS Society UK. This work was partially conducted under the framework of the Departments of Excellence 2018–2022 initiative of the Italian Ministry of Education, University and Research for the Department of Neuroscience, Imaging and Clinical Sciences (DNISC) of the University of Chieti-Pescara, Italy. This project was partially supported by the UK Engineering and Physical Sciences Research Council (EP/S025901/1).References
- Murphy, K., Harris, A.D., Wise, R.G., 2011. Robustly measuring vascular reactivity differences with breath-hold: Normalising stimulus-evoked and resting state BOLD fMRI data. Neuroimage 54, 369–379
- Lipp, I., Foster, C., Stickland, R., Sgarlata, E., Tallantyre, E.C., Davidson, A.E., Robertson, N.P., Jones, D.K., Wise, R.G., Tomassini, V., 2021. Predictors of training-related improvement in visuomotor performance in patients with multiple sclerosis: A behavioural and MRI study. Mult. Scler. J. 27, 1088–1101
- Jenkinson, M., Bannister, P., Brady, J. M., Smith, S. M. Improved Optimisation for the Robust and Accurate Linear Registration and Motion Correction of Brain Images. NeuroImage, 17(2), 825-841, 2002
- Woolrich, M.W., Ripley, B.D., Brady, M., Smith, S.M., 2001. Temporal autocorrelation in univariate linear modeling of FMRI data. Neuroimage 14, 1370–1386
- Woolrich, M.W., Behrens, T.E.J., Beckmann, C.F., Jenkinson, M., Smith, S.M., 2004. Multilevel linear modelling for FMRI group analysis using Bayesian inference. Neuroimage 21, 1732–1747
- Friston, K.J., Fletcher, P., Josephs, O., Holmes, A., Rugg, M.D., Turner, R., 1998. Event-related fMRI: characterizing differential responses. Neuroimage 7, 30–40
Figures

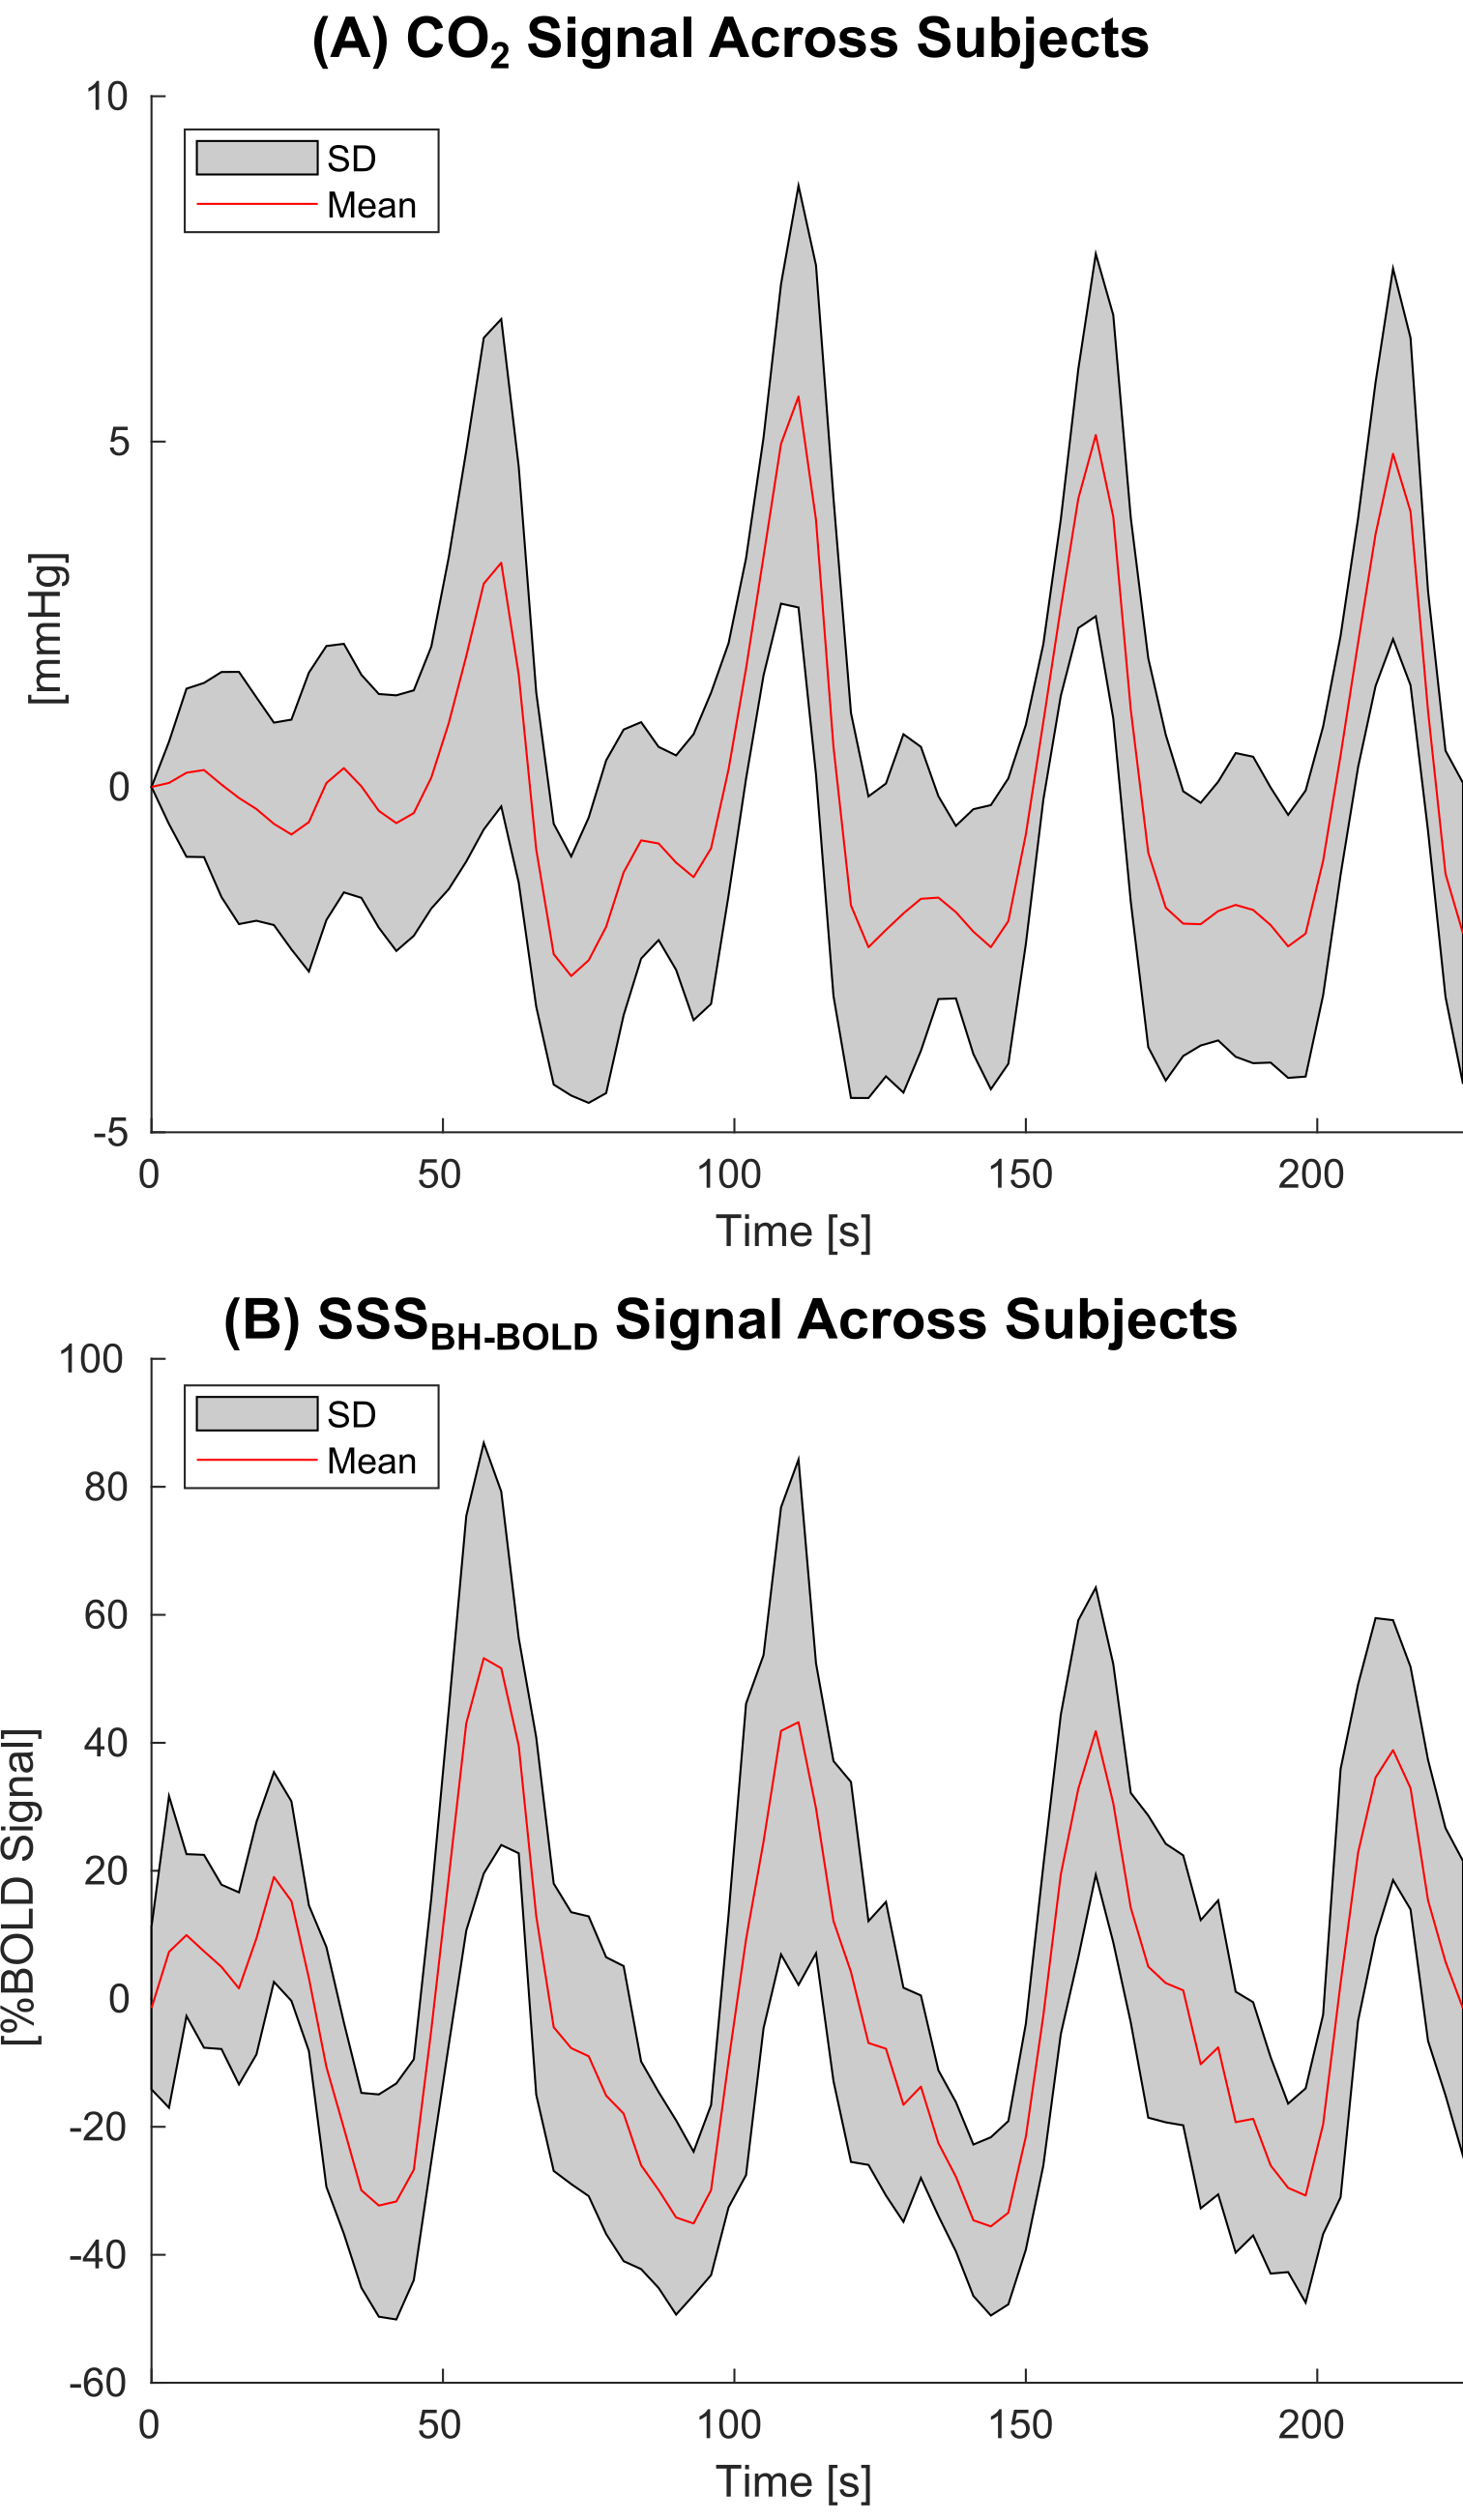
Figure 1. Temporal means and standard deviations (SDs) of the CO2 signal (A) and breath hold-BOLD fMRI signal in the SSS (B) across subjects during the repeated breath-hold paradigm. The CO2 trace is expressed in mmHg of PetCO2, whereas the SSS trace is expressed in percentage change of BOLD fMRI signal
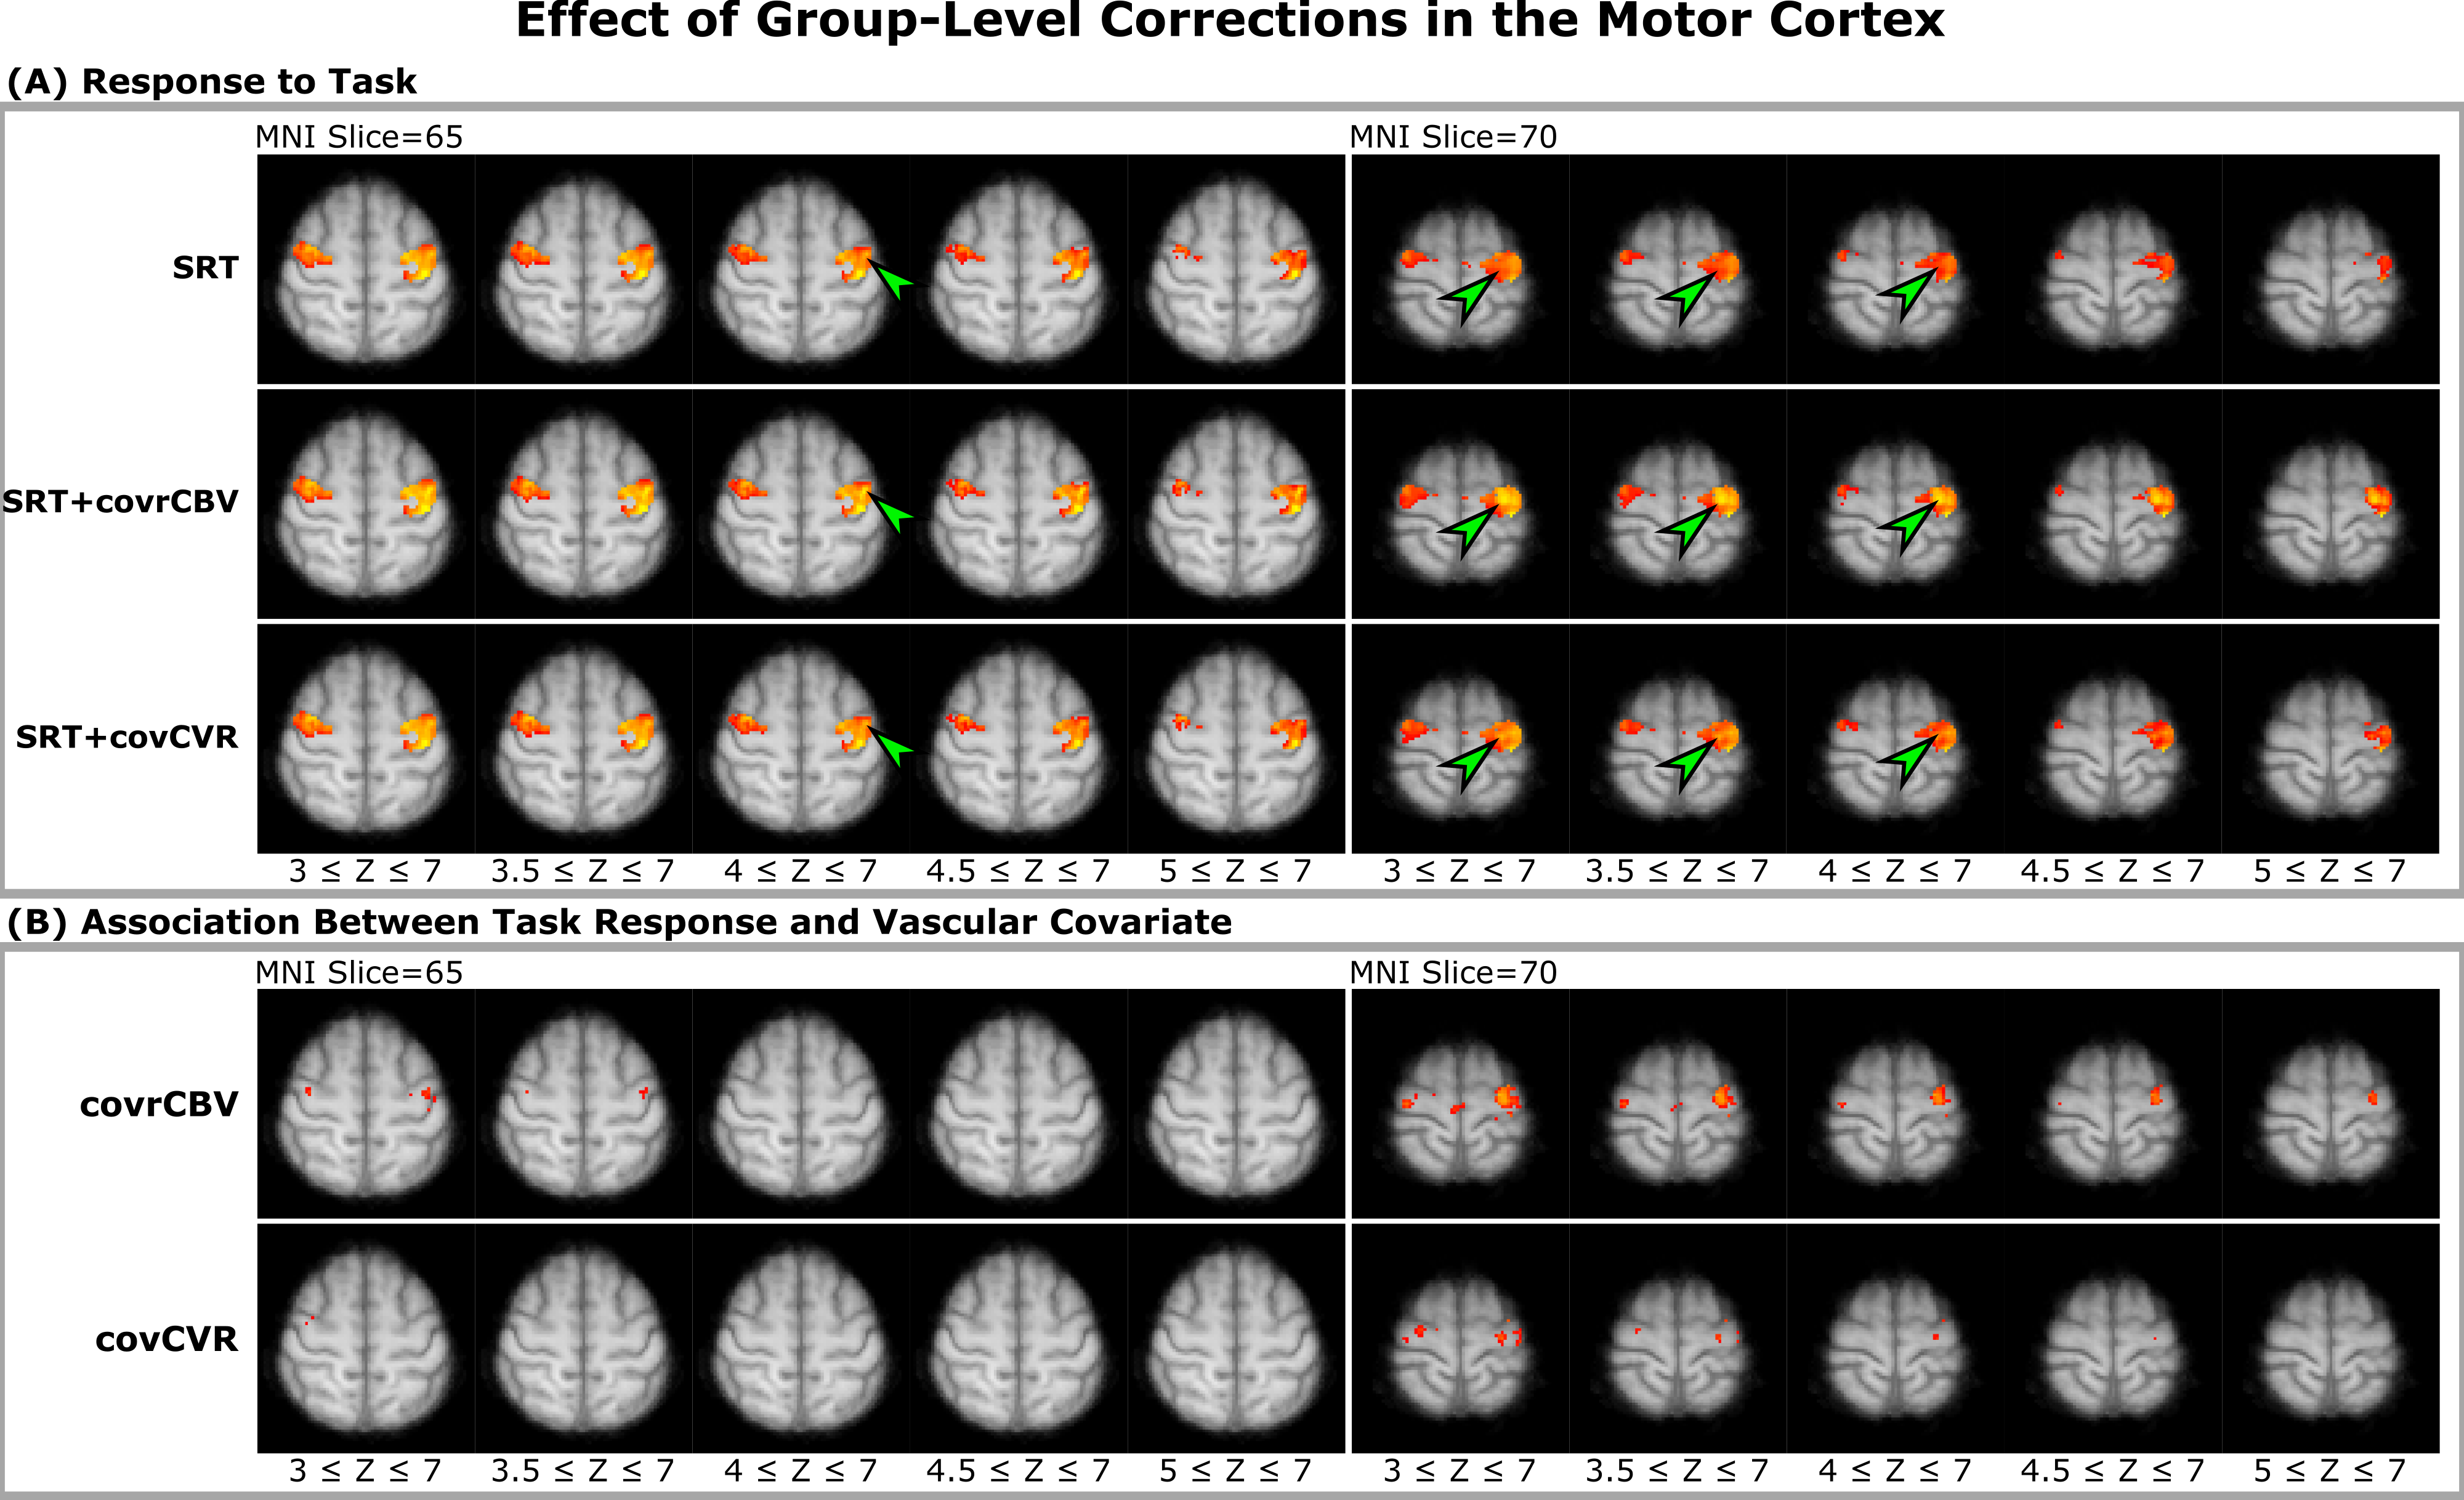
Figure 2. Stimulus-evoked BOLD fMRI response. In the same two MNI slices, the Z-score maps corresponding to the task response (A) and the association between task response and each vascular covariate (B) are shown at increasing significance threshold levels. In panel A, arrowheads point at example locations of Z-score increase when correcting for vascular covariates. Z-scores are represented using a red-yellow scale, where lower values are in red and higher values in yellow
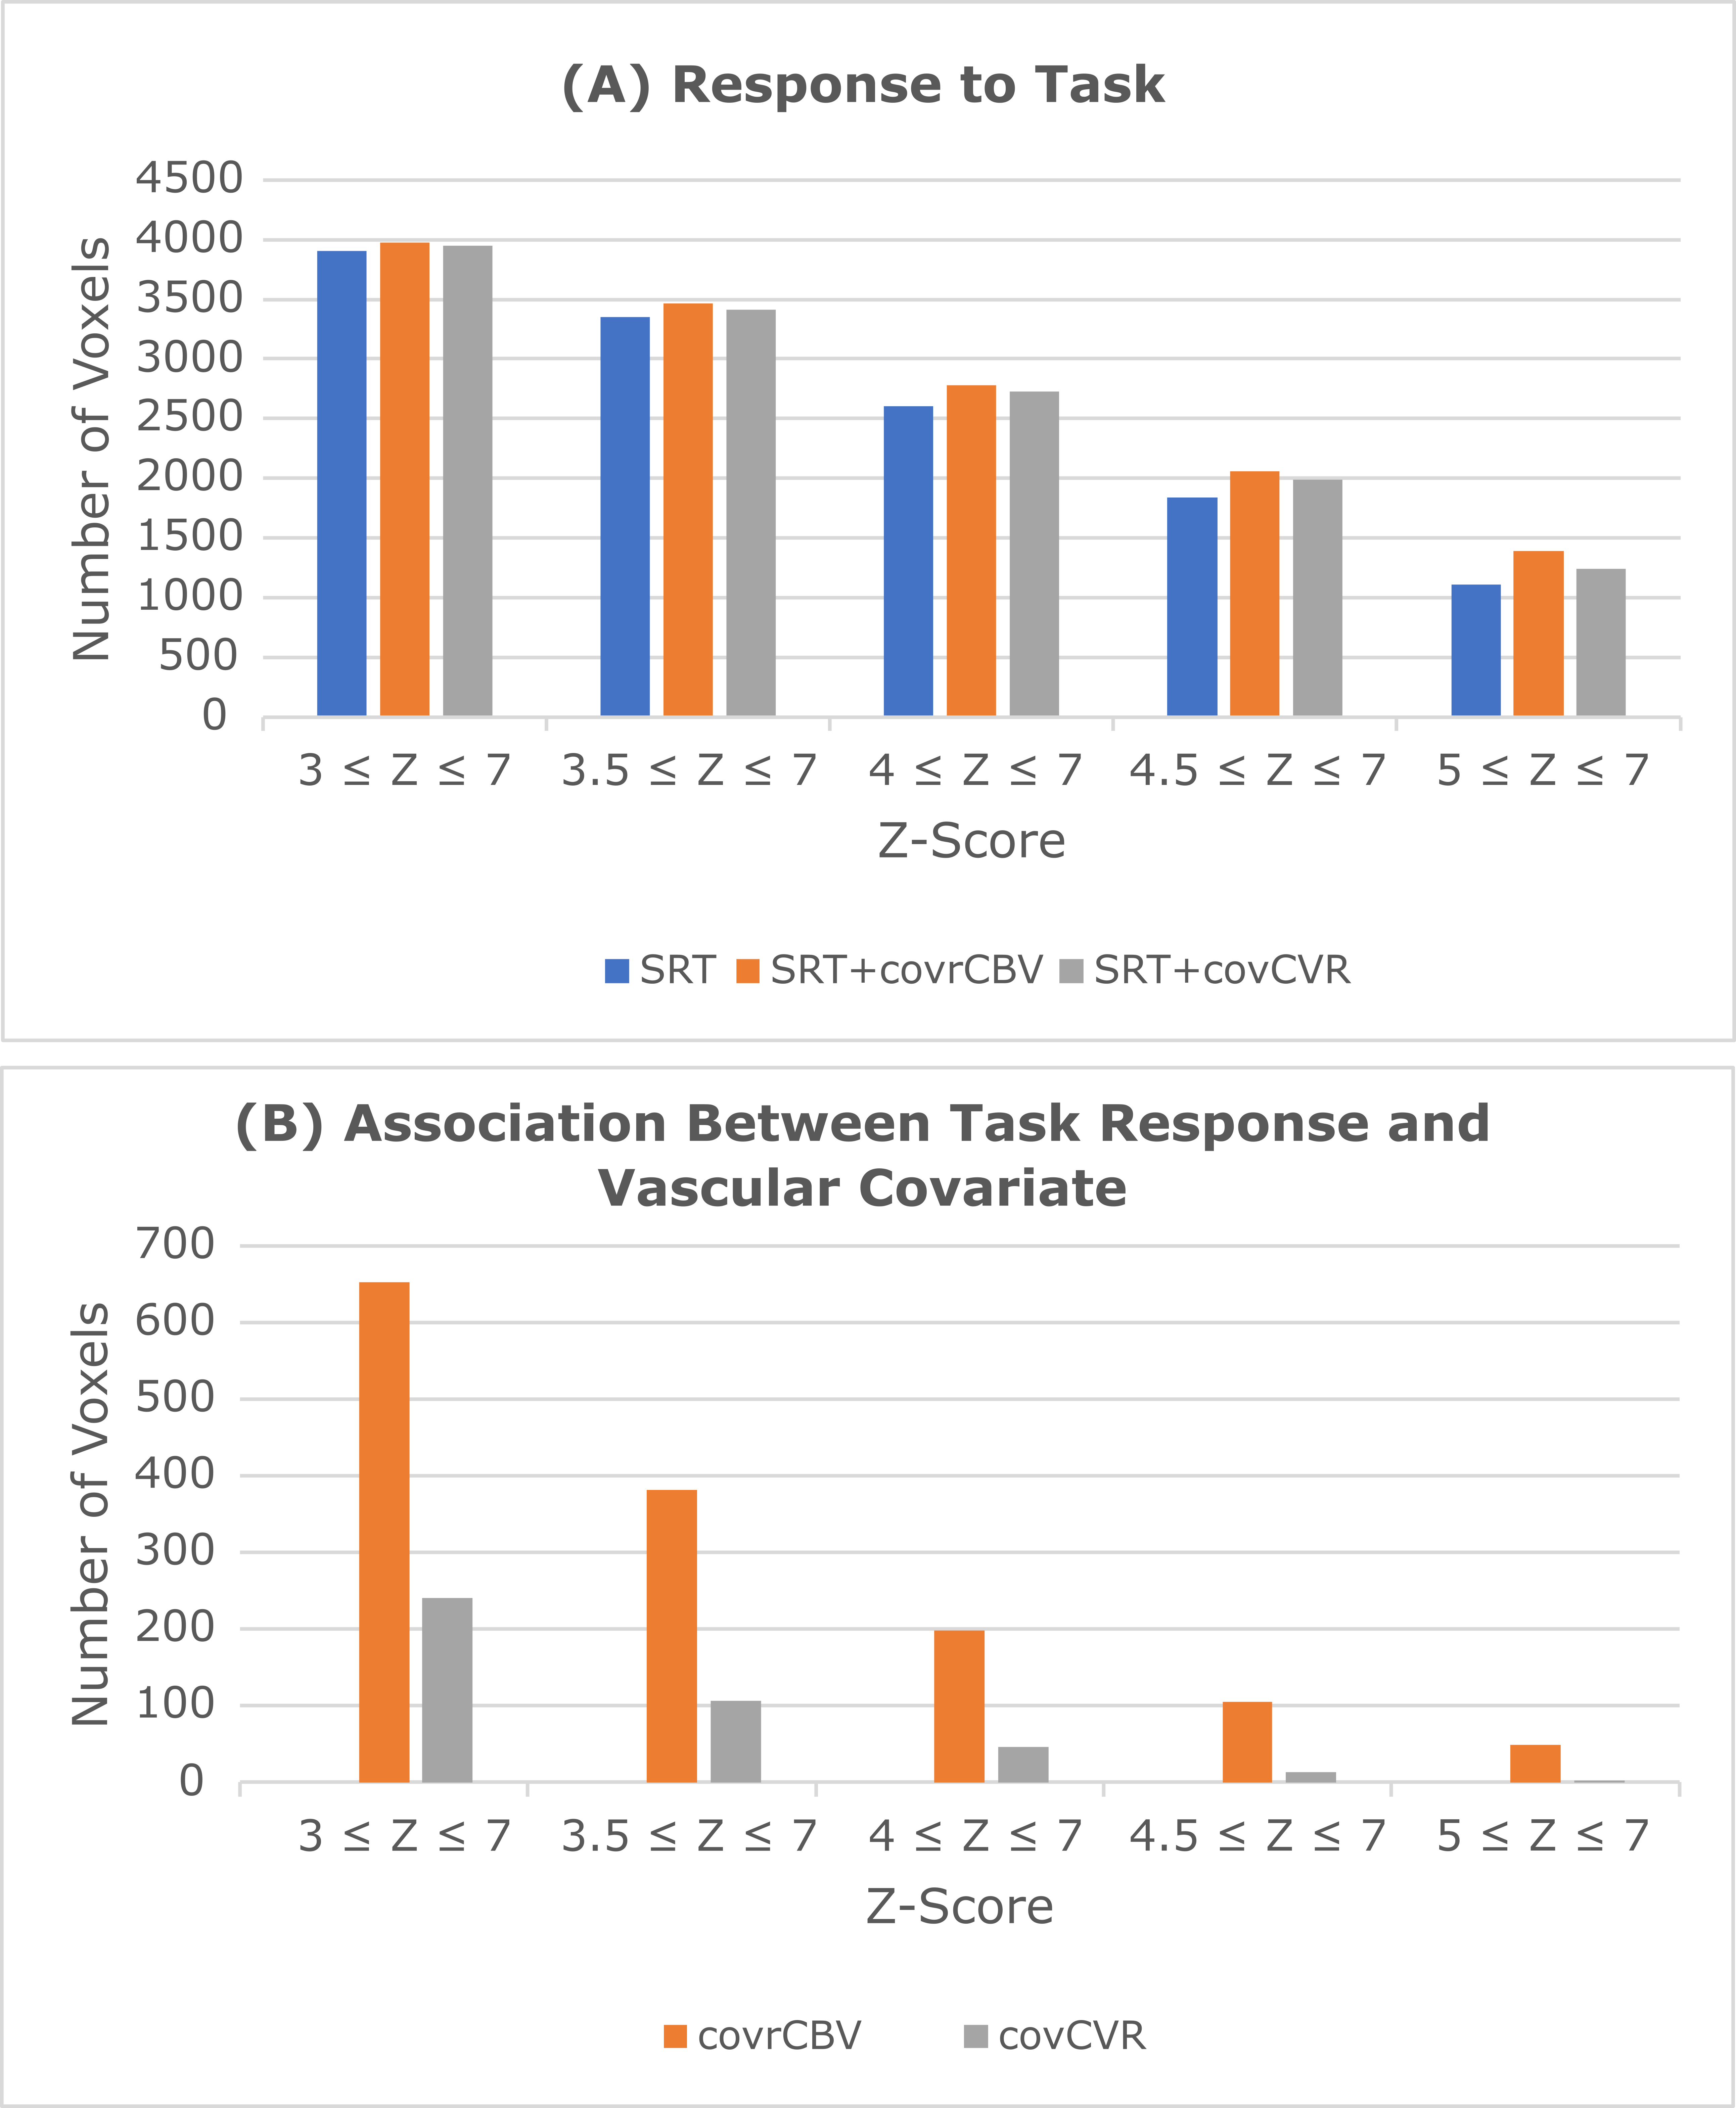
Figure 3. The spatial extent of stimulus-evoked BOLD fMRI response. The number of voxels in the Z-score maps corresponding to the task response (A) and the association between task response and each vascular covariate (B) are shown at increasing significance threshold levels