2117
Effects of Autonomic Activity on Brain Fluid Pulsations1NINDS, NIH, Bethesda, MD, United States
Synopsis
According to recent research, slow waves may increase metabolic waste clearance during sleep, possibly through cerebrospinal fluid (CSF) pulsatile movement. Pulsations can also be caused by direct pressure effects from the cardiac and respiratory cycles, such as deep breaths. To examine this possibility, we designed a cued deep breathing experiment, which was previously demonstrated to result in widespread fMRI global signal reductions. In this work, our findings point to an alternative pathway for the creation of CSF pulsations that relies on autonomic changes rather than sleep.
Introduction
Recent research suggests that sleep slow waves may facilitate the removal of metabolic waste through cerebrospinal fluid (CSF) pulsatile movement triggered by cerebral blood volume (CBV) changes associated with the neurovascular response (1). However, there are alternative mechanisms that lead to CBV changes, including cerebral autoregulation. For example, sympathetic activity and CO2-mediated vasoaction following deep inspiration lead to momentary CBV reduction and a drop in fMRI global signal (GS) (2, 3); one would expect these to be accompanied by the pulsatile flow of CSF. To investigate this possibility, we monitored GS changes and CSF flow near the cerebral aqueduct in control subjects performing a respiratory task in a 7 T MRI scanner.Methods
24 subjects were part of this experiment and 15 of them consistently complied with the respiratory task as judged from the respiratory belt signals. Of these, 11 subjects (age range = 21-32, f/m = 7/4) had sufficient fMRI brain coverage to include the CSF in the fourth ventricle or the cerebral aqueduct, and were included in the analysis. Respiratory challenge: Subjects were visually instructed to take a brief deep breath at specific times (10 s, 50 s, 130 s, 170 s, etc., with alternating 80 s and 40 s intervals), while being kept awake with a continuous visual task during a 12.5-minute fMRI experiment at 7 T. Data were collected with 2 mm isotropic resolution, TR = 2 s, TE = 30 ms, FA = 700). Respiration, heart rate, and sympathetic effects on vascular tone were measured with a chest belt and finger skin photoplethysmography (PPG). fMRI preprocessing: FMRI data were preprocessed using the AFNI software (Cox, 1996) and a version of the “afni_proc” pipeline. It included the removal of image intensity outliers and slow polynomial trends as well as two harmonics of the cardiac and respiratory signals from a modified RETROICOR model (4); furthermore, slice-timing correction, motion correction, and non-linear alignment to the Talairach template were performed. Finally, the estimated motion parameters and their derivatives were regressed out of the data while censoring any outliers of motion larger than 0.3 mm or 0.3 degrees. Chest belt and PPG were used to derive measures of respiratory flow rate (RFR) and peripheral vascular volume (PVV, amplitude of the PPG signal) (5), respectively. Cross-correlations were performed between autonomic and fMRI signals, i.e., voxel-by-voxel data, forebrain signal (global signal, GS), and CSF ROI data. Statistical analyses: To test the statistical significance of group level cross-correlations we estimated a 95 % confidence interval based on percentiles (corrected for multiple comparisons via Bonferroni correction, number of comparisons = number of TRs corresponding to the 45 s range investigated) of an empirical null distribution. We created the null distribution by computing and pooling all lagged cross-correlations. This is performed after converting Pearson’s r to Fisher’s z, and for each of the vector pairs by circular shifting but excluding lags of interest. As the respiratory experiment had a paradigm with 40 s periodicity, inducing cyclic fluctuations, we excluded 20 s data segments around the expected correlation peaks.Results
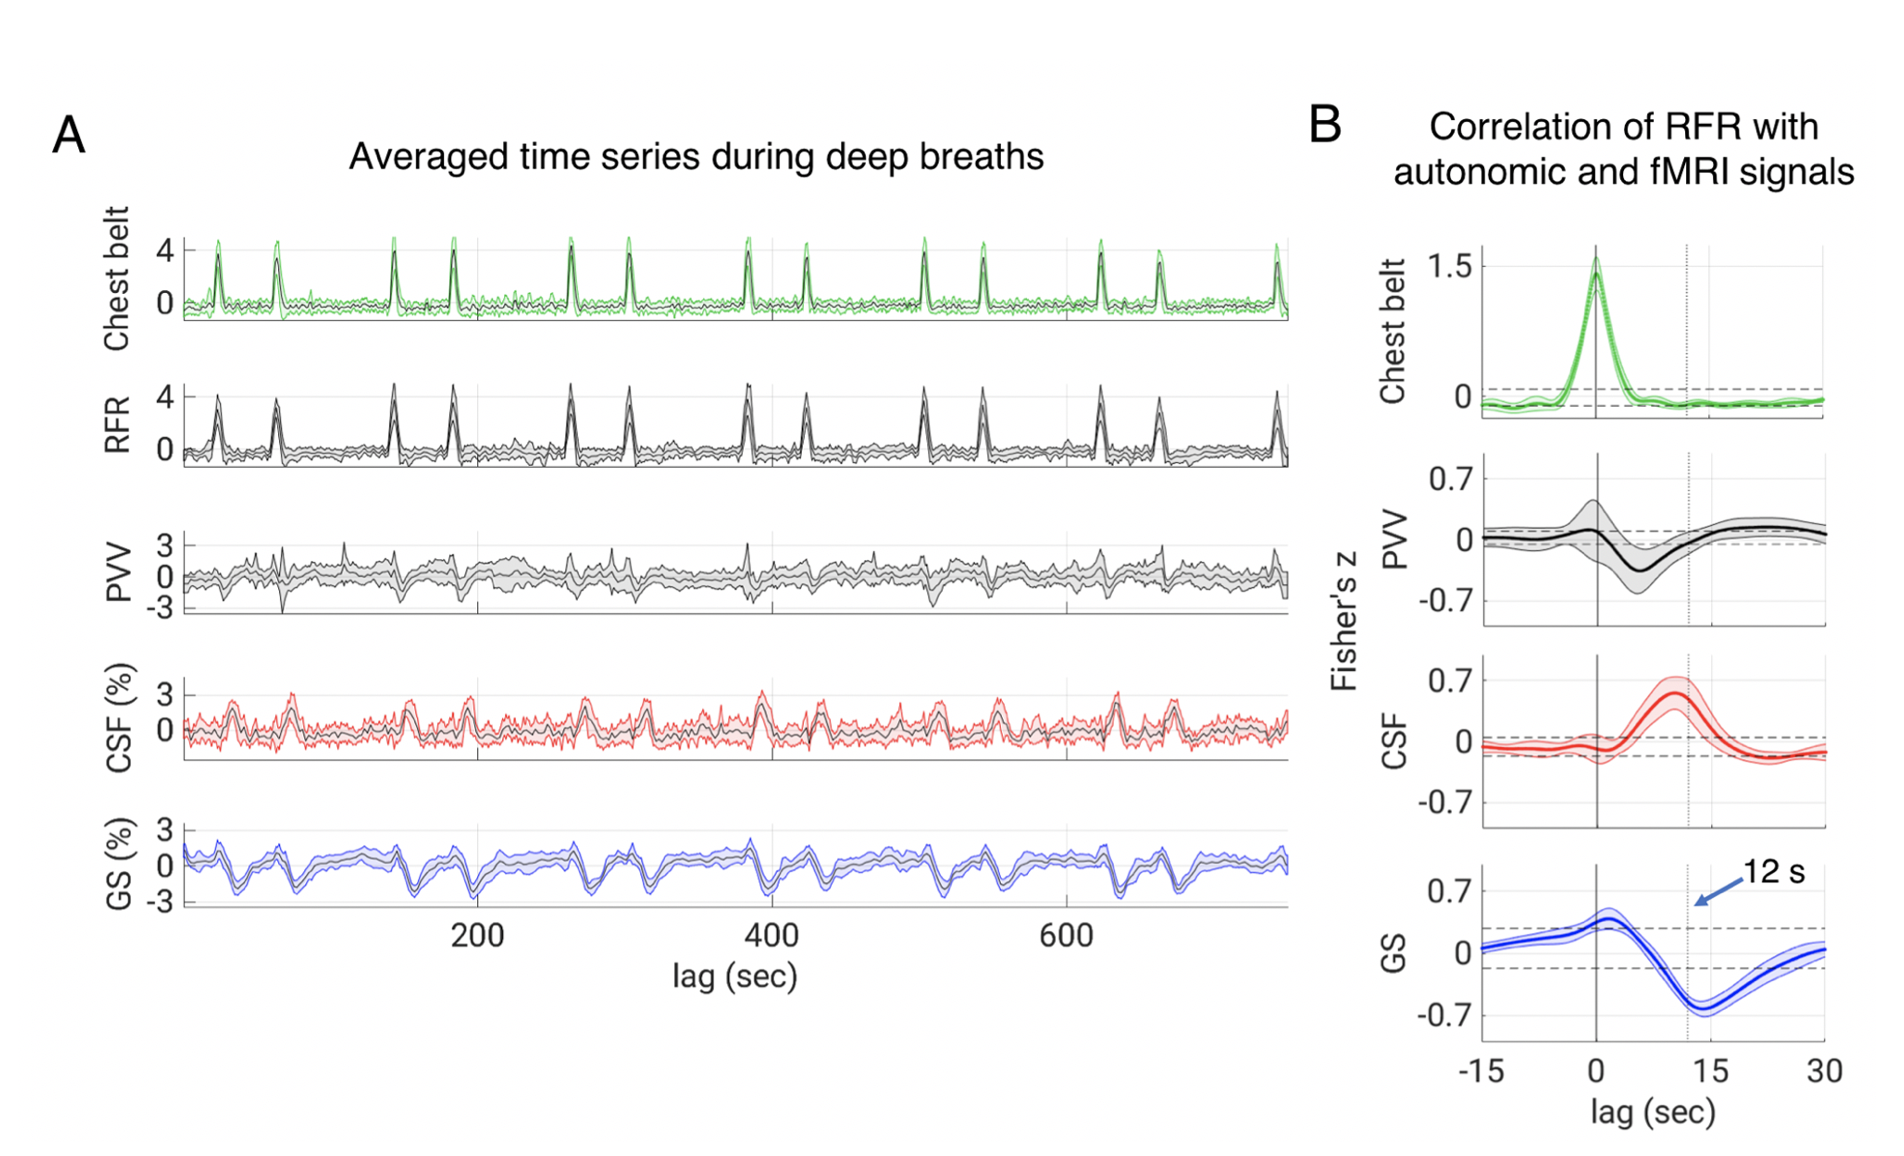
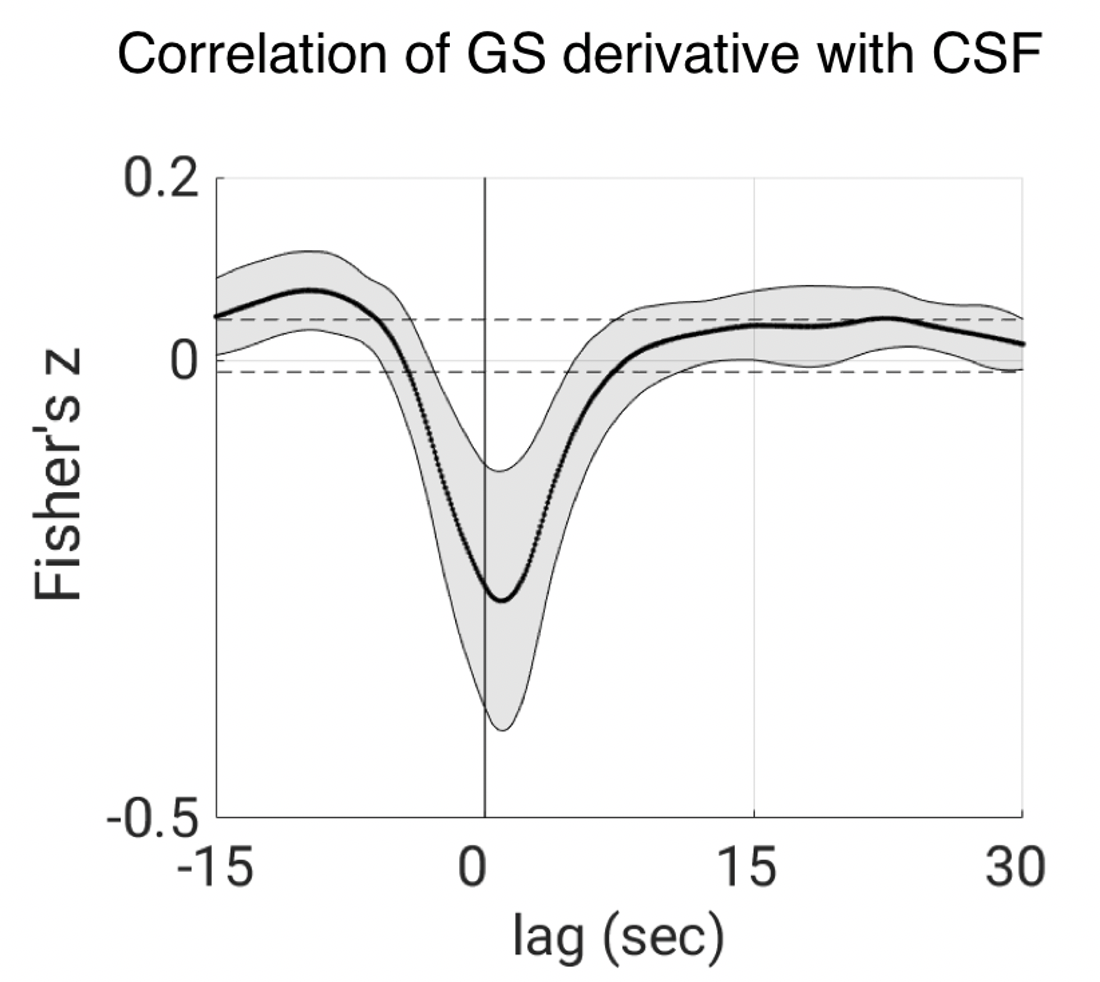
Increases in RFR were accompanied by PPG amplitude drops, GS decreases, and CSF signal increases (Figs. 1-2). The latter were resulting from the CSF flowing into the cranium, replacing the loss in CBV, and creating an inflow effect in the most inferior slices of the slice stack. A pattern of fMRI signal changes was observed (Figs. 3) that resembled the one previously seen after K-complexes/Type I Slow Waves during nonrapid eye movement stage 2 sleep (light) sleep (6). GS amplitude reductions (averaged across subjects = -1.9 ± 0.7%) were observed following deep inspirations. Peak GS drops following a deep breath occurred at correlation lags in the range of 13.2-14.8 s, similar to the range of around 10-15 s reported previously (2, 7). A strong negative correlation was found between the temporal derivative of GS and CSF near 0-lag (Fig. 4), as observed during light sleep (1). These results indicate that CSF pulsations resulting from the action of vascular smooth muscle cells (myoactive) are not specific to sleep, do not require cortical activity, and may simply result from autonomic events, either through changes in RFR, or through sympathetic vasoconstriction.Conclusions
CSF pulsations may result from autonomic changes without requiring slow electro-cortical activity (i.e., K-complexes/Type I Slow Waves), or sleep. This mechanism is in addition to previously reported mechanisms, including a neurovascular one, and barogenic mechanisms associated with cardiac and respiratory cycles. The relative contribution of these various mechanisms to CSF mixing and flow, and any relevance to brain waste clearance, remain to be investigated.Acknowledgements
No acknowledgement found.References
1. Fultz NE, Bonmassar G, Setsompop K, Stickgold RA, Rosen BR, Polimeni JR, et al. Coupled electrophysiological, hemodynamic, and cerebrospinal fluid oscillations in human sleep. Science. 2019;366(6465):628-31.
2. Birn RM, Smith MA, Jones TB, Bandettini PA. The respiration response function: the temporal dynamics of fMRI signal fluctuations related to changes in respiration. Neuroimage. 2008;40(2):644-54.
3. Bright MG, Bulte DP, Jezzard P, Duyn JH. Characterization of regional heterogeneity in cerebrovascular reactivity dynamics using novel hypocapnia task and BOLD fMRI. Neuroimage. 2009;48(1):166-75.
4. Glover GH, Li TQ, Ress D. Image-based method for retrospective correction of physiological motion effects in fMRI: RETROICOR. Magn Reson Med. 2000;44(1):162-7.
5. Özbay PS, Chang C, Picchioni D, Mandelkow H, Moehlman TM, Chappel-Farley MG, et al. Contribution of systemic vascular effects to fMRI activity in white matter. Neuroimage. 2018;176:541-9.
6. Özbay PS, Chang C, Picchioni D, Mandelkow H, Chappel-Farley MG, van Gelderen P, et al. Sympathetic activity contributes to the fMRI signal. Communications Biology. 2019;2(1):421.
7. Chang C, Glover GH. Relationship between respiration, end-tidal CO2, and BOLD signals in resting-state fMRI. Neuroimage. 2009;47(4):1381-93.
Figures