2115
Detection of fast responses in diffusion fMRI of the human visual cortex through reduced vascular contamination
Shota Hodono1,2, Jonathan R Polimeni3,4, and Martijn A Cloos1,2
1Centre for Advanced Imaging,The University of Queensland, Brisbane, Australia, 2ARC Training Centre for Innovation in Biomedical Imaging Technology, The University of Queensland, Brisbane, Australia, 3Athinoula A. Martinos Center for Biomedical Imaging, Department of Radiology, Harvard Medical School, Massachusetts General Hospital, Charlestown, MA, United States, 4Division of Health Sciences and Technology, Massachusetts Institute of Technology, Cambridge, MA, United States
1Centre for Advanced Imaging,The University of Queensland, Brisbane, Australia, 2ARC Training Centre for Innovation in Biomedical Imaging Technology, The University of Queensland, Brisbane, Australia, 3Athinoula A. Martinos Center for Biomedical Imaging, Department of Radiology, Harvard Medical School, Massachusetts General Hospital, Charlestown, MA, United States, 4Division of Health Sciences and Technology, Massachusetts Institute of Technology, Cambridge, MA, United States
Synopsis
A key feature of the diffusion-weighted fMRI (
Introduction
All conventional functional MRI (fMRI) methods infer brain activation indirectly through observing the associated hemodynamic changes1,2,3,4, which limits their ability to localize neuronal activity in space and time5,6,7,8. Therefore, there is considerable interest in contrast mechanisms that might detect neural activity more directly. One such possible mechanism is diffusion-weighted fMRI (DfMRI), which aims to infer neuronal activation by probing changes in neuron size (“cell swelling”) during firing9. A key feature of the DfMRI response is that it can detect activation with an earlier onset compared to the hemodynamic response measured with spin-echo Blood Oxygenation Level Dependent (SE-BOLD), which was taken as evidence that the DfMRI signal can track an aspect of neural activation that is distinct from hemodynamics10,11,12. However, despite considerable efforts, many have found it challenging to detect this early onset or otherwise reliably differentiate the DfMRI and SE-BOLD responses13,14,15,16,17,18,19,20, with some evidence pointing towards a significant hemodynamic contribution to the DfMRI signal19,20. Motivated by this, our goal was to revisit this question and leverage modern fMRI hardware and acquisition approaches to reduce unwanted hemodynamic contributions to the DfMRI signal then attempt to detect the early onset. We hypothesized that the early onset of the DfMRI response might be more apparent if intrinsic T2’ BOLD contributions could be reduced by minimizing the EPI echo train length21,22.Methods
The study was approved by the local human research ethics committee in accordance with national guidelines. Four healthy volunteers were scanned at 3T (Prisma, Siemens, Germany) using a 64-channel head coil. Functional data were acquired using a twice-refocused diffusion-weighted SE-EPI sequence (b=1800s/mm2)23. To minimize the duration of the diffusion preparation, the diffusion gradients were uniformly distributed over three axes. We compared these data with an identical protocol without diffusion weighting (b=0), single and twice refocused, to provide SE-BOLD contrast. We designed our protocol around the approximate optimal echo-time for SE-BOLD at 3T (TE=75ms)24. We then minimized the EPI echo train length (12.5ms) using a moderate resolution acquisition (3x3x3mm3) and high in-plane acceleration factor (GRAPPA=3) and a high readout bandwidth (2500Hz/pixel) to minimize T2’ effects during the readout21,22.The visual stimulus consisted of a flickering checkerboard (8Hz: 10/30s ON/OFF). Each run lasted 8.5min collecting 510 volumes (volume-TR=1s, 8 slices, 50% gap) covering the calcarine sulcus (Fig.1). Because this protocol was designed to achieve high specificity of the DfMRI signal at the expense of sensitivity, we acquired up to 10 DfMRI runs per session to increase SNR through trial averaging.
Slice timing and motion were corrected (SPM12)25. Activation maps were estimated from the SE-BOLD datasets using GLM analysis (FSL feat)26. Voxels in the twice refocused SE-BOLD data set with a z-score above 4.0 were selected as the ROI for all data sets. Signals within the ROI were averaged across runs, and the mean trial response was estimated.
Results and Discussion
As seen in Fig.2, individual DfMRI runs show little sign of functional activation. Only after averaging ~5 runs (more than 40min of signal averaging) is a response detectable by eye. Nevertheless, even after averaging 10 runs (85min of data), the DfMRI signal remains noisy in comparison to a single SE-BOLD run.Looking at the mean trial response (Fig.3), averaged across all subjects, we see 0.6±0.2% signal change in the DfMRI data and a 1.64s±0.23s earlier onset compared to SE-BOLD, which are both about half the values of previous reports10 (1.9%±0.3% and 2.45s±0.7s).
Conventionally, SE-BOLD data are acquired using a single-refocused SE24. Adding extra refocusing pulses is expected to further suppress the effect of local tissue gradients27 and may therefore affect the SE-BOLD signal. Although the single and double-refocused SE-BOLD show different amplitudes for the post-stimulus undershoot, their onset time remains similar (Fig.4). Therefore, the early onset seen in the DfMRI response is more likely due to the diffusion weighting and is not a unique feature of twice-refocused SE-BOLD. Still, the use of double refocusing may help reduce hemodynamic contamination in the DfMRI signal10,28.
Looking at individual subjects (Fig.5), we still see evidence of an early onset in the DfMRI signal. However, we also note that some of the volunteers showed a markedly lower response (0.4% vs 0.8%). This may be due to variability in cognitive state, attentional effects, or other factors. Although we selected experienced volunteers, remaining attentive and alert throughout long experimental sessions is challenging.
While an early onset can be detected in our data, our data cannot address its origin. However, given that the early onset was reliably detected, this opens possibilities for further investigation. Future work will aim towards increasing SNR efficiency while retaining the suppression of hemodynamic contamination and tracing the biophysical origins of the signal. Regarding the later, it has been shown that diffusion weighting can be used to modulate different aspects of the hemodynamic response29,30. In addition, our current protocol uses a 50% slice gap (as used in the seminal work10), thus it is possible that inflow effects play a role as well.
As for whether the DfMRI signal is neuronal (cell swelling) or hemodynamic in origin, its earlier onset could be a valuable tool to study ongoing brain activity and the underlying biophysical origins of fMRI.
Acknowledgements
This work was supported by ARC Future fellowship grant FT200100329, by the NIH NIBIB (grant R01-EB019437) and by the NIH NIMH BRAIN Initiative (grant R01-MH111419). The authors acknowledge the facilities of the National Imaging Facility at the Centre for Advanced Imaging, and thank Chia-yin Wu, for support during the experiments.References
- Ogawa, Seiji, et al. "Brain magnetic resonance imaging with contrast dependent on blood oxygenation." proceedings of the National Academy of Sciences 87.24 (1990): 9868-9872.
- Duong, Timothy Q., et al. "Localized cerebral blood flow response at submillimeter columnar resolution." Proceedings of the National Academy of Sciences 98.19 (2001): 10904-10909.
- Logothetis, Nikos K., et al. "Neurophysiological investigation of the basis of the fMRI signal." nature 412.6843 (2001): 150-157.
- Bandettini, Peter A. "Neuronal or hemodynamic? Grappling with the functional MRI signal." Brain connectivity 4.7 (2014): 487-498.
- Menon, Ravi S. "The great brain versus vein debate." Neuroimage 62.2 (2012): 970-974.
- Turner, Robert. "How much cortex can a vein drain? Downstream dilution of activation-related cerebral blood oxygenation changes." Neuroimage 16.4 (2002): 1062-1067.
- Boxerman, Jerrold L., et al. "The intravascular contribution to fMRI signal change: Monte Carlo modeling and diffusion‐weighted studies in vivo." Magnetic resonance in medicine34.1 (1995): 4-10.
- Logothetis, Nikos K. "What we can do and what we cannot do with fMRI." Nature 453.7197 (2008): 869-878.
- Darquié, Anne, et al. "Transient decrease in water diffusion observed in human occipital cortex during visual stimulation." Proceedings of the National Academy of Sciences 98.16 (2001): 9391-9395.
- Le Bihan, Denis, et al. "Direct and fast detection of neuronal activation in the human brain with diffusion MRI." Proceedings of the National Academy of Sciences 103.21 (2006): 8263-8268.
- Aso, Toshihiko, et al. "An intrinsic diffusion response function for analyzing diffusion functional MRI time series." Neuroimage 47.4 (2009): 1487-1495.
- Nunes, Daniel, Rita Gil, and Noam Shemesh. "A rapid-onset diffusion functional MRI signal reflects neuromorphological coupling dynamics." NeuroImage 231 (2021): 117862.
- Bai, Ruiliang, et al. "Assessing the sensitivity of diffusion MRI to detect neuronal activity directly." Proceedings of the National Academy of Sciences 113.12 (2016): E1728-E1737.
- Kershaw, Jeff, et al. "A multi‐compartmental SE‐BOLD interpretation for stimulus‐related signal changes in diffusion‐weighted functional MRI." NMR in Biomedicine 22.7 (2009): 770-778.
- Yacoub, Essa, et al. "Decreases in ADC observed in tissue areas during activation in the cat visual cortex at 9.4 T using high diffusion sensitization." Magnetic resonance imaging 26.7 (2008): 889-896.
- Williams, Rebecca J., David C. Reutens, and Julia Hocking. "Influence of BOLD contributions to diffusion fMRI activation of the visual cortex." Frontiers in neuroscience 10 (2016): 279.
- Albers, Franziska, et al. "Functional mri readouts from bold and diffusion measurements differentially respond to optogenetic activation and tissue heating." Frontiers in neuroscience 13 (2019): 1104.
- De Luca, Alberto, et al. "On the sensitivity of the diffusion MRI signal to brain activity in response to a motor cortex paradigm." Human brain mapping 40.17 (2019): 5069-5082.
- Miller, Karla L., et al. "Evidence for a vascular contribution to diffusion FMRI at high b value." Proceedings of the National Academy of Sciences 104.52 (2007): 20967-20972.
- Rudrapatna, Umesh S., et al. "Impact of hemodynamic effects on diffusion-weighted fMRI signals." Neuroimage 61.1 (2012): 106-114.
- Goense, Jozien BM, and Logothetis, Nikos K. "Laminar specificity in monkey V1 using high-resolution SE-fMRI." Magnetic resonance imaging 24.4 (2006): 381-392.
- Berman AJL, Wang F, Setsompop K, Chen JJ, Polimeni JR. Biophysical simulations of the BOLD fMRI signal using realistic imaging gradients: Understanding macrovascular contamination in Spin-Echo EPI. Proc Intl Soc Mag Reson Med. 2021;29:3398.2.
- Reese, Timothy G., et al. "Reduction of eddy‐current‐induced distortion in diffusion MRI using a twice‐refocused spin echo." Magnetic Resonance in Medicine: An Official Journal of the International Society for Magnetic Resonance in Medicine 49.1 (2003): 177-182.3.
- Norris, David G. "Spin-echo fMRI: the poor relation?." Neuroimage 62.2 (2012): 1109-1115.4.
- Penny WD, Friston KJ, Ashburner JT, Kiebel SJ, Nichols TE, editors. Statistical parametric mapping: the analysis of functional brain images. Elsevier; 2011.5.
- M.W. Woolrich, B.D. Ripley, J.M. Brady and S.M. Smith. Temporal Autocorrelation in Univariate Linear Modelling of FMRI Data. NeuroImage 14:6(1370-1386) 2001.6.
- Karlicek Jr, R. F., and I. J. Lowe. "A modified pulsed gradient technique for measuring diffusion in the presence of large background gradients." Journal of Magnetic Resonance (1969) 37.1 (1980): 75-91.7.
- Pampel, André, Thies H. Jochimsen, and Harald E. Möller. "BOLD background gradient contributions in diffusion‐weighted fMRI—comparison of spin‐echo and twice‐refocused spin‐echo sequences." NMR in Biomedicine 23.6 (2010): 610-618.8.
- Song, Allen W., et al. "Diffusion weighted fMRI at 1.5 T." Magnetic Resonance in Medicine 35.2 (1996): 155-158.9.
- Lee, Sang‐Pil, et al. "Diffusion‐weighted spin‐echo fMRI at 9.4 T: microvascular/tissue contribution to BOLD signal changes." Magnetic Resonance in Medicine: An Official Journal of the International Society for Magnetic Resonance in Medicine 42.5 (1999): 919-928.
Figures

(a) Slices placement during (D)fMRI scans. The slices were placed to cover the calcarine sulcus. (b) Illustration of experimental paradigm and the visual stimulus. The noise pattern flickered at 8Hz. Within 1 run, the ‘on’ and ‘off’ blocks were repeated 12 times.
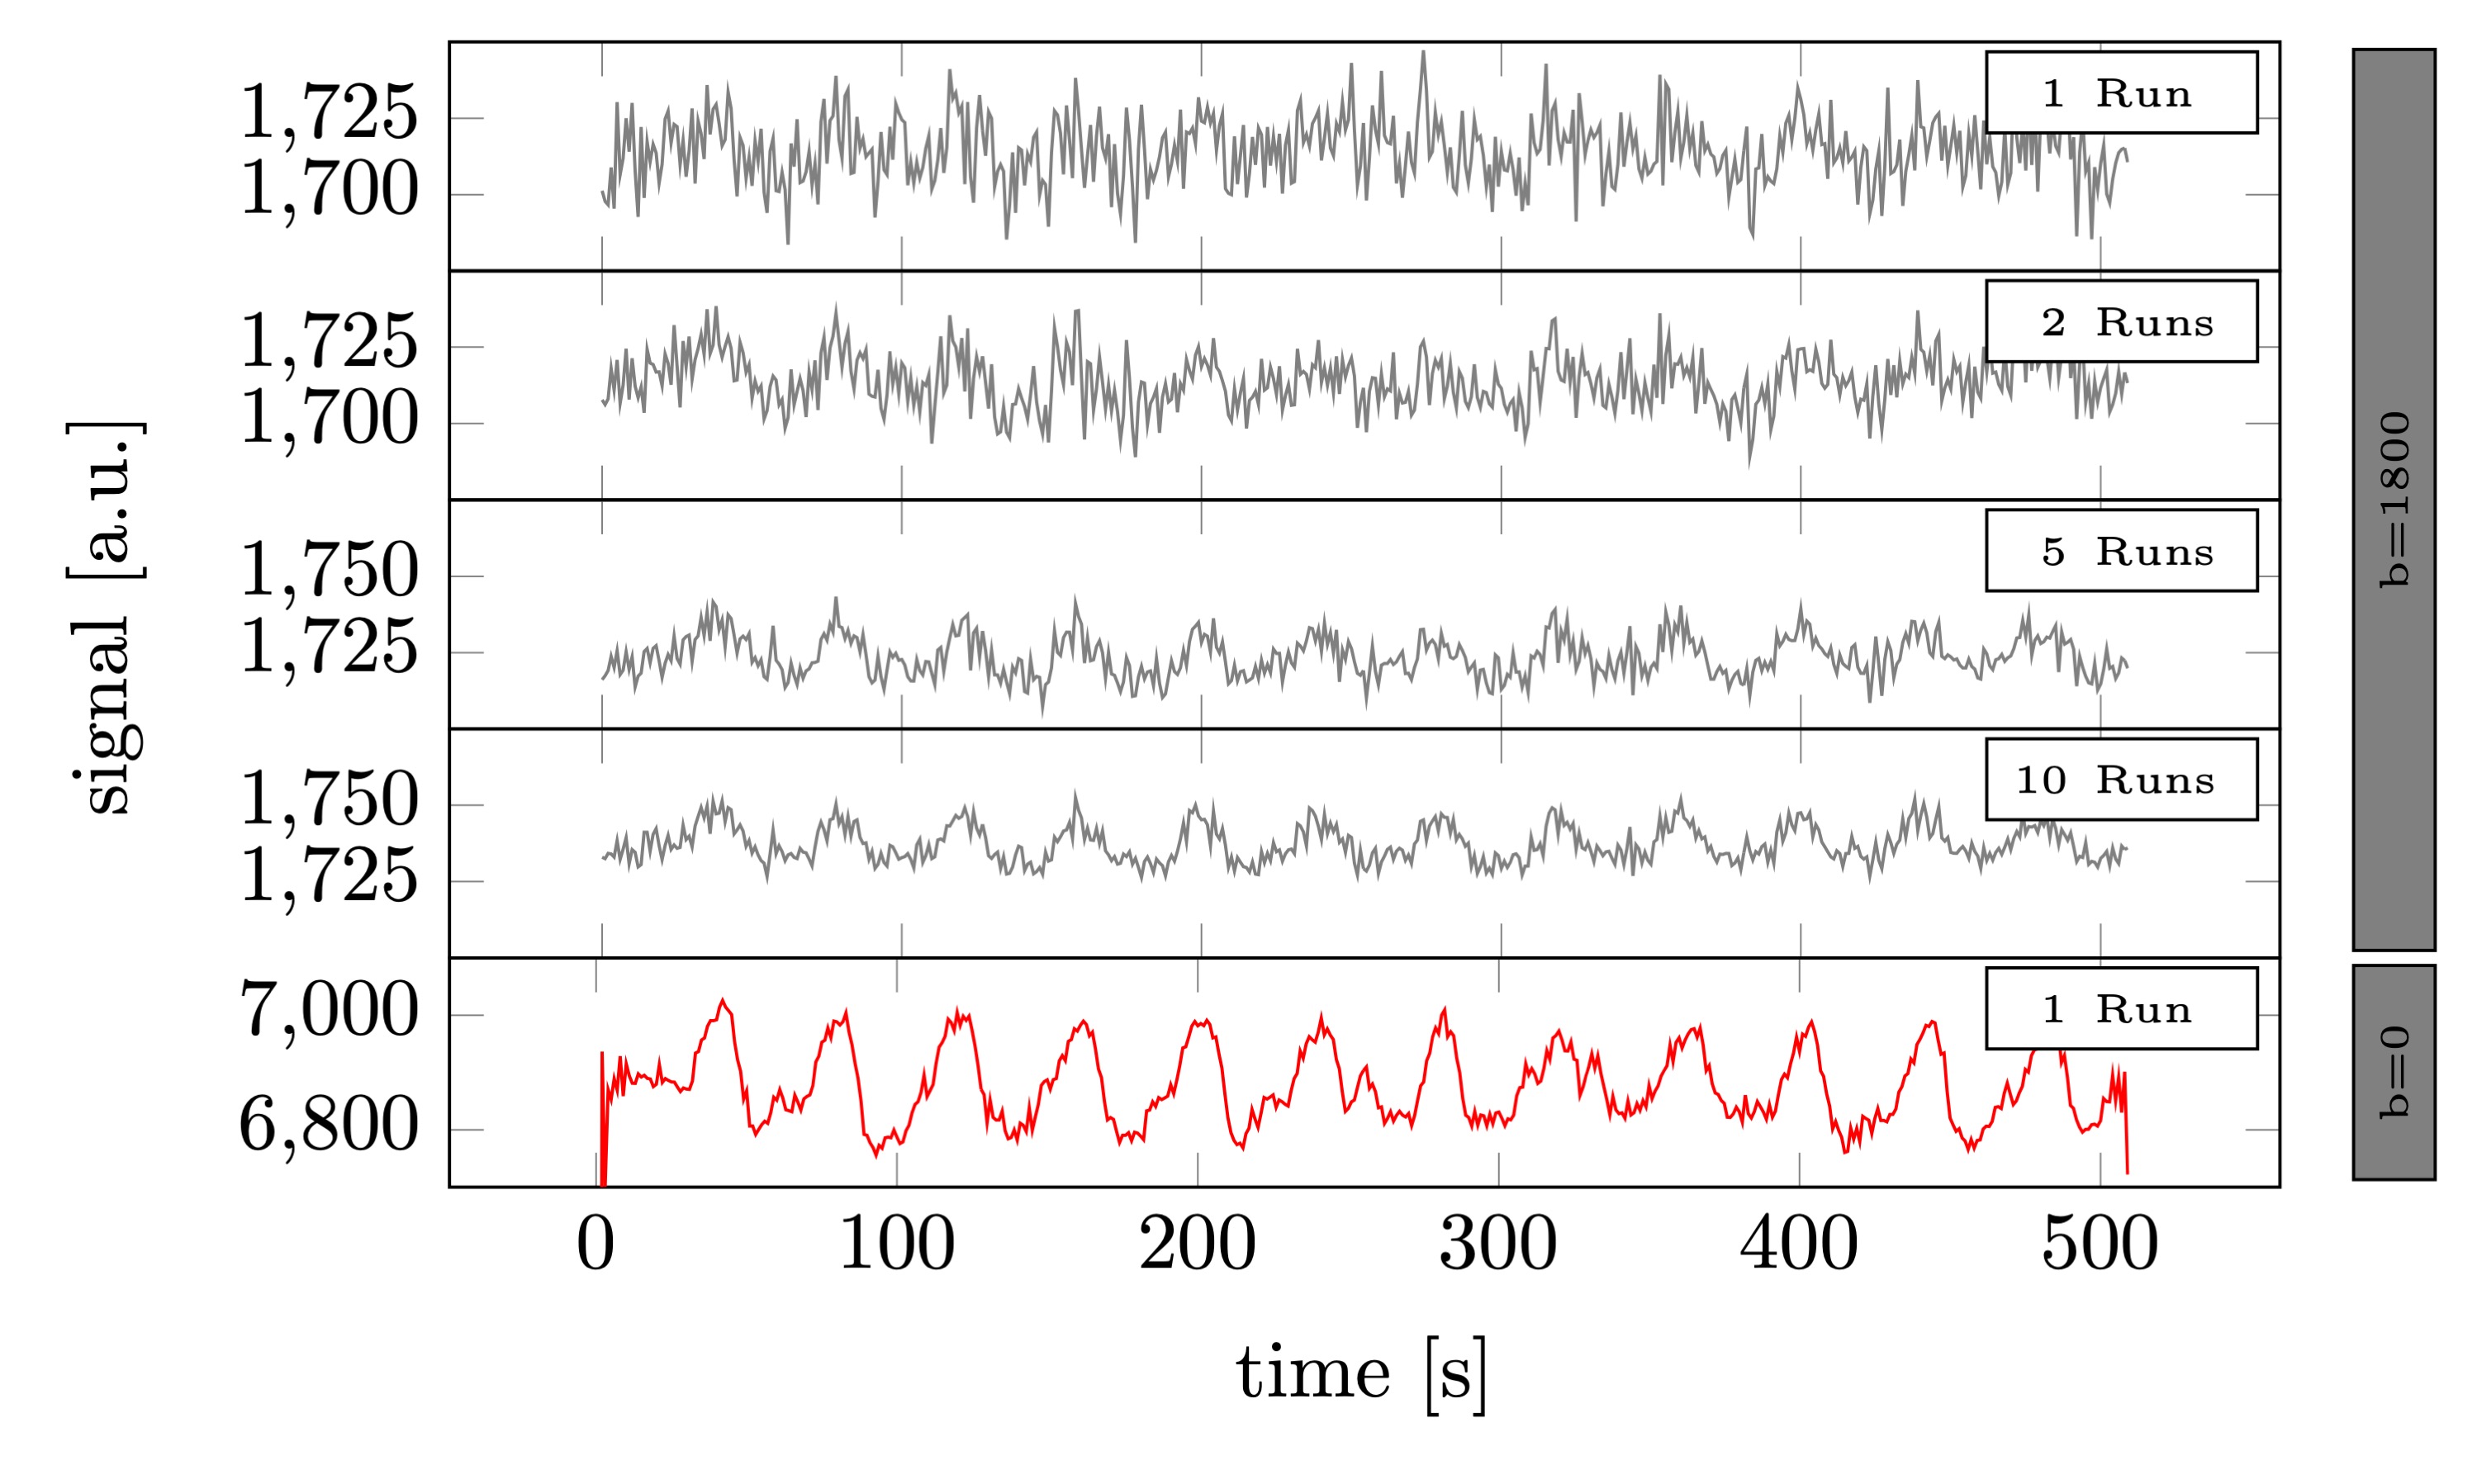
Raw signal time series averaged across voxels (volunteer 1). From top to bottom. The average of 1, 2, 5, and 10 runs of b=1800 s/mm2 DfMRI data. Followed by a single twice refocused spin-echo run. The raw signal levels in the DfMRI data were a factor 3.6 lower than the twice refocused spin echo BOLD data.
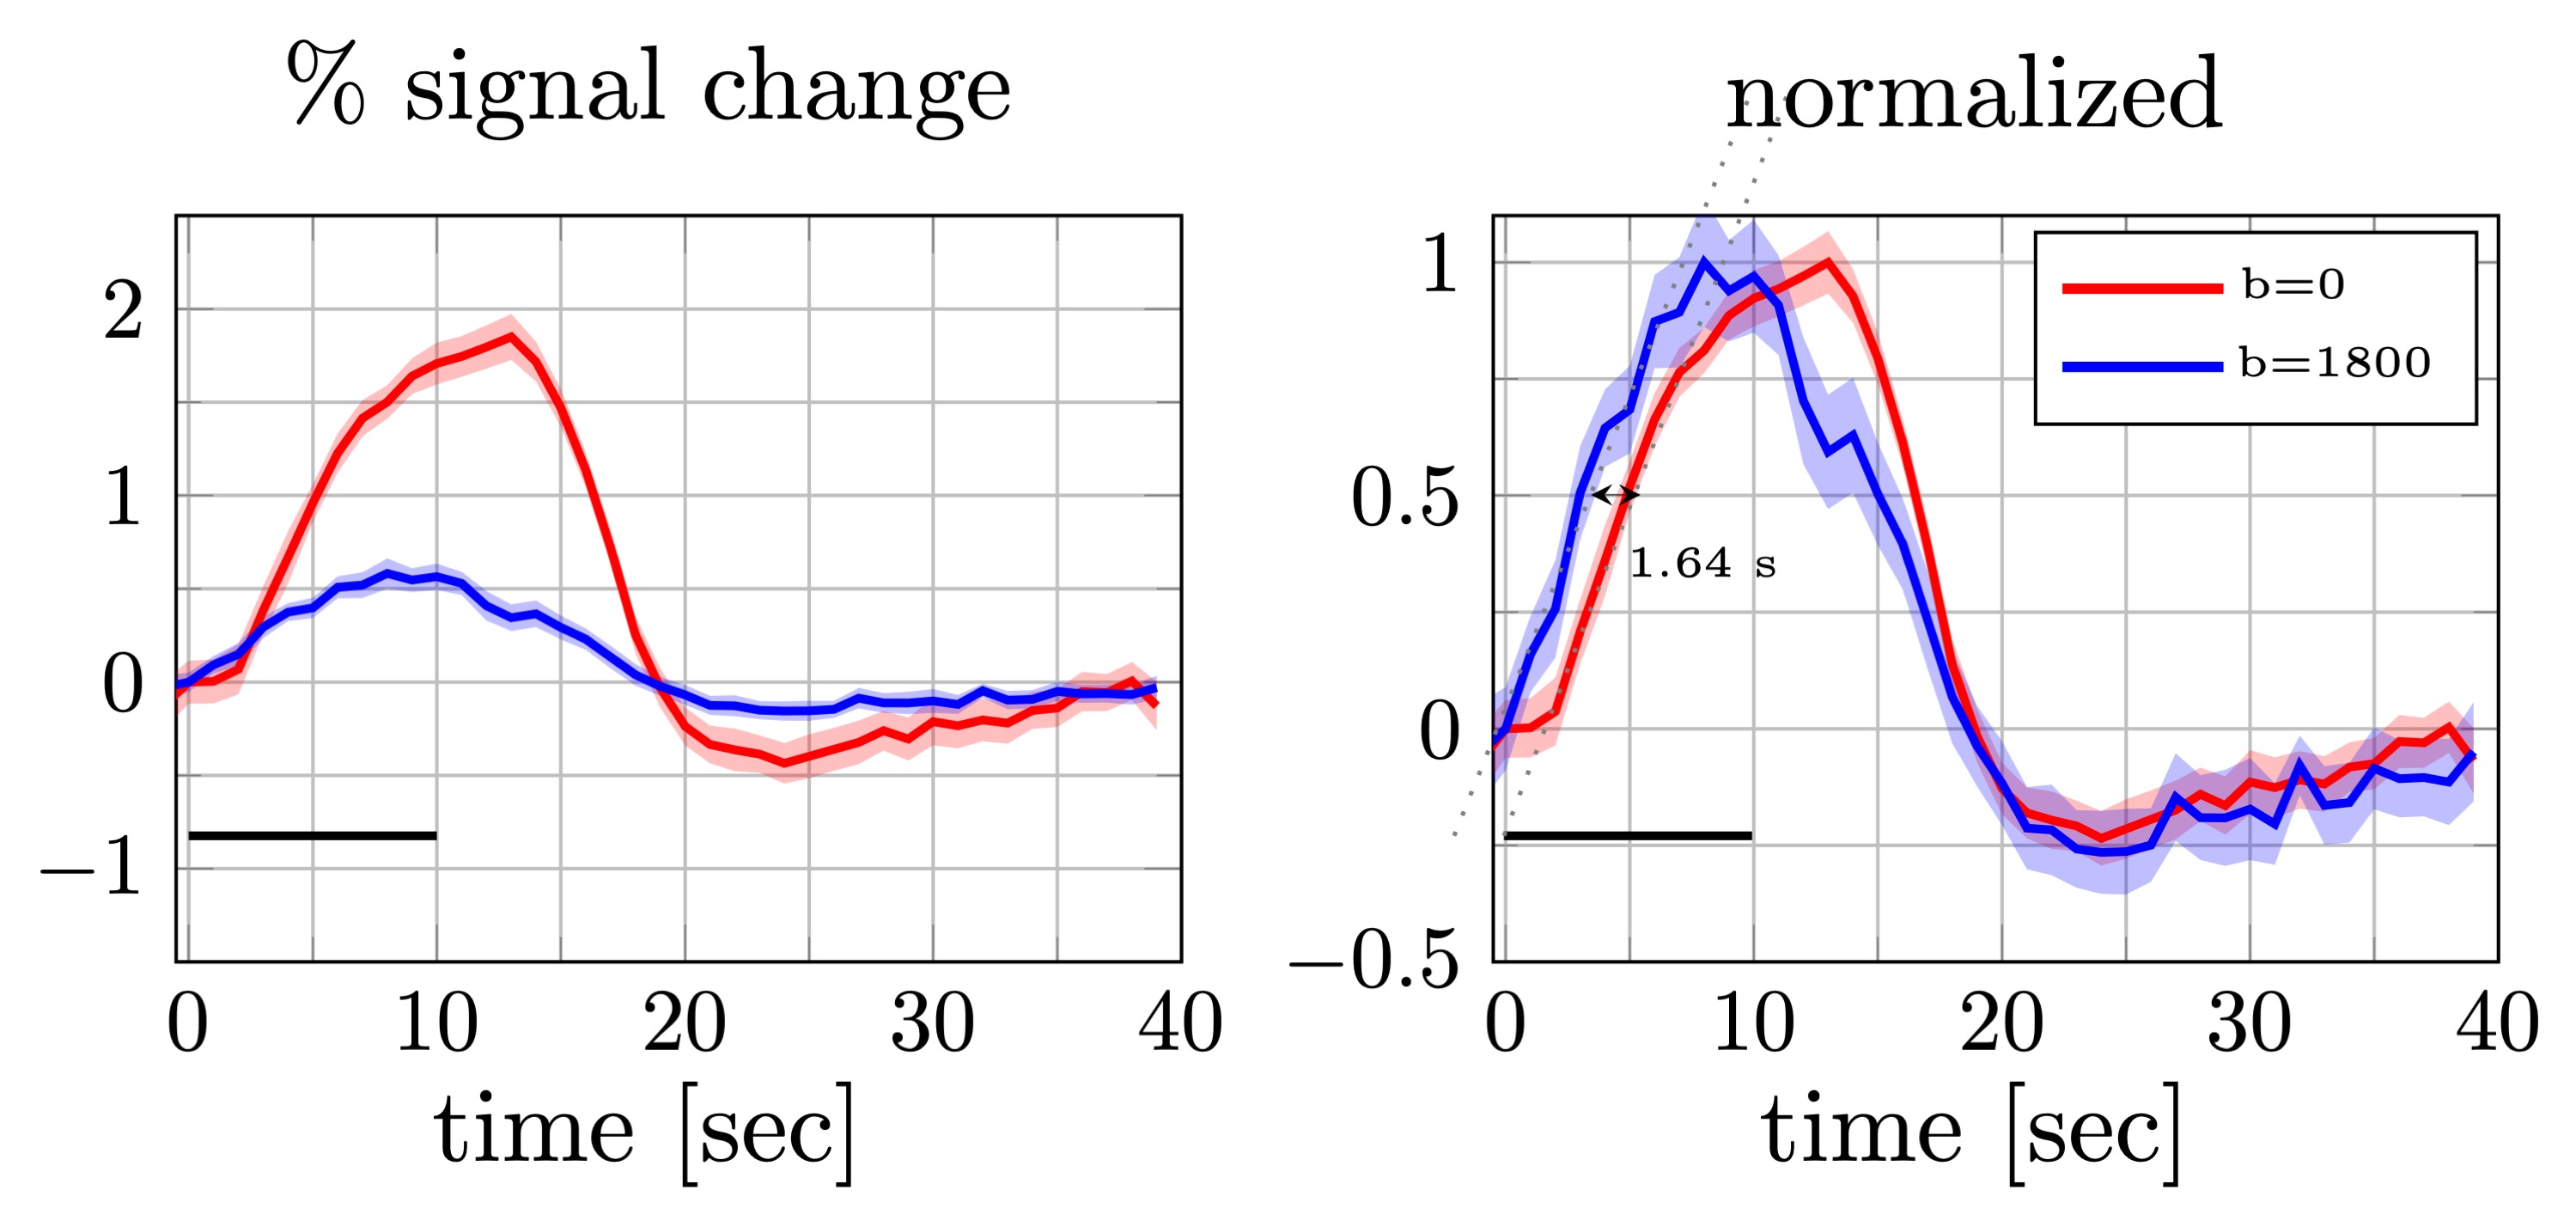
Percent signal changes averaged across subjects were estimated from diffusion and twice refocused spin echo datasets (left). The shaded areas represent the confidence interval (across trails and subjects, after averaging voxels and runs). Both mean signal curves were normalized to their respective maximum values (right). The difference in signal onset time was estimated from the distance between two linear fits (dotted lines) at half of the maximum (1.64s). The error bars on the onset time difference were estimated from width of the confidence intervals at the half max.
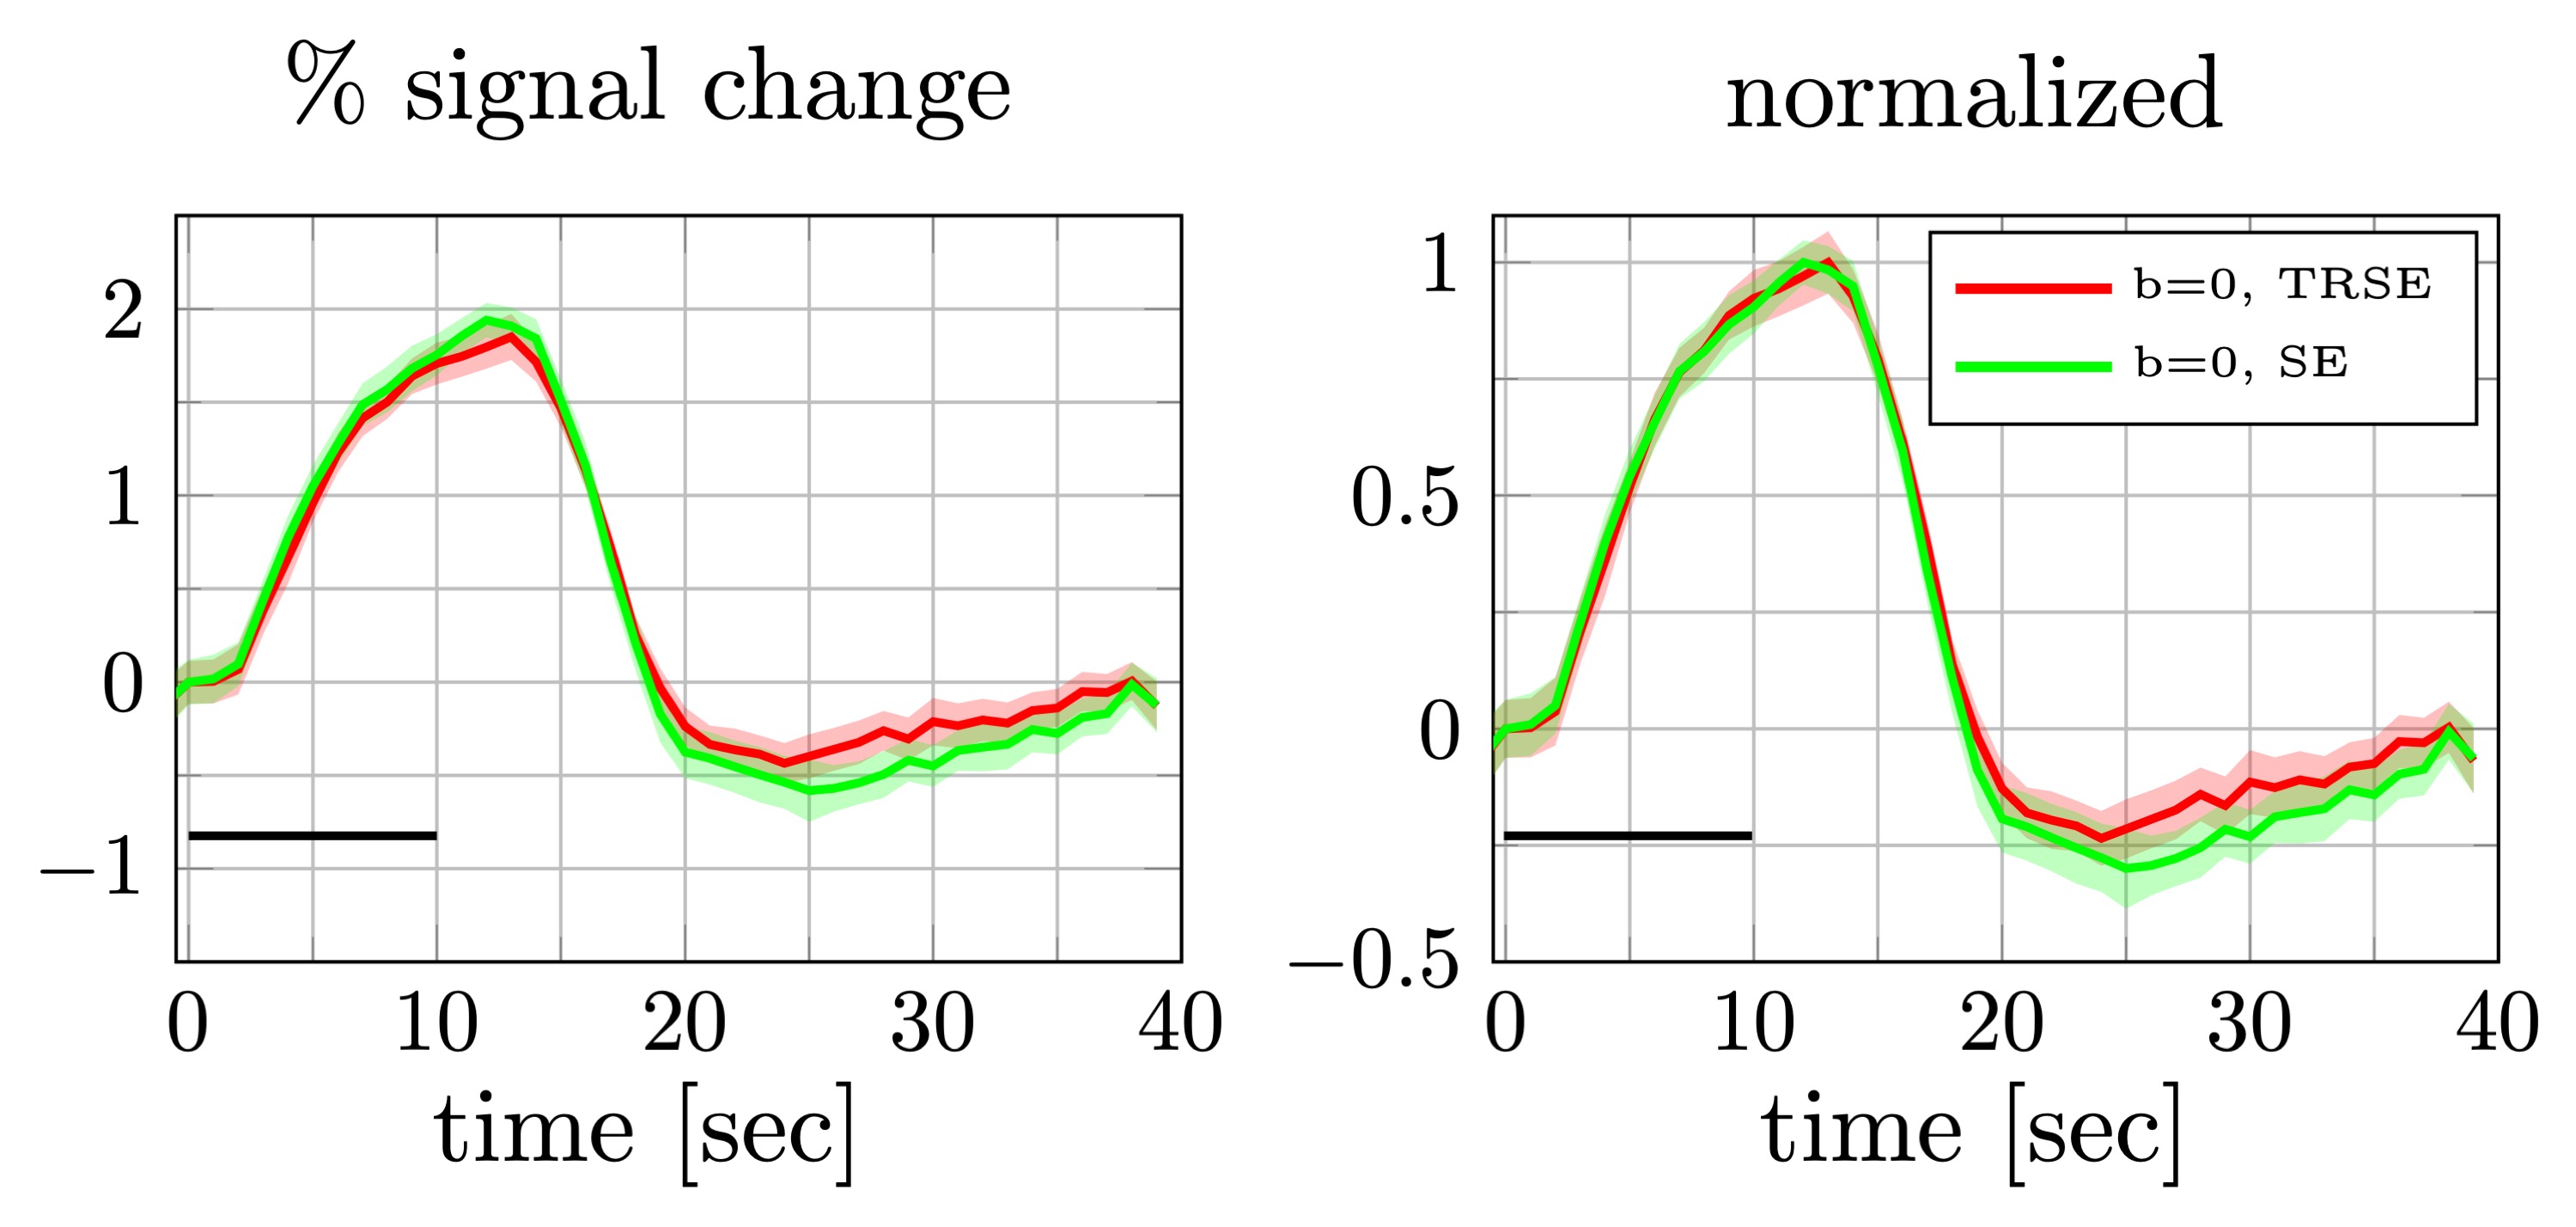
Percent signal changes averaged across subjects were estimated from once and twice refocused spin echo dataset (left). The shaded areas represent the confidence interval (across trails and subjects after averaging over voxels). Both mean signal curves were normalized to their respective maximum values (right). The difference in signal onset time was comparable to the confidence interval at the half max.
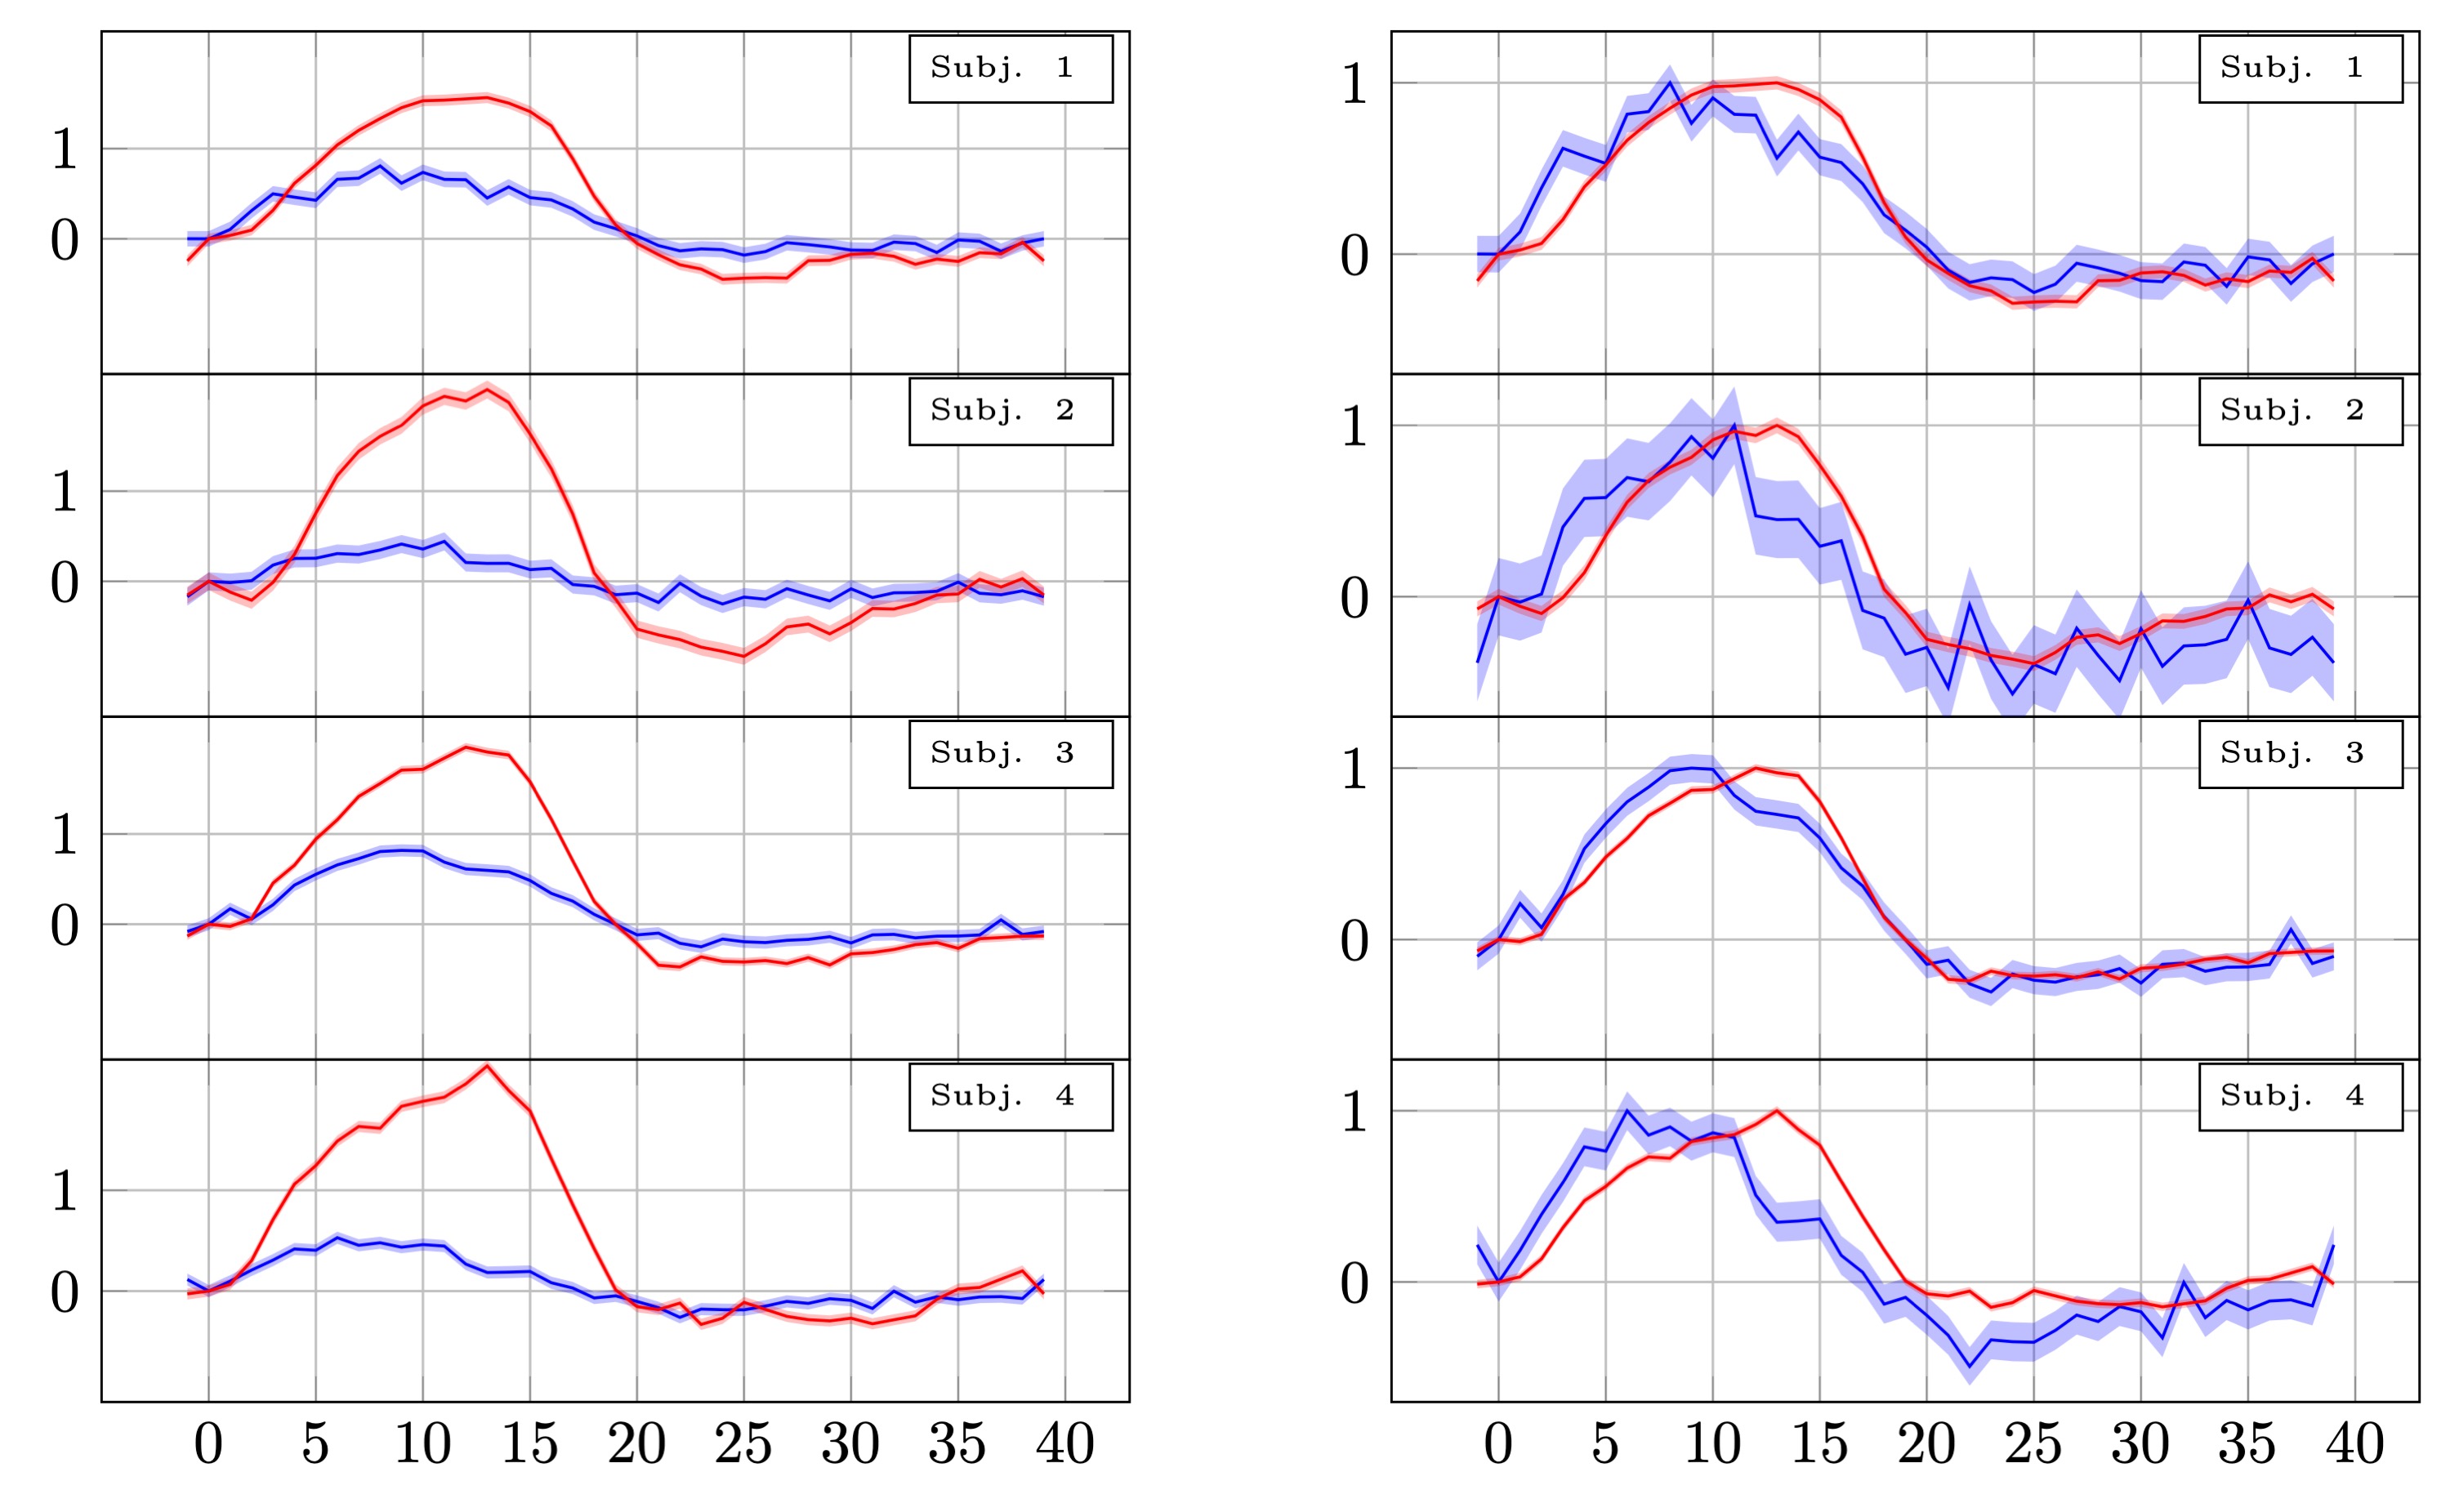
Percent signal changes in individual subjects estimated from twice refocused spin echo DfMRI and SE-BOLD data. The shaded areas represent confidence intervals of the signal change (across voxels, trails and runs). The mean of measurements obtained in different voxels and runs were shifted to have the same mean and scaled to preserve their % signal change. The left panel shows the % signal change. The right panel shows the same curves normalised to have the same amplitude.
DOI: https://doi.org/10.58530/2022/2115