2111
CBV-Based fMRI at 3T with SS-SI-VASO: Multi-Echo DEPICTING vs Multi-Echo EPI1Max Planck Institute for Human Cognitive and Brain Sciences, Leipzig, Germany
Synopsis
ME-DEPICTING, a 2D multi-echo readout achieving short echo times was combined with SS-SI-VASO for simultaneous CBV and BOLD measurements at 3T. Results were compared with a traditional ME-EPI readout. Uncorrected time courses of the first echo of ME-DEPICTING demonstrated high sensitivity to functional CBV changes without further BOLD correction, while time courses of S0 and R2* of the multi-echo fit proved almost equivalent for both readouts. Remarkably, a TE dependence was observed in the BOLD-corrected VASO signals obtained by dynamic division with the corresponding control images of VASO indicating a more reliable CBV measure from the S0 fit.
Introduction
Concurrent measures of cerebral blood volume (CBV) changes greatly supplement the understanding of BOLD physiology. Non-invasive measurements of CBV through Vascular Space Occupancy (VASO)1 techniques at non-zero echo times (TE), however, are subject to contaminations by the BOLD signal itself. In the present study, the Slice-Saturation Slab-Inversion (SS-SI)2 VASO variant was combined with 2D multi-echo readouts to measure functional CBV changes simultaneously with BOLD at 3T. The suitability of the more recently developed multi-echo (ME) version of the DEPICTING3 sequence that achieves very short TEs in such measurements was compared with that of a traditional ME-EPI readout, in terms of the functional sensitivities of their corresponding images. The ME nature of the readouts also allowed an evaluation of two commonly used strategies for removal of the inadvertent BOLD-signal contribution from the VASO signal. The BOLD correction provided by the ME extrapolation to TE=0 (S0fit) to the VASO data was compared to the one provided by the dynamic division approach2 in all echoes for both readouts.Methods
SS-SI-VASO was implemented on a Siemens 3T MAGNETOM Skyra scanner. 10 slices (slice thickness 4mm, matrix 64×64, FOV 192mm, no gap, bandwidth 2kHz/Px) located along the calcarine sulcus were acquired following slab-selective inversion (34cm inversion width, centered in the middle of the slice package) in a descending order with the nulling condition (TI = 1153ms) fulfilled for the 6th slice. Specifications of the two readout modules are as follows:ME-EPI: TE1/TE2/TE3 = 7.5/20.7/33.9ms; partial-Fourier factor 6/8, GRAPPA factor 2.
ME-DEPICTING: TE1/TE2/TE3 = 1.7/10.7/19.7ms, GRAPPA factor 2.
3 healthy subjects underwent visual stimulation by an 8Hz black and white large flickering checkerboard presented for 16s and periodically contrasted with 24s of a grey screen. 200 repetitions (100 VASO/control pairs) were recorded with a TR of 2s, which with an interleaved application of the slab inversion yielded an effective TR of 4s.
Functional data were first split into VASO and control datasets using FSLutils. Both resulting ME time series were then realigned (SPM12) based on the estimated realignment parameters of the corresponding first echo. These were temporally high-pass filtered at (20×TR)–1 Hz and 2D spatially Gaussian filtered (FWHM=3mm). Parameters R2* and S0fit were derived for each by linear regression. The dynamic division approach for BOLD correction was applied by dividing the single-echo time series of VASO by the corresponding control data. VASO evaluations were then based on the time series of the three BOLD-corrected echoes, the uncorrected TE1 and the S0fit, while the BOLD signal was evaluated solely from the R2* of the control data. A GLM with the canonical HRF was used for the statistical analyses. ΔVASO% were converted to relative ΔCBV with CBV0=5% and compensated for the imperfect nulling condition of the remaining slices4. A Bonferroni-corrected (p<0.05) threshold was used to test significance and compare the sensitivities of the two sequences. tCNRs5 over a common ROI were also calculated to substantiate the functional detection capabilities.
Results
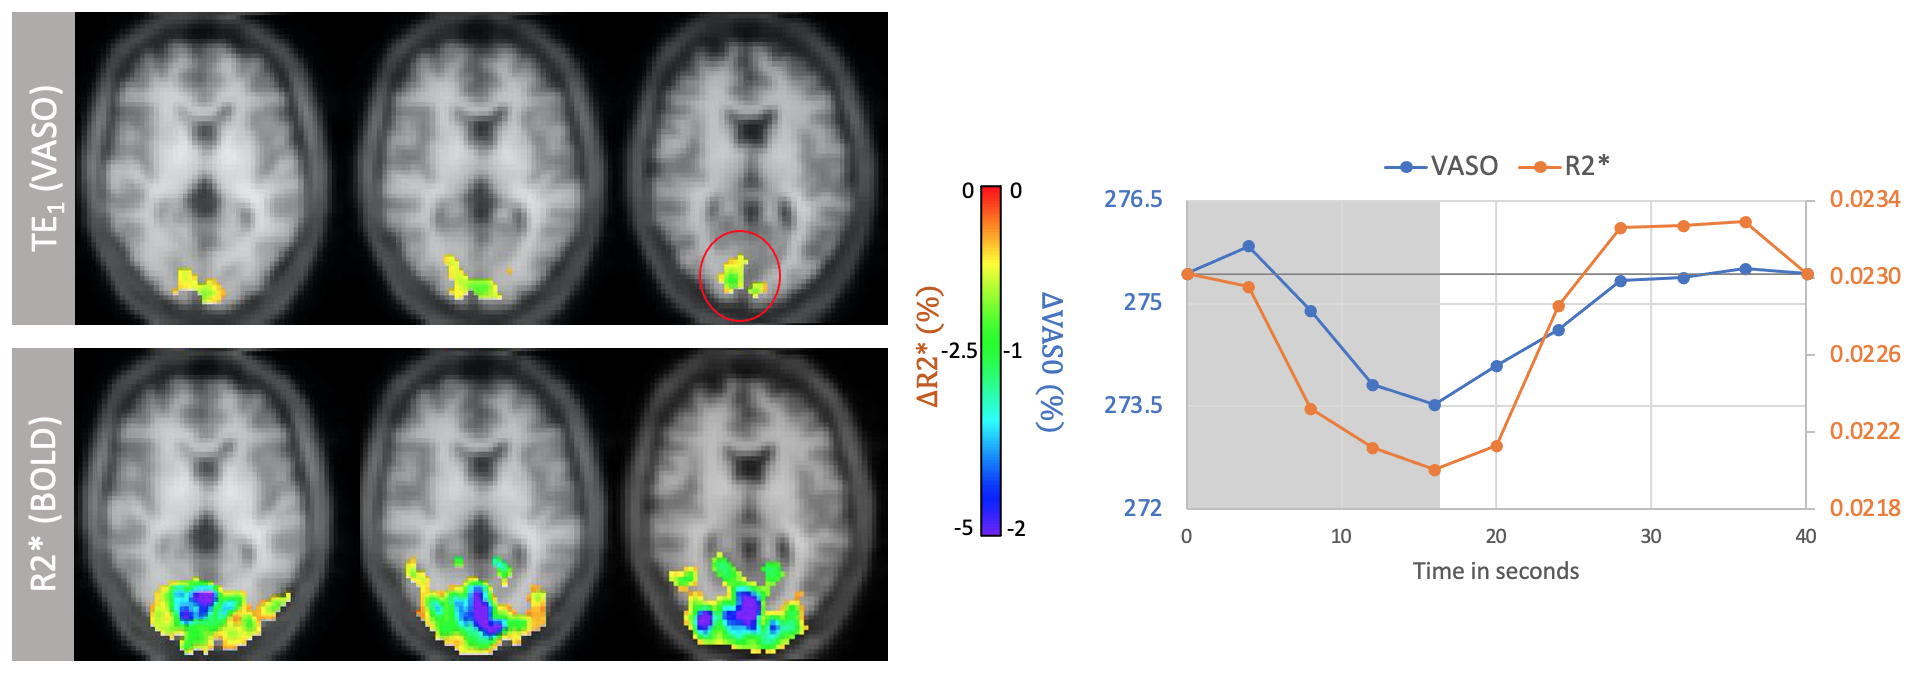
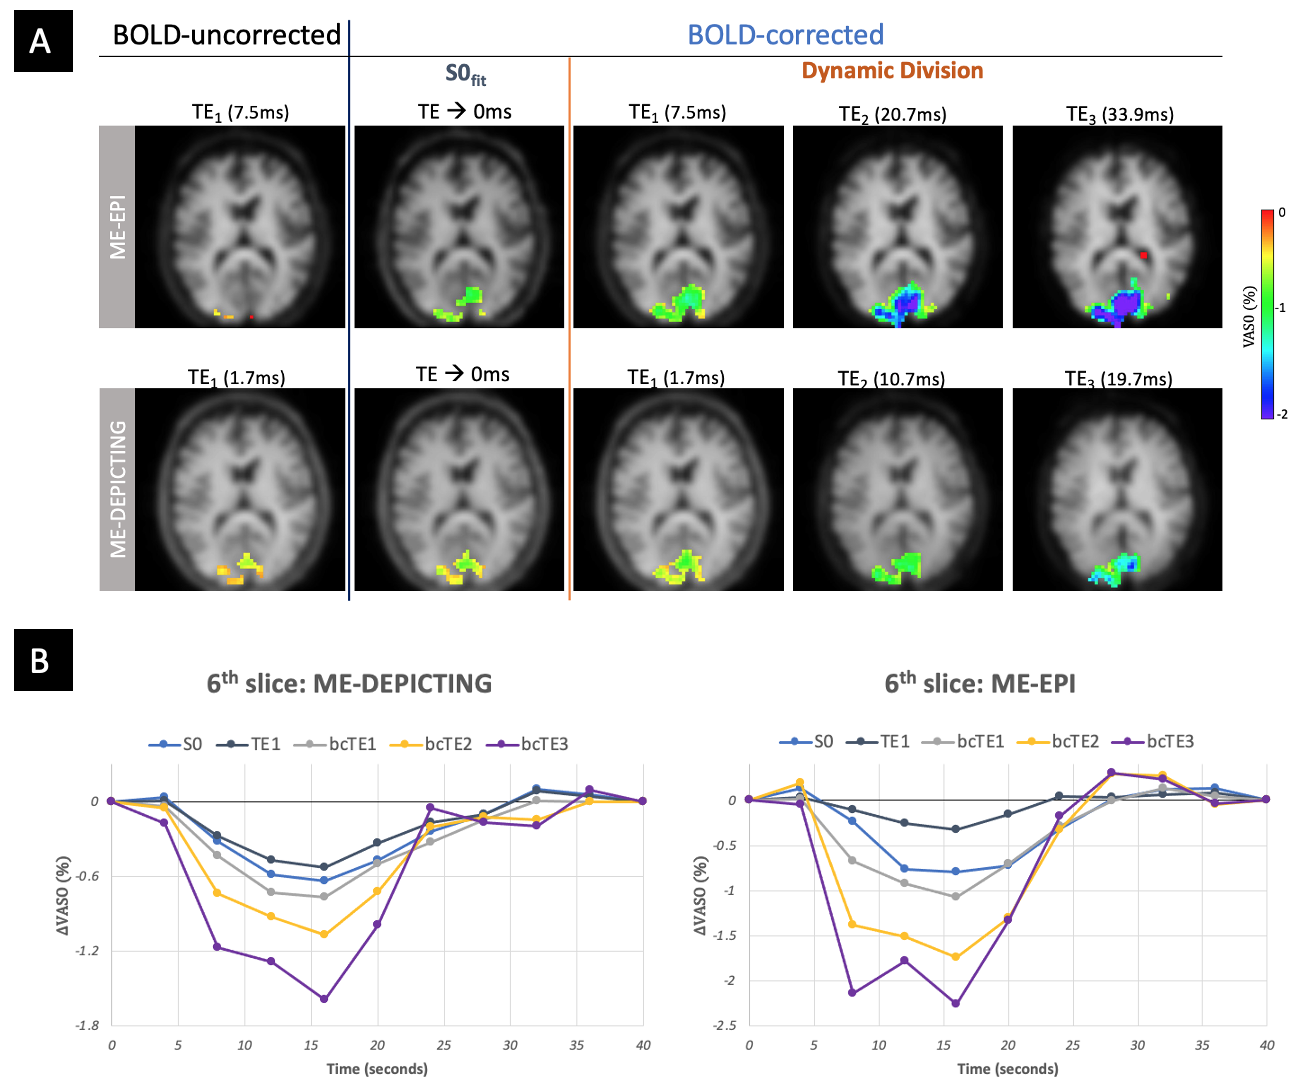
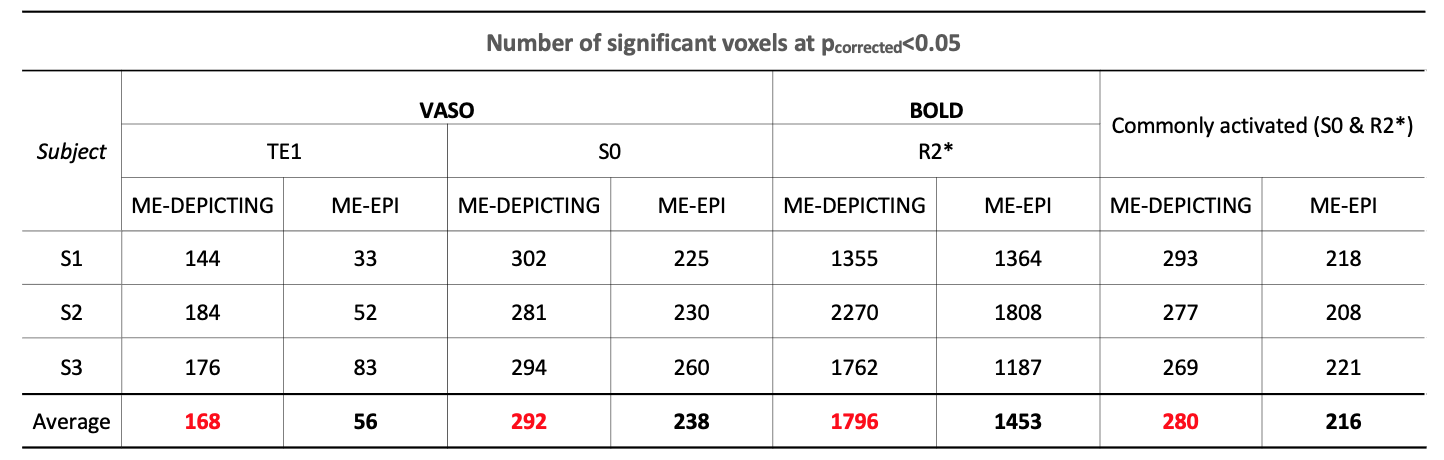
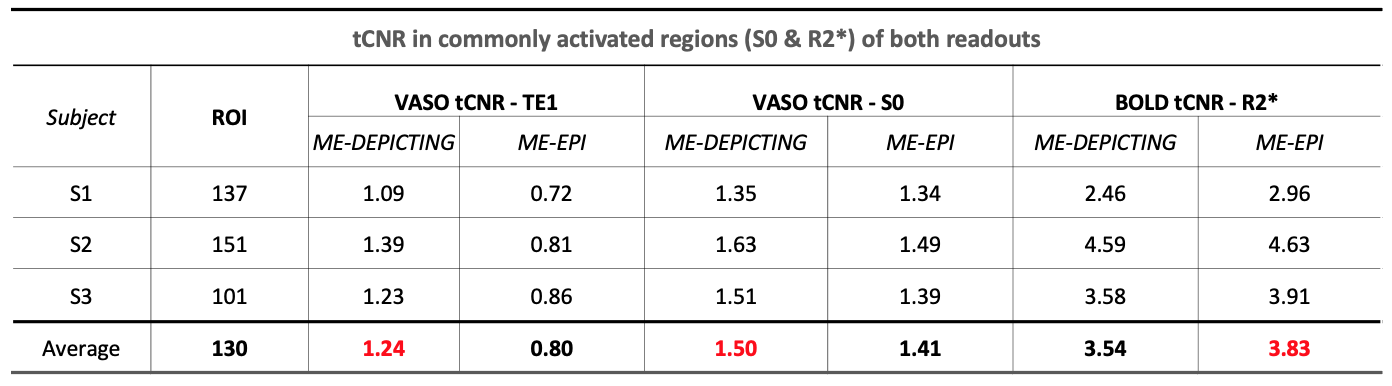
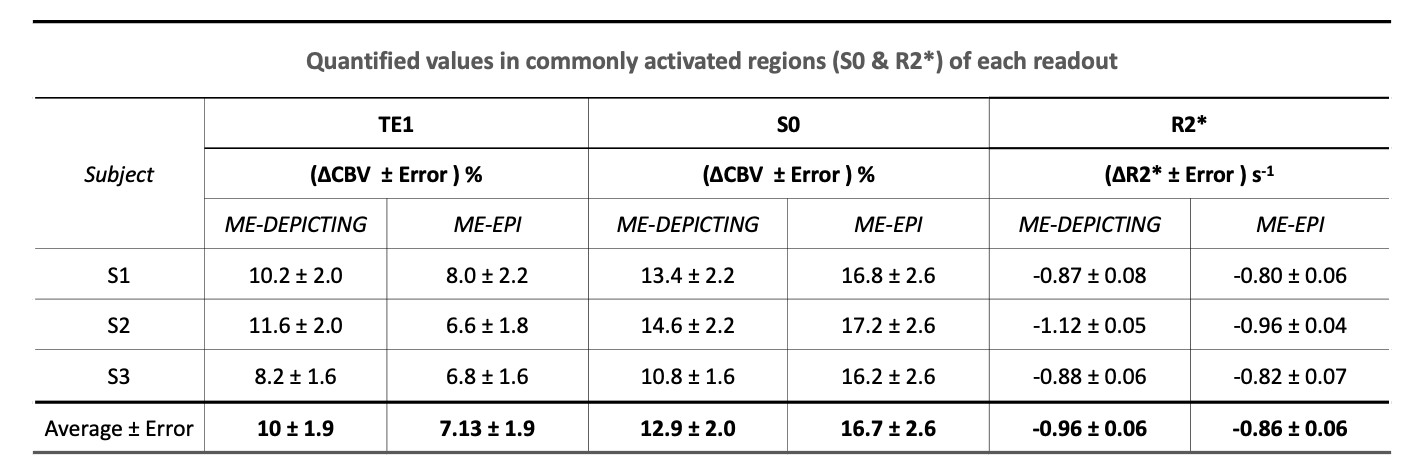
VASO and R2* activation maps obtained from TE1 and R2* images along with the corresponding cycle-averaged raw time courses (Figure 1) demonstrate the suitability of the ME-DEPICTING readout for concomitant BOLD and CBV measurements. Due to its shorter TE1, ME-DEPICTING clearly outperforms ME-EPI in detecting ΔVASO with its BOLD-uncorrected image. When corrected for BOLD-signal contamination with different strategies (Figure 2A), significantly larger ROIs and VASO signal intensities are obtained. A TE dependence is, however, observed for values obtained with the dynamic division approach, although to a lesser extent for ME-DEPICTING. Figure 2B demonstrates this linear increase with TE in the BOLD-corrected ΔVASO timecourses for both readouts for a representative subject. This hints at differing BOLD contributions in the VASO and control images at 3T resulting in a failure of BOLD cancellation by dynamic division. Therefore, for comparing both readouts, only results from the BOLD-corrected S0fit and the uncorrected TE1 were considered. Tables 1 and 2 highlight the higher functional sensitivities of TE1 and S0fit of ME-DEPICTING for detecting ΔVASO signal and that of ME-EPI with regard to the BOLD signal. Quantitative values of relative ΔCBV and ΔR2* in ROIs of common VASO and BOLD activation for each readout are provided in Table 3.Discussion
The sensitivity for detecting VASO signal changes was found to be higher with ME-DEPICTING than with ME-EPI, replicating results from previous work6 focused on ΔCBF detection. The short TEs of ME-DEPICTING successfully reduce inherent BOLD contaminations in the VASO signal. Interestingly, the shorter TEs did not seem to degrade the capability of simultaneous BOLD-signal detection. Nonetheless, reasonable values of both ΔCBV and ΔR2* were obtained with both readouts (Table 3). For example, ΔCBV values of ~13% and ~17% obtained with ME-DEPICTING and ME-EPI, respectively, are in the previously reported range of 5-20% for visual activation studies7.Furthermore, the ME extrapolation to TE=0 was found to remove unwanted BOLD signals more reliably than the dynamic division approach as the latter was found to introduce a TE dependence in the corrected VASO data. This unwanted dependence was predicted by recent 3T simulations8, and can be explained by the considerable intravascular contribution to the BOLD signal at 3T9 compared to the conventionally used field strength of 7T for SS-SI-VASO2.
Acknowledgements
We thank Laurentius Huber for helpful discussions on the implementation of SS-SI-VASO at 3T.References
1. Lu H, Golay X, Pekar JJ & Van Zijl PC. M. Functional magnetic resonance imaging based on changes in vascular space occupancy. Magn Reson Med. 2003;50:263–274.
2. Huber L, Ivanov D, Krieger SN et al. Slab-selective, BOLD-corrected VASO at 7 Tesla provides measures of cerebral blood volume reactivity with high signal-to-noise ratio. Magn Reson Med. 2014;72:137–148.
3. Hetzer S, Mildner T, Möller HE. A Modified EPI sequence for high-resolution imaging at ultra-short echo time. Magn Reson Med. 2011;65:165–175.
4. Scouten A, Constable RT. Applications and limitations of whole-brain MAGIC VASO functional imaging. Magn Reson Med. 2007;58:306–315.
5. Geissler A,Gartus A, Foki T, et al. Contrast-to-noise ratio (CNR) as a quality parameter in fMRI. J Magn Reson Imaging 2007;25:1263–1270.
6. Devi R, Mildner T, Lorenz K, et al. Improved sensitivity for detecting functional CBF changes by center-out EPI with very short echo time. Proceedings of the 27th Annual Meeting of ISMRM. Montréal, QC, Canada, 2019; 3712.
7. Donahue MJ, Hochduin H, van Zijl PCM, et al. Blood oxygenation level-dependent (BOLD) total and extravascular signal changes and ΔR2* in human visual cortex at 1.5, 3.0 and 7.0 T. NMR Biomed. 2011;24:25–34.
8. Genois É, Gagnon L, Desjardins M. Modeling of vascular space occupancy and BOLD functional MRI from first principles using real microvascular angiograms. Magn Reson Med. 2021;85:456–468.
9. Jochimsen TH, Norris DG, Mildner T, Möller HE. Quantifying the intra- and extravascular contributions to spin-echo fMRI at 3 T. Magn Reson Med. 2004;52:724 –732.
Figures