2105
MP-PCA denoising of complex imaging data for direct visualization of the dentatorubrothalamic tract using diffusion MRI at 3T1Center for Advanced Imaging Innovation and Research (CAI2R), Department of Radiology, New York University, school of medicine, New York, NY, United States, 2Neurosurgery, New York University, school of medicine, New York, NY, United States
Synopsis
Direct visualization of anisotropic structures in the brainstem, basal ganglia and thalamus could improve functional neurosurgery planning and characterize changes associated with pathology, treatment response or side effects. Postmortem MRI microscopy demonstrates the potential for high resolution diffusion MRI to detect such functional organization. However, in vivo signal-to-noise limitations have precluded accurate quantitative diffusion measurements at sufficient spatial resolution for these structures. We demonstrate that MP-PCA denoising of complex dMRI at 1-mm isotropic resolution and b-values up to 2000 s/mm2 enables direct visualization of the dentatorubrothalamic tract, the key white matter pathway for functional neurosurgical treatment of tremor.
Introduction
The brainstem, basal ganglia and thalamus are compact, complex configurations of small nuclei and pathways essential for control and regulation of autonomic, motor, sensory and cognitive functions, yet it remains extremely challenging to spatially localize such small structures using in-vivo MRI with confidence. Diffusion MRI (dMRI) may be highly sensitive to early pathological processes in these structures1, but it is challenging to implement because of reduced signal-to-noise ratio with sufficient spatial resolution. Classical presurgical planning uses indirect targeting based on landmarks visible with conventional MRI contrast or direct visualization with 3D Fast Gray Matter Acquisition T1 Inversion Recovery (FGATIR)2,3. Here, we visualize these structures with high resolution (1mm3), high b (b=2000s/mm2) dMRI and MP-PCA based dMRI denoising4. Two spatial resolutions demonstrate the high resolution required to directly visualize these structures. We also compare complex, magnitude, and no denoising to show the benefits for structure visualization and better precision and accuracy of diffusion parameter estimates.Materials and Methods
After informed consent, a healthy 38-year-old woman underwent non-contrast MRI on a 3-T Siemens Magnetom Prisma. The protocol included 1-mm isotropic resolution FGATIR (TR/TE/TI = 3/0.019/0.41s, 256x256 matrix, 144 sagittal slices), and two axial dMRI sequences with either 1-mm isotropic resolution (TR/TE: 20/0.093s 210x210, 126 slices), or 2-mm isotropic resolution (TR/TE: 8/0.063s, matrix 106x106, 76 slices). Both dMRI sequences used b = 0(6), 1000(20 dirs), 2000 s/mm2(64dirs), and a b=0 reverse phase encoding image at each resolution to correct for EPI distortions. dMRI EPI readout was shortened using 6/8 partial Fourier and parallel imaging (total scan time 1mm3=31.4min).For denoising steps, MPPCA with a modified (CG) cuttoff in PCA space5 was used to identify the noise bulk, along with eigenvalue shrinkage6, and nonlocal patching using a bilateral approach. dMRI raw data was preprocessed in 3 different ways for comparison:
1. Complex dMRI data were first denoised using MPPCA4 using a 15x15 2D box-shaped kernel. The denoised phase $$$\phi_{denoised}$$$ is estimated and unwound according to:
$$$S_{real} = Re(S_{complex}e^{-i\phi_{denoised}})$$$, then phase-unwound signal was denoised again using a nonlocal moving patch.
2. Magnitude dMRI data were MPPCA-denoised (CG cutoff, nonlocal patch, shrinkage).
3. Magnitude (non-denoised) dMRI data.
dMRI for all resolutions and denoising levels were pre-processed using DESIGNER7, including correction for partial Fourier (6/8) induced Gibbs ringing8, eddy current9 and EPI distortion correction10, along with kurtosis tensor estimation using an unconstrained weighted linear least squares DKI-fit11. Diffusion data was co-registered to FGATIR using a 6 degree-of-freedom rigid transform using FSL-FLIRT12, to enable FGATIR contrast as a reference for subthalamic gray matter anatomy. Whole brain fiber tracking was performed on each dataset using the probabilistic tensor tracking algorithm with mrtrix3, using 100,000 selected streamlines and FA cutoff = 0.05. Regions of interest were chosen in the internal capsule and corpus callosum using the JHU white matter atlas to compare the effect of noise bias at different denoising and resolution levels. Quantitative comparisons were performed based on mean diffusivity (MD), mean kurtosis (MK) and fractional anisotropy (FA).
Results
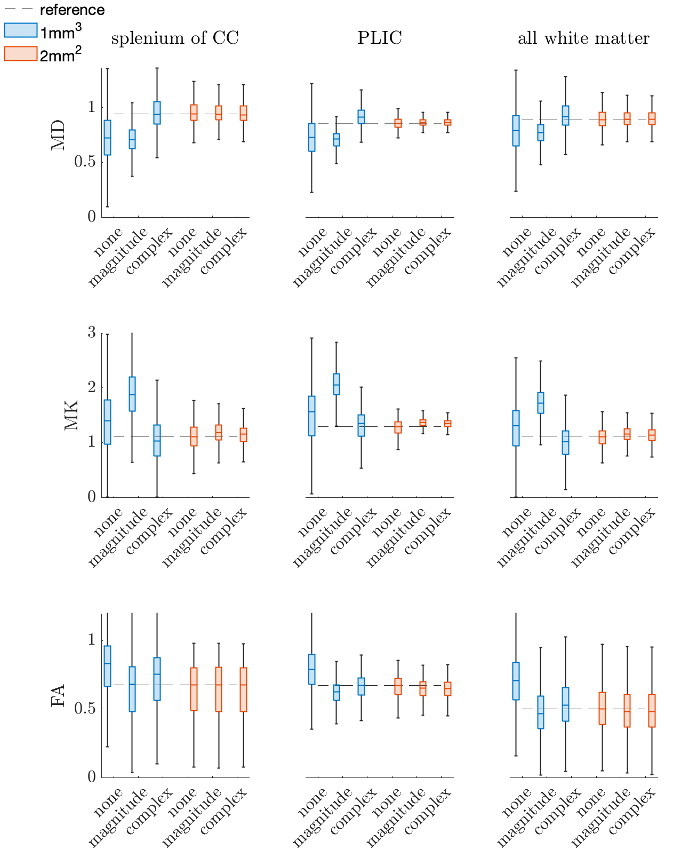
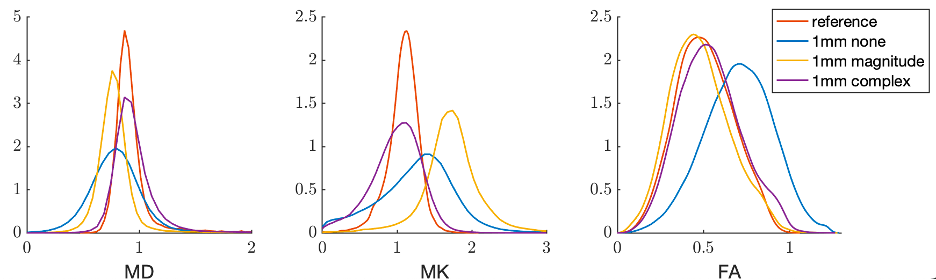
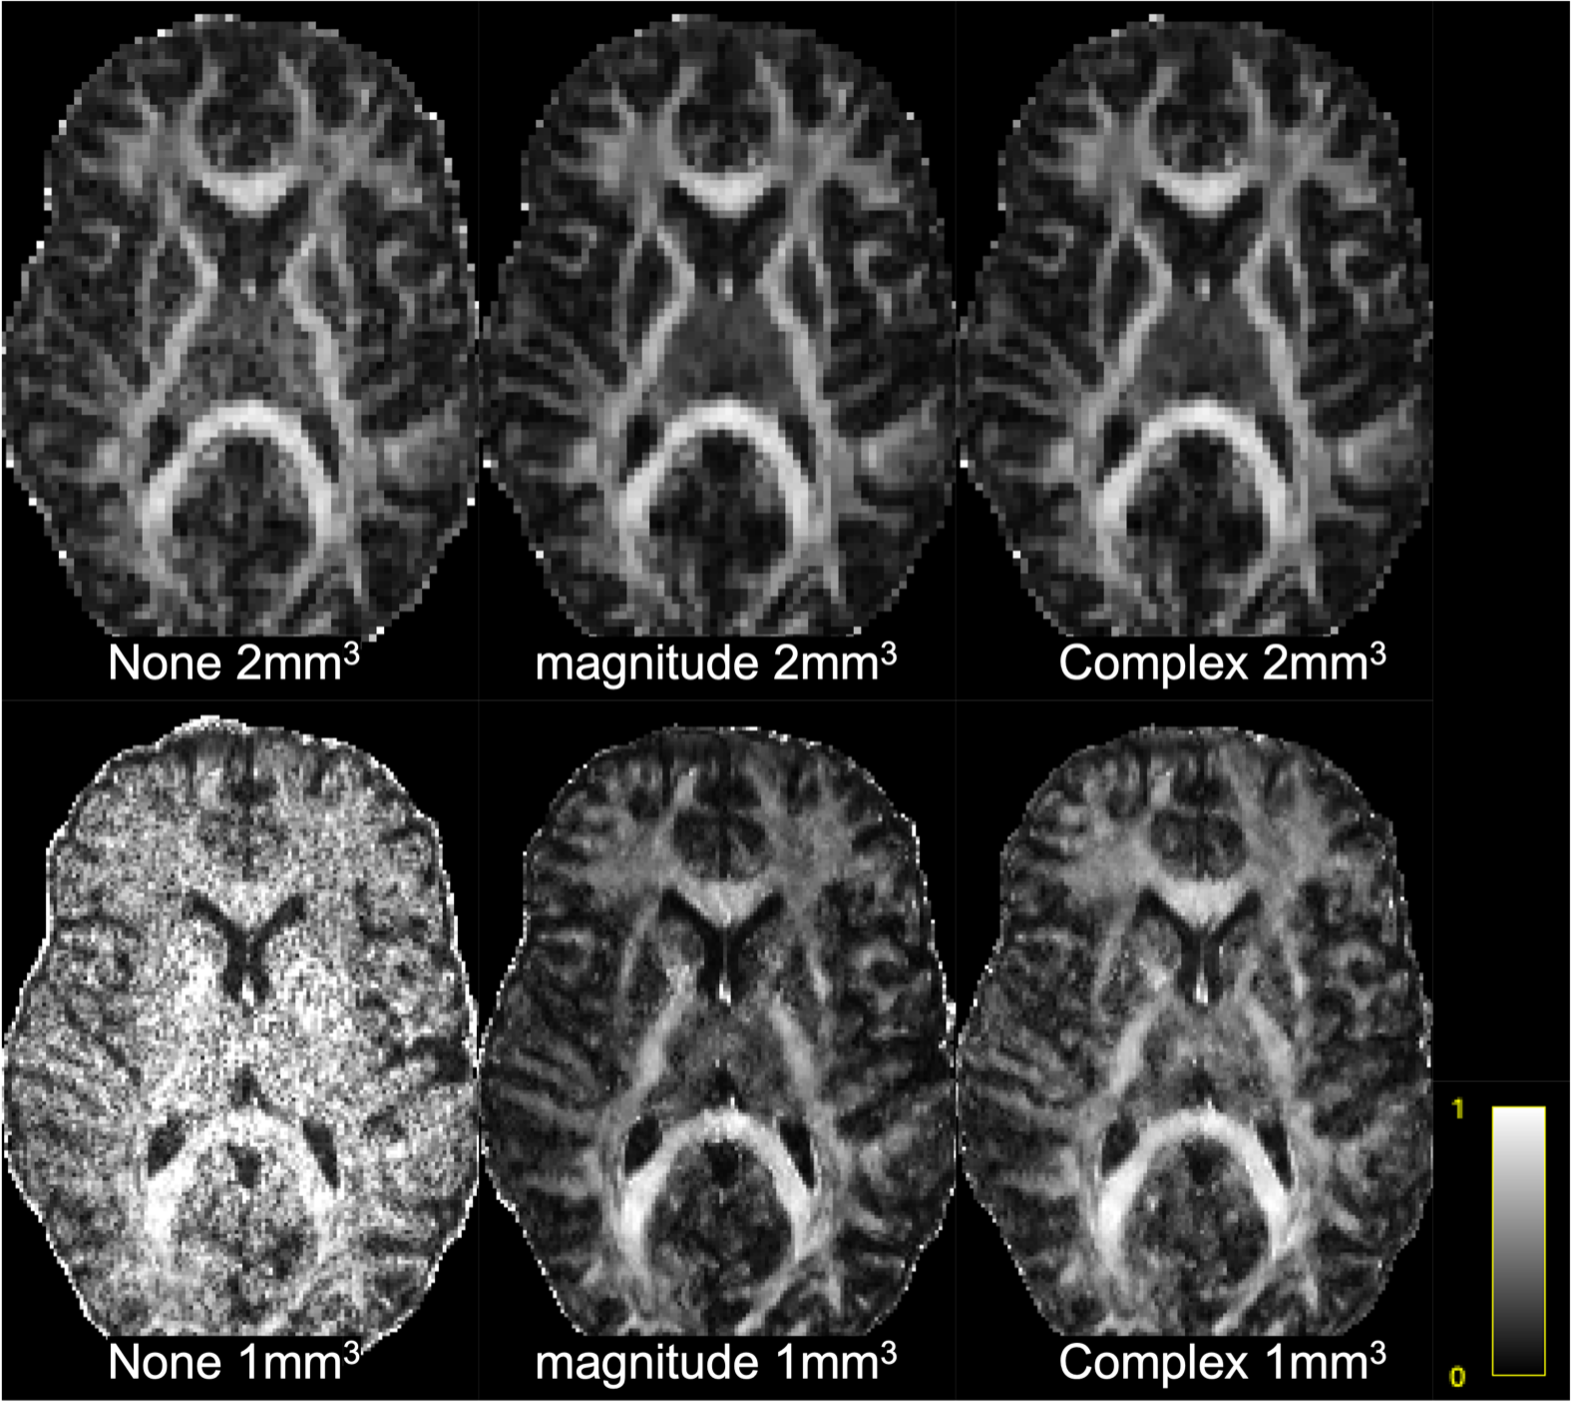
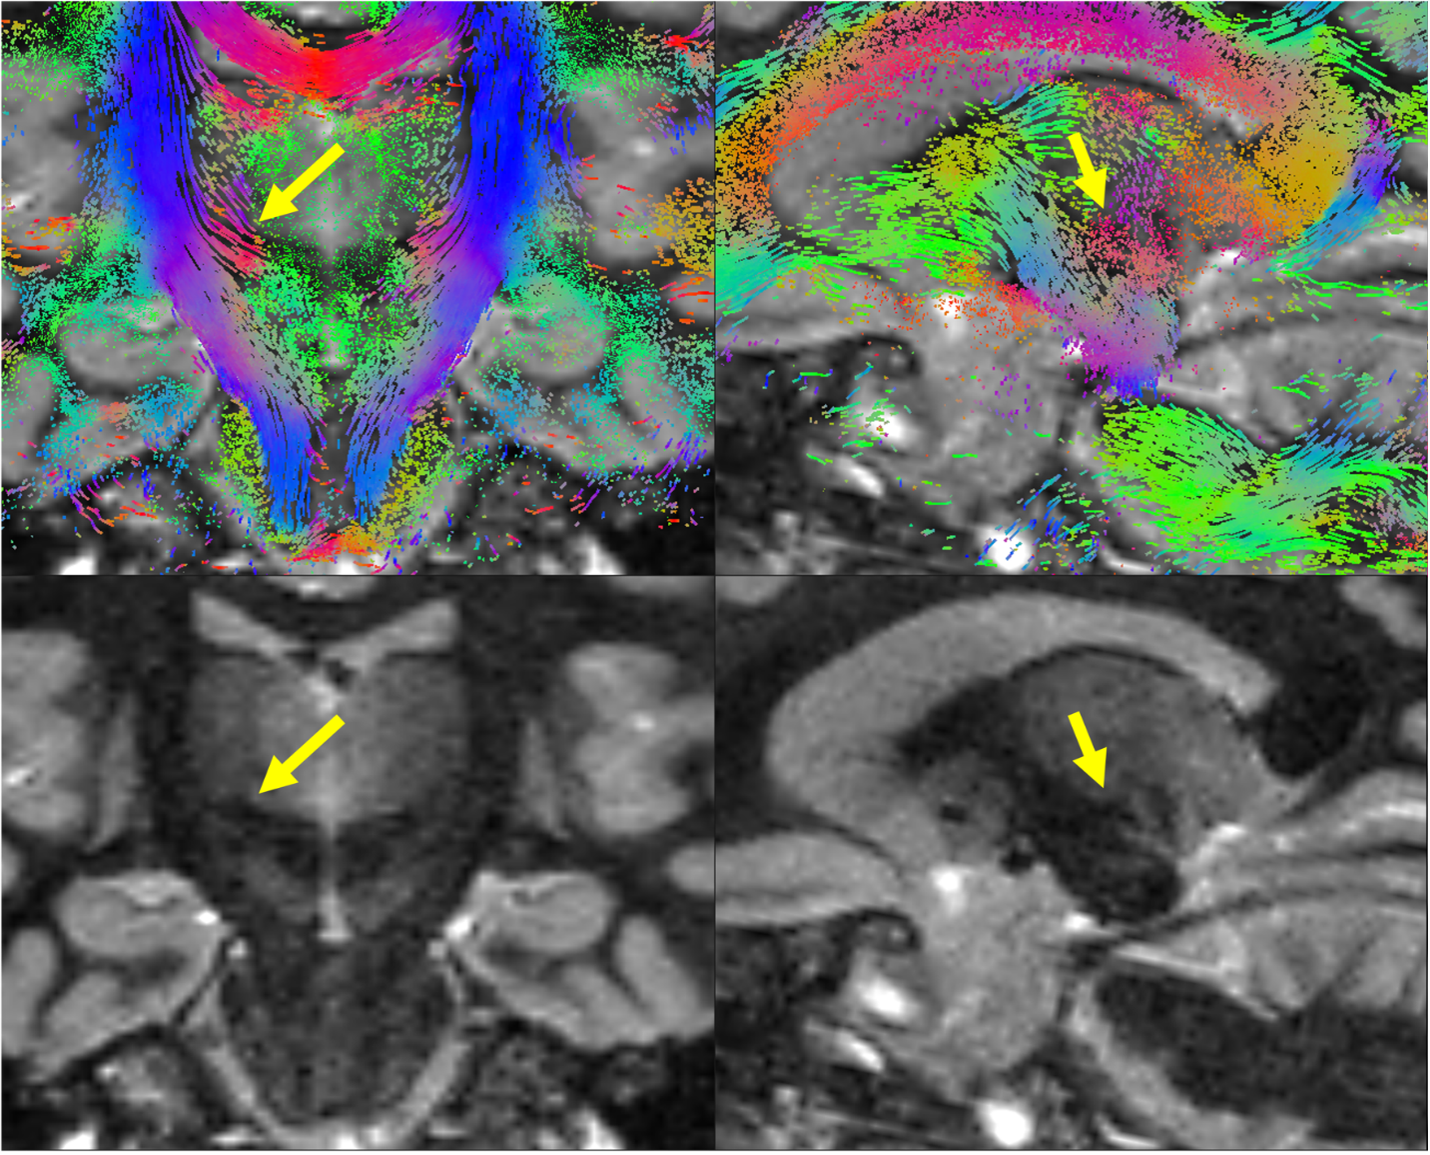
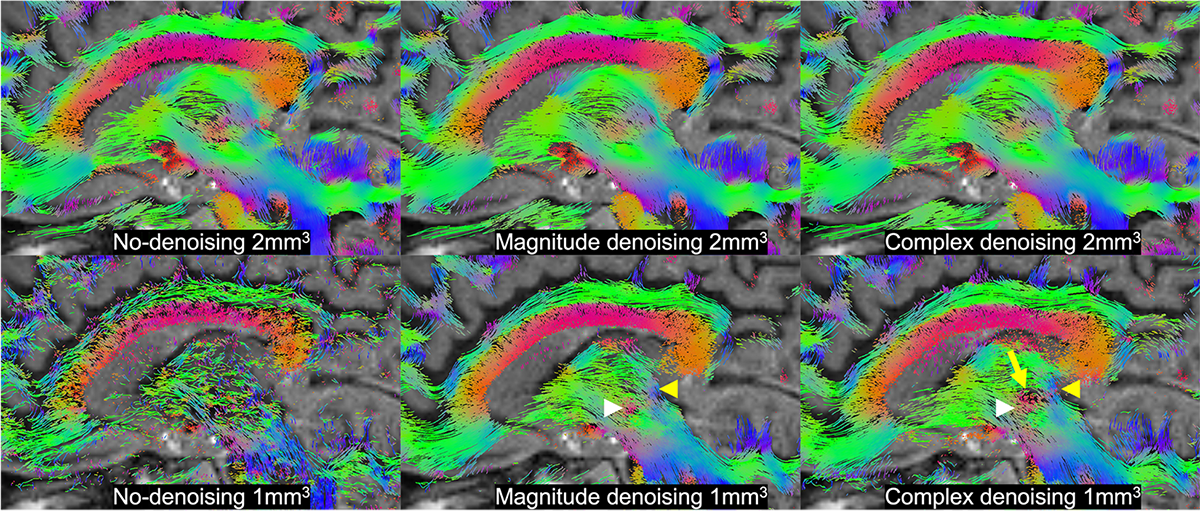
Figure 1,2 show box plots, histograms of MD, MK, and FA for white matter: Complex denoising on low resolution (2mm3) data led to minimal variance at the region-of-interest level ($$$\sigma_{MD}=0.24$$$ over all WM). Using non-denoised 2mm3 data as an index standard for quantitative comparisons, complex denoising resulted in the lowest variance at 1mm3 ($$$\sigma_{MD}=0.29$$$ over all WM) and reduced MD bias to just 3.0% compared to -13.6% for magnitude denoising and -11.5% for no-denoising over all white matter. Likewise in MK, complex denoising reduced bias to -10.5% ($$$\sigma_{MK}=0.33$$$), compared to 51.2% ($$$\sigma_{MK}=0.41$$$) for magnitude denoising and 14.7% ($$$\sigma_{MK}=0.51$$$) for no-denoising. For FA, we observed slightly increased bias in complex denoising, but reduced variance after denoising (none - $$$\sigma_{FA}=0.20$$$, magnitude - $$$\sigma_{FA}=0.175$$$, complex $$$\sigma_{FA}=0.180$$$). However, Figure 3 shows that even though no-denoising appears to have lower bias compared to magnitude denoising, the corresponding maps are too noisy to be of statistical or clinical relevance.Figures 4 and 5 show the results of probabilistic tensor-based fiber tracking in the lateral thalamus. In this region the terminations of the medial lemniscus and dentarubrothalamic tract are not seen at 2-mm resolution, and only visualized after magnitude and complex denoising of the 1-mm resolution images respectively.
Discussion and Conclusion
Performing DTI alone at low b-values does not result in clinically useful data at 1-mm resolution (Fig.3). Complex denoising reduced parameter bias up to 10% in diffusivities, and 40% in kurtosis values (when compared to magnitude denoising), along with decreased parameter variance caused by noise (Figs. 1-2). State-of-art clinical practice and investigations often use 2-mm isotropic resolution to study subcortical anatomy. However, 1-mm isotropic resolution appears essential for directly visualizing the dentatorubrothalamic tract (a key structure of interest for functional neurosurgery; Figs 4-5), yet without denoising the resulting parametric maps are effectively useless (Fig 3).We showed that 1mm isotropic resolution dMRI along with accurate denoising enabled direct visualization of anisotropic structures in the brainstem, basal ganglia and thalamus, which were previously only evident in ex-vivo studies1. This could advance functional neurosurgery planning and allow for characterizing changes associated with pathology, treatment response or side effects.
Acknowledgements
Research was supported by the National Institute of Neurological Disorders and Stroke of the NIH under awards R01 NS088040 and R21 NS081230, by the National Institute of Biomedical Imaging under award R01 EB027075, by the Hirschl foundation, and R41 CA257624, by the Niational Cancer Institute, and was performed at the Center of Advanced Imaging Innovation and Research (CAI2R, www.cai2r.net), a Biomedical Technology Resource Center supported by NIBIB with the award P41 EB017183
References
1. Aggarwal M, Zhang J, Pletnikova O, et al. Feasibility of creating a high-resolution 3D diffusion tensor imaging based atlas of the human brainstem: a case study at 11.7 T. Neuroimage 2013;74:117–27 CrossRef Medline
2. Sudhyadhom A, Haq IU, Foote KD, et al. A high resolution and high contrast MRI for differentiation of subcortical structures for DBS targeting: the fast gray matter acquisition t1 inversion recovery (FGATIR). Neuroimage 2009;47(Suppl 2);T44–52
3. Shepherd, T. M., Ades-Aron, B., Bruno, M., Schambra, H. M., & Hoch, M. J. (2020). Direct In Vivo MRI Discrimination of Brain Stem Nuclei and Pathways. American Journal of Neuroradiology, 41(5), 777-784.
4. Veraart, J.; Novikov, D.S.; Christiaens, D.; Ades-aron, B.; Sijbers, J. & Fieremans, E. Denoising of diffusion MRI using random matrix theory. NeuroImage, 2016, 142, 394-406, doi: 10.1016/j.neuroimage.2016.08.016
5. Cordero-Grande, L.; Christiaens, D.; Hutter, J.; Price, A.N.; Hajnal, J.V. Complex diffusion-weighted image estimation via matrix recovery under general noise models. NeuroImage, 2019, 200, 391-404, doi: 10.1016/j.neuroimage.2019.06.0391
6. Donoho, D. L., Gavish, M., & Johnstone, I. M. (2018). Optimal shrinkage of eigenvalues in the spiked covariance model. Annals of statistics, 46(4), 1742.
7. Ades-Aron, B., Veraart, J., Kochunov, P., McGuire, S., Sherman, P., Kellner, E., ... & Fieremans, E. (2018). Evaluation of the accuracy and precision of the diffusion parameter EStImation with Gibbs and NoisE removal pipeline. NeuroImage, 183, 532-543.
8. Lee, H. H., Novikov, D. S., & Fieremans, E. (2021). Removal of partial Fourier‐induced Gibbs (RPG) ringing artifacts in MRI. Magnetic Resonance in Medicine.
9. Jesper L. R. Andersson and Stamatios N. Sotiropoulos. An integrated approach to correction for off-resonance effects and subject movement in diffusion MR imaging. NeuroImage, 125:1063-1078, 2016.
10. J.L.R. Andersson, S. Skare, J. Ashburner. How to correct susceptibility distortions in spin-echo echo-planar images: application to diffusion tensor imaging. NeuroImage, 20(2):870-888, 2003.
11. Veraart, J., Sijbers, J., Sunaert, S., Leemans, A., & Jeurissen, B. (2013). Weighted linear least squares estimation of diffusion MRI parameters: strengths, limitations, and pitfalls. Neuroimage, 81, 335-346.
12. M. Jenkinson and S.M. Smith. A global optimisation method for robust affine registration of brain images. Medical Image Analysis, 5(2):143-156, 2001.
Figures