2103
Structural connectivity estimates are accurate: the outcome of diffusion-simulated connectivity (DiSCo) challenge1CIBM Center for Biomedical Imaging, Lausanne, Switzerland, 2Radiology Department, Centre Hospitalier Universitaire Vaudois and University of Lausanne, Lausanne, Switzerland, 3Signal Processing Laboratory (LTS5), Ecole Polytechnique Fédérale de Lausanne (EPFL), Lausanne, Switzerland, 4Univ Rennes, Inria, CNRS, Inserm, IRISA UMR 6074, Empenn ERL U-1228, Rennes, France, 5A.I. Virtanen Institute for Molecular Sciences, University of Eastern Finland, Kuopio, Finland, 6Department of Neuroscience and Biomedical Engineering, Aalto University, Espoo, Finland, 7Department of Psychiatry, Helsinki University Hospital, Helsinki, Finland, 8Waisman Center, University of Wisconsin-Madison, Madison, WI, United States, 9Department of Radiology, University of Wisconsin-Madison, Madison, WI, United States, 10Department of Medicine, University of Wisconsin-Madison, Madison, WI, United States, 11Department of Medical Physics, University of Wisconsin-Madison, Madison, WI, United States, 12Department of Psychiatry, University of Wisconsin-Madison, Madison, WI, United States, 13Diffusion Imaging and Connectivity Estimation (DICE) Lab, Department of Computer Science, University of Verona, Verona, Italy, 14Translational Imaging in Neurology (ThINk), Department of Biomedical Engineering, University Hospital Basel and University of Basel, Basel, Switzerland, 15Department of Advanced Biomedical Sciences, University of Naples “Federico II”, Naples, Italy, 16Sherbrooke Connectivity Imaging Laboratory (SCIL), Department of Computer Science, University of Sherbrooke, Sherbrooke, QC, Canada, 17Brno Faculty of Electrical Engineering and Communication, Department of mathematics, University of Technology, Brno, Czech Republic, 18Department of neurosciences, biomedicine and movement sciences, University of Verona, Verona, Italy, 19Department of Neuroscience, Rehabilitation, Ophthalmology, Genetics, Maternal and Child Health (DINOGMI), University of Genoa, Genoa, Italy, 20AGH University of Science and Technology, Kraków, Poland, 21Laboratorio de Procesado de Imagen (LPI), Universidad de Valladolid, Valladolid, Spain, 22Athena Project Team, Centre Inria d'Université Côte d'Azur, Sophia Antipolis, France, 23Department of Radiology and Radiological Sciences, Vanderbilt University Medical Center, Nashville, TN, United States, 24Department of Electrical and Computer Engineering, Vanderbilt University, Nashville, TN, United States, 25Brain Mapping Lab, Department of Biomedical, Dental Sciences and Morphological and Functional Images, University of Messina, Messina, Italy, 26Center for Advanced Imaging Innovation and Research (CAI2R), Department of Radiology, NYU Langone Health, New York, NY, United States, 27Department of Neurosurgery, Perlmutter Cancer Center, Neuroscience Institute, Kimmel Center for Stem Cell Biology, NYU Langone Health, New York, NY, United States, 28Computer Science Department. Centro de Investigación en Matemáticas A.C., Guanajuato, Mexico, 29Center for Biomedical Imaging, Department of Radiology, NYU School of Medicine, New York, NY, United States, 30Instituto de Neurobiología, Universidad Nacional Autónoma de México, Juriquilla, Mexico, 31Department of Biomedical Engineering, The University of Melbourne, Parkville, Australia, 32Melbourne Neuropsychiatry Centre, Department of Psychiatry, The University of Melbourne and Melbourne Health, Parkville, Australia, 33The University of Sydney, School of Biomedical Engineering, Sydney, Australia, 34McGill University, Montréal, QC, Canada, 35Department of Radiology and Biomedical Research Imaging Center (BRIC), The University of North Carolina at Chapel Hill, Chapel Hill, NC, United States, 36Department of Applied Mathematics and Computer Science, Technical University of Denmark, Kgs. Lyngby, Denmark
Synopsis
The estimation of structural connectivity from DW-MRI is a challenging task, in part due to false-positive connections. Building on previous efforts, the MICCAI-CDMRI Diffusion-Simulated Connectivity (DiSCo) challenge was organized with the aim of evaluating connectivity methods using large-scale synthetic datasets obtained from DW-MRI Monte-Carlo simulations. The outcome of the challenge suggests that methods selected by the 14 teams participating in the challenge provide both high correlations between estimated and ground-truth connectivity weights and high accuracy in binary connectivity identification. Furthermore, the challenge provided unique data with realistic connectivity and microstructure properties to foster the development of connectivity estimation methods.
Introduction
Over the last decade, protocols for diffusion-weighted magnetic resonance imaging (DW-MRI) acquisition, local modelling, tractography algorithms, and connectivity mapping methods have improved significantly1. However, concerns remain about the reliability of connectivity mapping in vivo, particularly the abundance of false-positive connectivity estimations2. While the rich signal from physical MRI phantoms has been used to test and validate methods3, their macrostructure complexity is insufficient for quantifying connectivity. Synthetic phantoms have also been proposed and demonstrated to be important tools for method development4,5,6, but their signal biological realism with respect to microstructure is limited. Monte-Carlo methods7,8,9 can provide realistic DW-MRI signals with macroscopic complexity, and thus, are suitable for connectivity validation.The MICCAI-CDMRI 2021 Diffusion-Simulated Connectivity (DiSCo) challenge10 was organized to compare connectivity methods using three novel large-scale synthetic phantoms for connectivity assessment11,12. Fourteen teams, composed of 57 researchers, submitted 203 weighted connectivity matrices estimating the ground-truth connectivity.
Methods
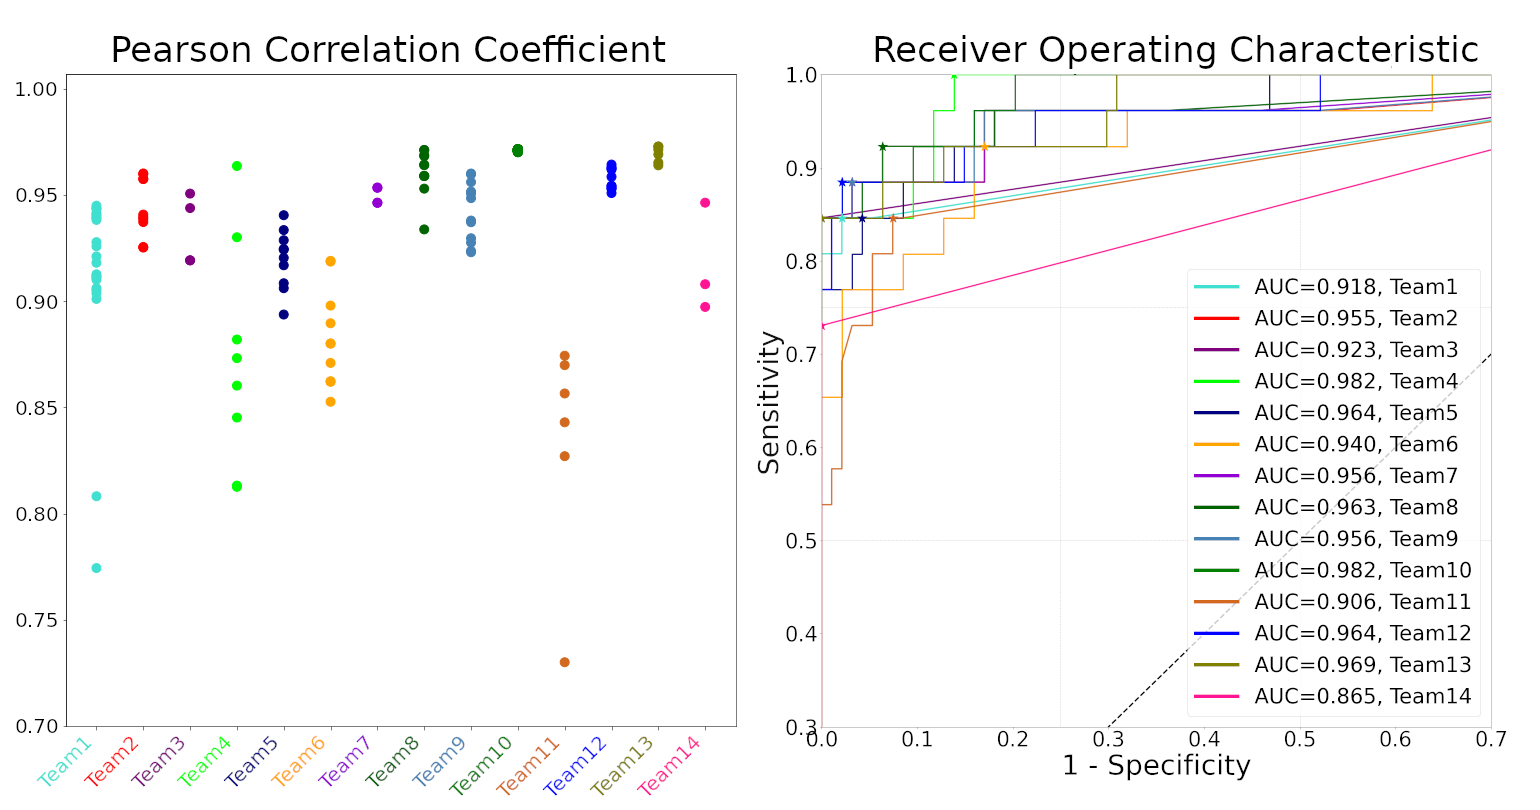
The three synthetic phantoms used for the challenge11 are composed of approximately 12,000 synthetic tubular fibres with diameters ranging from 1.4 μm to 4.2 μm, connecting 16 Regions of Interest (ROIs), yielding an average connection density of 22.2%. The simulation substrates have an unprecedented volume of 1 cubic millimetre, resulting in an image size of 40x40x40 voxels (25 μm isotropic). Within each voxel, the signal was simulated using Monte-Carlo simulations of spin dynamics with a density of one particle per micrometre cube7,11, then corrupted with Rician noise (SNR=30). The DW-MRI protocol was composed of 360 measurements, equally spread over 4 b-value shells (1000, 1925, 3094, 13191 s/mm2). The simulated images capture microscopic properties of the white matter (e.g., fibre diameter, water diffusing within and around fibres), while also having targeted macroscopic properties (e.g. smoothness of the trajectories).Participating teams were provided with a label map of the ROIs defining the connectivity endpoints and were asked to submit a 16x16 weighted connectivity matrix of the test dataset. The estimated connection strengths between any two pairs of ROIs were compared with the ground-truth total cross-sectional area of the synthetic fibres connecting both ROIs. Participants had access to one dataset for training and one dataset for validation. The Pearson correlation coefficient (r) between the ground-truth matrix and the submitted matrices was used for ranking teams. We further performed a Receiver Operating Characteristic (ROC) analysis of each team’s matrix with the highest r. Figure 1 shows the ground-truth synthetic fibre trajectories of the test dataset.
Results and Discussion
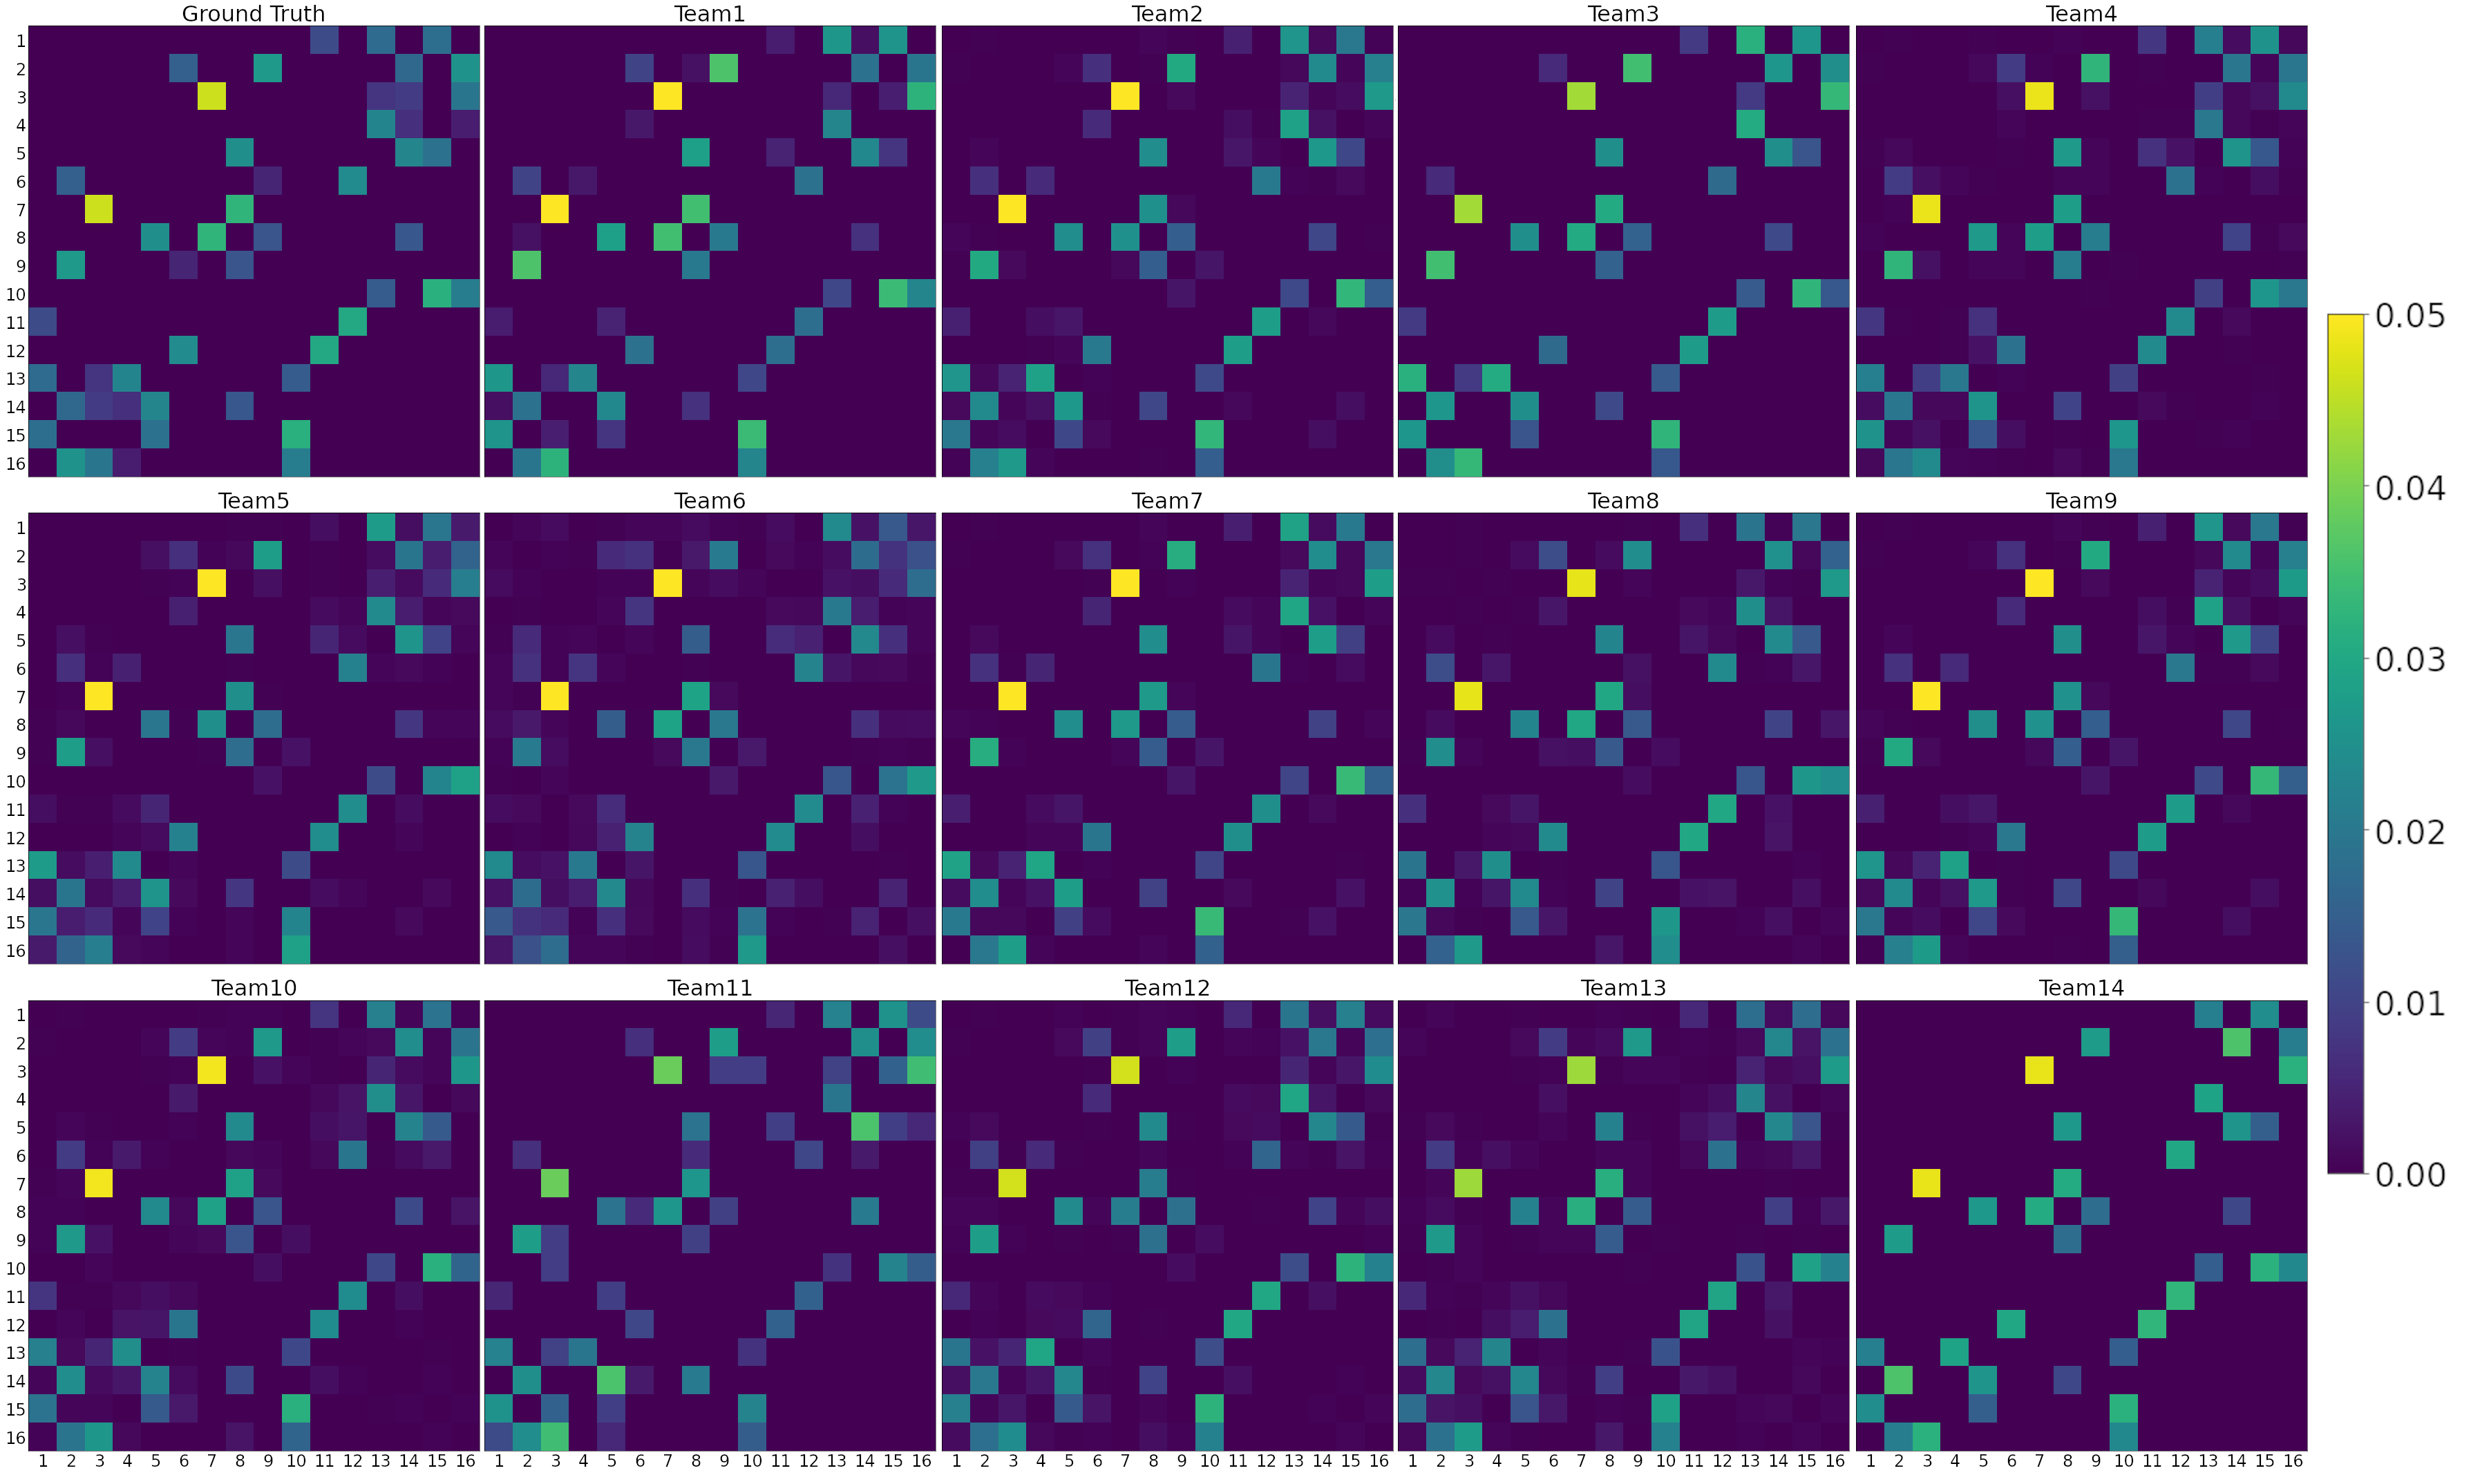
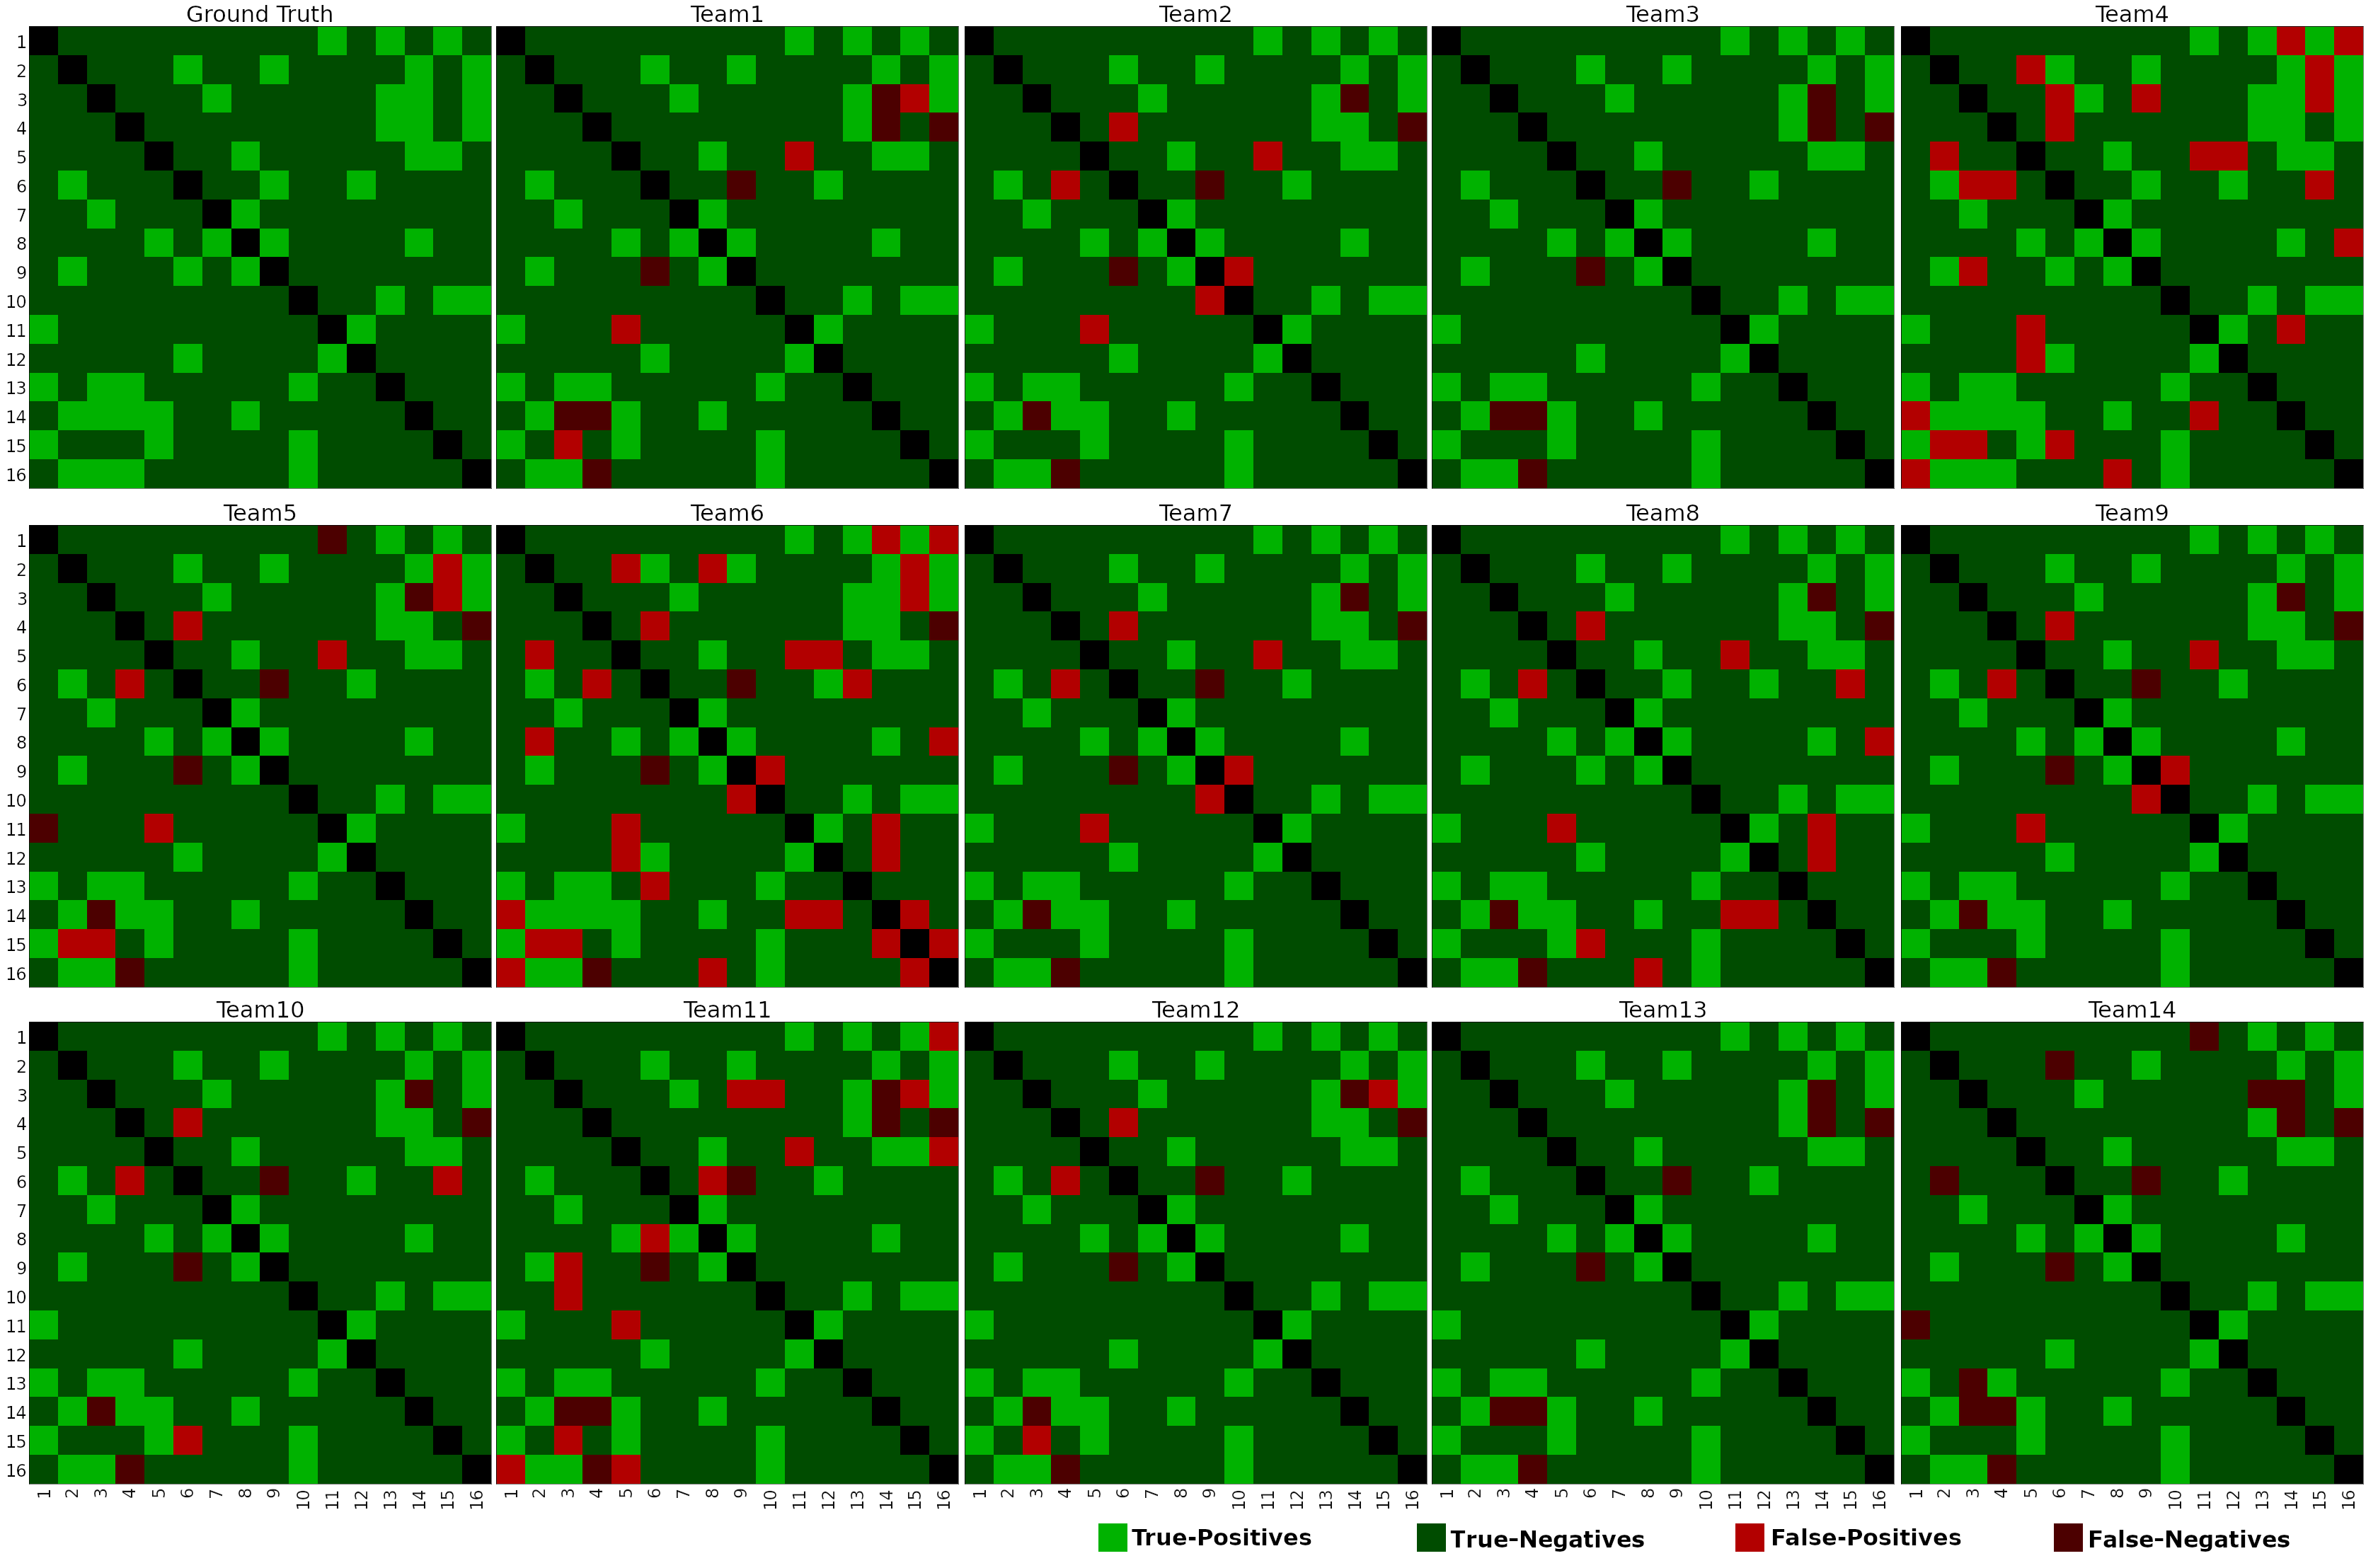
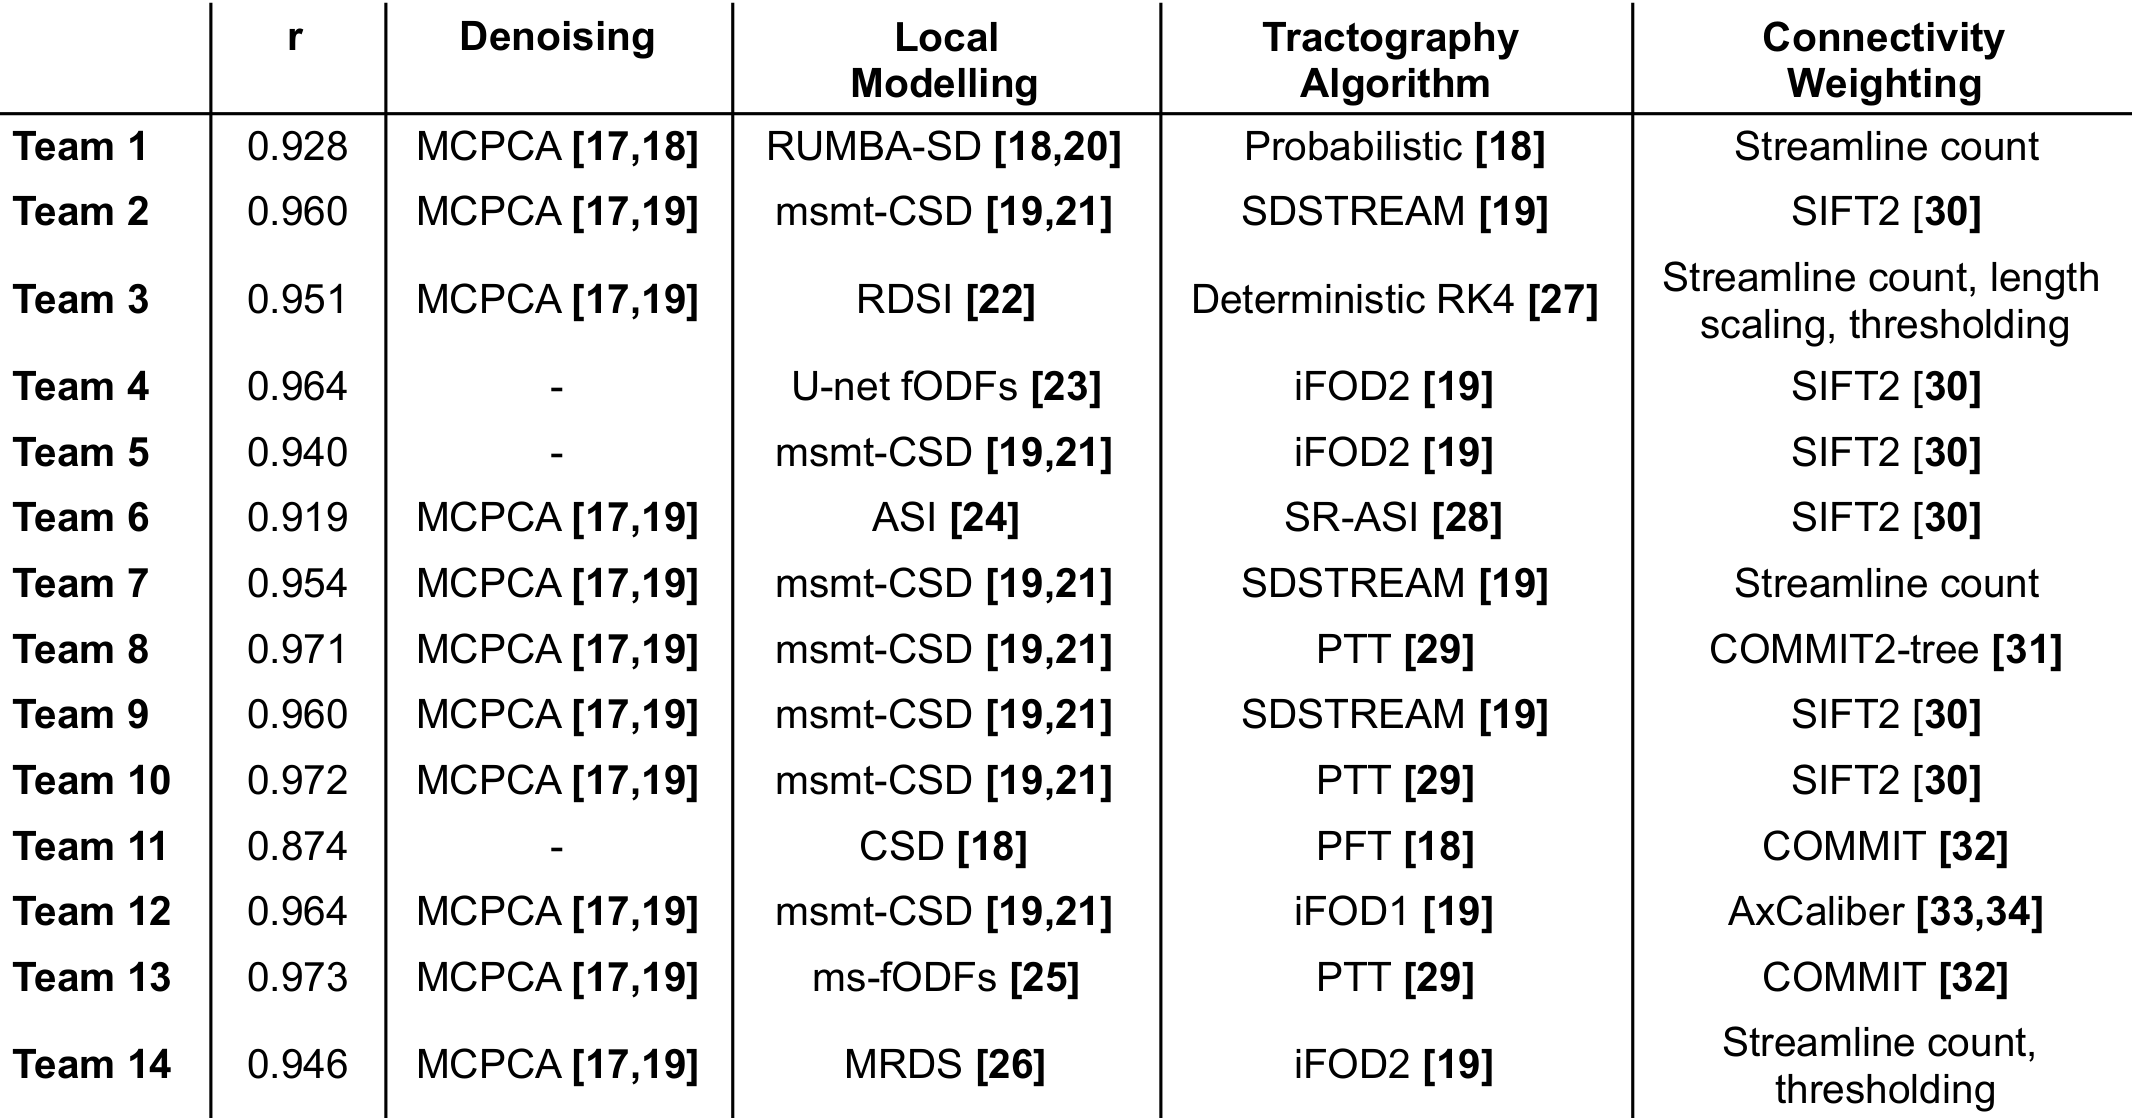
The ground-truth connectivity matrix of the test dataset is shown in Figure 2, alongside each team’s best-performing matrix. Figure 3 (left) shows the Pearson correlation coefficients for all submitted matrices. The best-performing matrix of each team ranges from r=0.874 to r=0.973 (mean r=0.950). The obtained correlation coefficients are higher than those reported in connectivity studies comparing DW-MRI weight estimation and labelled cell counts from tracing studies in the intraparietal sulcus13 (r=0.65) and intrahemispheric14 (r=0.59) connections. This may suggest that the data we used is oversimplified when compared to real data. Indeed, typical MRI artifacts15 were not simulated. Despite the realism achieved with DiSCo phantoms, real tissue shows a higher heterogeneity16 that was not reproduced, which may affect the relevance of some findings on biological tissue data. However, it is possible to know the ground-truth connectivity with higher accuracy compared to tracing studies17.Figure 3 (right) shows the ROC curves for the best-performing methods of each team. The corresponding area under the curve (AUC) is reported in the legend, ranging from AUC=0.865 to AUC=0.982 (mean AUC=0.946). Figure 4 shows the corresponding pairs of ROIs classification using each method’s weight thresholding that maximizes the sum of specificity and sensitivity, indicated by the star markers in Figure 3 (right). Team 4 obtained a sensitivity of 1 (i.e. no false-negatives), and Teams 3, 13, and 14 obtained a specificity of 1 (i.e. no false-positives). Team 13 submission is also the method with the highest r. Moreover, Team 3 and 13 best-performing matrices had no false-positives, even before applying the optimal thresholding (i.e. the optimal threshold was 0). This was achieved by teams via thresholding of their matrices prior to the challenge submission, with a threshold value estimated using the training dataset. Each team's best-performing method is listed in Table 1.
Conclusion
Current tractography and connectivity methods show exceptional performance on the DiSCo datasets. All methods selected by participating teams were able to accurately estimate connectivity weights corresponding to the cross-sectional area of the synthetic fibres connecting the network. Furthermore, they were able to accurately identify the pairs of ROIs interconnected by synthetic fibres. Previous phantoms were designed to validate either tractography or microstructure; we believe that the DiSCo phantoms enable an improved assessment of the reliability of quantitative connectivity methods thanks to their microscopic and macroscopic properties. Future work should focus on adding MRI artefacts, changing spatial and angular resolutions, as well as varying the DW-MRI protocol. The DiSCo datasets are available publicly11 to foster the development of the next generation of structural connectivity methods.Acknowledgements
We acknowledge access to the facilities and expertise of the CIBM Center for Biomedical Imaging, a Swiss research center of excellence founded and supported by Lausanne University Hospital (CHUV), University of Lausanne (UNIL), Ecole polytechnique fédérale de Lausanne (EPFL), University of Geneva (UNIGE) and Geneva University Hospitals (HUG). The calculations have been performed using the facilities of the Scientific IT and Application Support Center of EPFL. We gratefully acknowledge the support of NVIDIA Corporation with the donation of the Titan Xp GPU used for this research. This project has received funding from the Swiss National Science Foundation under grant number 205320_175974 and Spark grant number 190297. Marco Pizzolato acknowledges the European Union’s Horizon 2020 research and innovation programme under the Marie Skłodowska-Curie grant agreement No 754462. Erick J. Canales-Rodríguez was supported by the Swiss National Science Foundation (SNSF, Ambizione grant PZ00P2_185814). This research project is part of the MMINCARAV Inria associate team program between Empenn (Inria Rennes Bretagne Atlantique) and LTS5 (École Polytechnique Fédérale de Lausanne - EPFL) that started in 2019. Raphaël Truffet’s PhD is partly funded by ENS Rennes. Tomasz Pieciak acknowledges the Polish National Agency for Academic Exchange for the grant PN/BEK/2019/1/00421 under the Bekker programme and the Ministry of Science and Higher Education (Poland) under the scholarship for outstanding young scientists (692/STYP/13/2018). Dominika Ciupek acknowledges the Ministry of Education and Science (Poland) for the grant MEiN/2021/209/DIR/NN4 under the "Best of the Best! 4.0" programme. Ye Wu, Sahar Ahmad, and Pew-Thian Yap were supported in part by the United States National Institute of Mental Health (R01MH125479). Patryk Filipiak, Tim Shepherd, Ying-Chia Lin, Dimitris G. Placantonakis, Fernando E. Boada and Steven H. Baete are supported in part by the National Institutes of Health (R01-EB028774, R01-NS082436 and P41-EB017183). Athena Project Team acknowledges that this work was supported by the ERC under the European Union’s Horizon 2020 research and innovation program (ERC Advanced Grant agreement No 694665:CoBCoM : Computational Brain Connectivity Mapping) and it has been partly supported by the French government, through the 3IA Côte d’Azur Investments in the Future project managed by the National Research Agency (ANR) with the reference number ANR-19-P3IA-0002. Athena Project Team is grateful to Inria Sophia Antipolis - Méditerranée https://wiki.inria.fr/ClustersSophia/Usage_policy ”Nef” computation cluster for providing resources and support. Team from UW-Madison would like to acknowledge the NIH grants U54HD090256, R01NS092870, R01EB022883, R01AI117924, R01AG027161, RF1AG059312, P50AG033514, R01NS105646, UF1AG051216, R01NS111022, R01NS117568, P01AI132132, R01AI138647, R34DA050258, and R01AG037639.References
1 Jeurissen, B., Descoteaux, M., Mori, S., & Leemans, A. (2017). Diffusion MRI fiber tractography of the brain. NMR in Biomedicine, e3785. https://doi.org/10.1002/nbm.3785
2 Maier-Hein, K. H., Neher, P. F., Houde, J.-C., Côté, M.-A., Garyfallidis, E., Zhong, J., Chamberland, M., Yeh, F.-C., Lin, Y.-C., Ji, Q., Reddick, W. E., Glass, J. O., Chen, D. Q., Feng, Y., Gao, C., Wu, Y., Ma, J., Renjie, H., Li, Q., … Descoteaux, M. (2017). The challenge of mapping the human connectome based on diffusion tractography. Nature Communications, 8(1), 1349. https://doi.org/10.1038/s41467-017-01285-x
3 Fillard, P., Descoteaux, M., Goh, A., Gouttard, S., Jeurissen, B., Malcolm, J., Ramirez-Manzanares, A., Reisert, M., Sakaie, K., Tensaouti, F., Yo, T., Mangin, J.-F., & Poupon, C. (2011). Quantitative evaluation of 10 tractography algorithms on a realistic diffusion MR phantom. NeuroImage, 56(1), 220–234. https://doi.org/10.1016/j.neuroimage.2011.01.032
4 Neher, P. F., Laun, F. B., Stieltjes, B., & Maier-Hein, K. H. (2013). Fiberfox: Facilitating the creation of realistic white matter software phantoms. Magnetic Resonance in Medicine. http://www.ncbi.nlm.nih.gov/pubmed/24323973
5 Neher, P. F., Laun, F. B., Stieltjes, B., & Maier-Hein, K. H. (2013). Fiberfox: Facilitating the creation of realistic white matter software phantoms. Magnetic Resonance in Medicine. http://www.ncbi.nlm.nih.gov/pubmed/24323973
6 Close, T. G., Tournier, J.-D., Calamante, F., Johnston, L. A., Mareels, I., & Connelly, A. (2009). A software tool to generate simulated white matter structures for the assessment of fibre-tracking algorithms. NeuroImage, 47(4), 1288–1300. https://doi.org/10.1016/J.NEUROIMAGE.2009.03.077
7 Rafael-Patino, J., Romascano, D., Ramirez-Manzanares, A., Canales-Rodríguez, E. J., Girard, G., & Thiran, J.-P. (2020). Robust Monte-Carlo Simulations in Diffusion-MRI: Effect of the Substrate Complexity and Parameter Choice on the Reproducibility of Results. Frontiers in Neuroinformatics, 14, 8. https://doi.org/10.3389/fninf.2020.00008
8 Lee, H. H., Fieremans, E., & Novikov, D. S. (2021). Realistic Microstructure Simulator (RMS): Monte Carlo simulations of diffusion in three-dimensional cell segmentations of microscopy images. Journal of Neuroscience Methods, 350, 109018. https://doi.org/10.1016/j.jneumeth.2020.109018
9 Hall, M. G., & Alexander, D. C. (2009). Convergence and parameter choice for Monte-Carlo simulations of diffusion MRI. IEEE Transactions on Medical Imaging, 28(9), 1354–1364. http://ieeexplore.ieee.org/xpl/articleDetails.jsp?arnumber=4797853
10 Girard, G., Caruyer, E., Rafael-Patino, J., Pizzolato, M., Truffet, R., & Thiran, J.-P. (2021). Diffusion-Simulated Connectivity Challenge. 24th International Conference on Medical Image Computing and Computer Assisted Intervention (MICCAI 2021). https://doi.org/10.5281/ZENODO.4733450
11 Rafael-Patino, J., Girard, G., Truffet, R., Pizzolato, M., Caruyer, E., & Thiran, J. P. (2021). The diffusion-simulated connectivity (DiSCo) dataset. Data in Brief, 38, 107429. https://doi.org/10.1016/J.DIB.2021.107429
12 Rafael-Patino, J., Girard, G., Truffet, R., Pizzolato, M., Thiran, J.-P., & Caruyer, E. (2021). The Microstructural Features of the Diffusion-Simulated Connectivity (DiSCo) Dataset. Lecture Notes in Computer Science (Including Subseries Lecture Notes in Artificial Intelligence and Lecture Notes in Bioinformatics), 13006 LNCS, 159–170. https://doi.org/10.1007/978-3-030-87615-9_14
13 Caminiti, R., Girard, G., Battaglia-Mayer, A., Borra, E., Schito, A., Innocenti, G. M., & Luppino, G. (2021). The Complex Hodological Architecture of the Macaque Dorsal Intraparietal Areas as Emerging from Neural Tracers and DW-MRI Tractography. ENeuro, 8(4). https://doi.org/10.1523/ENEURO.0102-21.2021
14 Donahue, C. J., Sotiropoulos, S. N., Jbabdi, S., Hernandez-Fernandez, M., Behrens, T. E., Dyrby, T. B., Coalson, T., Kennedy, H., Knoblauch, K., Van Essen, D. C., & Glasser, M. F. (2016). Using Diffusion Tractography to Predict Cortical Connection Strength and Distance: A Quantitative Comparison with Tracers in the Monkey. The Journal of Neuroscience, 36(25), 6758–6770. https://doi.org/10.1523/JNEUROSCI.0493-16.2016
15 Bihan, D. Le, Poupon, C., Amadon, A., & Lethimonnier, F. (2006). Artifacts and pitfalls in diffusion MRI. Journal of Magnetic Resonance Imaging, 24(3), 478–488. https://doi.org/10.1002/JMRI.20683
16 Andersson, M., Kjer, H. M., Rafael-Patino, J., Pacureanu, A., Pakkenberg, B., Thiran, J. P., Ptito, M., Bech, M., Dahl, A. B., Dahl, V. A., & Dyrby, T. B. (2021). Axon morphology is modulated by the local environment and impacts the noninvasive investigation of its structure–function relationship. Proceedings of the National Academy of Sciences of the United States of America, 117(52), 33649–33659. https://doi.org/10.1073/PNAS.2012533117
17 Veraart, J., Novikov, D. S., Christiaens, D., Ades-aron, B., Sijbers, J., & Fieremans, E. (2016). Denoising of diffusion MRI using random matrix theory. NeuroImage, 142, 394–406. https://doi.org/10.1016/j.neuroimage.2016.08.016
18 Garyfallidis, E., Brett, M., Amirbekian, B., Rokem, A., Van Der Walt, S., Descoteaux, M., Nimmo-smith, I., & Contributors, D. (2014). Dipy, a library for the analysis of diffusion MRI data. Frontiers in Neuroinformatics, 8, 1–5. http://www.frontiersin.org/Journal/10.3389/fninf.2014.00008/abstract
19 Tournier, J. D., Smith, R., Raffelt, D., Tabbara, R., Dhollander, T., Pietsch, M., Christiaens, D., Jeurissen, B., Yeh, C. H., & Connelly, A. (2019). MRtrix3: A fast, flexible and open software framework for medical image processing and visualisation. NeuroImage, 202, 116137. https://doi.org/10.1016/j.neuroimage.2019.116137
20 Canales-Rodríguez, E. J., Daducci, A., Sotiropoulos, S. N., Caruyer, E., Aja-Fernández, S., Radua, J., Mendizabal, J. M. Y., Iturria-Medina, Y., Melie-García, L., Alemán-Gómez, Y., Thiran, J. P., Sarró, S., Pomarol-Clotet, E., & Salvador, R. (2015). Spherical Deconvolution of Multichannel Diffusion MRI Data with Non-Gaussian Noise Models and Spatial Regularization. PLOS ONE, 10(10), e0138910. https://doi.org/10.1371/JOURNAL.PONE.0138910
21 Jeurissen, B., Tournier, J.-D., Dhollander, T., Connelly, A., & Sijbers, J. (2014). Multi-tissue constrained spherical deconvolution for improved analysis of multi-shell diffusion MRI data. NeuroImage, 103, 411–426. https://doi.org/10.1016/j.neuroimage.2014.07.061
22 Baete, S. H., Yutzy, S., & Boada, F. E. (2016). Radial q-space sampling for DSI. Magnetic Resonance in Medicine, 76(3), 769–780. https://doi.org/10.1002/MRM.25917/ASSET/SUPINFO/MRM25917-SUP-0001-SUPPINFO01.PDF
23 Sedlar, S., Papadopoulo, T., Deriche, R., & Deslauriers-Gauthier, S. (2020). Diffusion MRI fiber orientation distribution function estimation using voxel-wise spherical U-net. In Computational Diffusion MRI, MICCAI Workshop.
24 Wu, Y., Lin, W., Shen, D., Yap, P.-T., Consortium, U.B.C.P. (2019) Asymmetry Spectrum Imaging for Baby Diffusion Tractography., in: International Conference on Information Processing in Medical Imaging. Springer, pp. 319-331.
25 Tran, Giang, and Yonggang Shi. (2015) Fiber orientation and compartment parameter estimation from multi-shell diffusion imaging." IEEE transactions on medical imaging 34.11, 2320-2332.
26 Coronado-Leija, R., Ramirez-Manzanares, A., & Marroquin, J. L. (2017). Estimation of individual axon bundle properties by a Multi-Resolution Discrete-Search method. Medical Image Analysis, 42, 26–43. https://doi.org/10.1016/J.MEDIA.2017.06.008
27 Yeh, F.C., (2017). Diffusion MRI reconstruction in DSI Studio. Advanced Biomedical MRI Lab, National Taiwan University Hospital. Available online at: http://dsi-studio. labsolver. org/Manual/Reconstruction# TOC-Q-Space-Diffeomorphic-Reconstruction-QSDR
28 Wu, Y., Hong, Y., Ahmad, S., Chang, W. T., Lin, W., Shen, D., & Yap, P. T. (2020). Globally Optimized Super-Resolution of Diffusion MRI Data via Fiber Continuity. Medical Image Computing and Computer-Assisted Intervention, 12267, 260. https://doi.org/10.1007/978-3-030-59728-3_26
29 Aydogan, D. B., & Shi, Y. (2021). Parallel Transport Tractography. IEEE Transactions on Medical Imaging, 40(2), 635–647. https://doi.org/10.1109/TMI.2020.3034038
30 Smith, R. E., Tournier, J.-D., Calamante, F., & Connelly, A. (2015). SIFT2: Enabling dense quantitative assessment of brain white matter connectivity using streamlines tractography. NeuroImage, 119, 338–351. https://doi.org/10.1016/j.neuroimage.2015.06.092
31 Ocampo-Pineda, M., Schiavi, S., Rheault, F., Girard, G., Petit, L., Descoteaux, M., & Daducci, A. (2021). Hierarchical Microstructure Informed Tractography. Brain Connectivity, 11(2), 75–88. https://doi.org/10.1089/BRAIN.2020.0907
32 Daducci, A., Dal Palu, A., Lemkaddem, A., & Thiran, J.-P. (2014). COMMIT: Convex Optimization Modeling for Micro-structure Informed Tractography. IEEE Transactions on Medical Imaging, 34(1).
33 Fick, R. H. J., Wassermann, D., & Deriche, R. (2019). The Dmipy Toolbox: Diffusion MRI Multi-Compartment Modeling and Microstructure Recovery Made Easy. Frontiers in Neuroinformatics, 13, 64. https://doi.org/10.3389/FNINF.2019.00064/BIBTEX
34 Assaf, Y., Blumenfeld-Katzir, T., Yovel, Y., & Basser, P. J. (2008). AxCaliber: a method for measuring axon diameter distribution from diffusion MRI. Magnetic Resonance in Medicine, 59(6), 1347–1354. https://doi.org/10.1002/mrm.21577
Figures
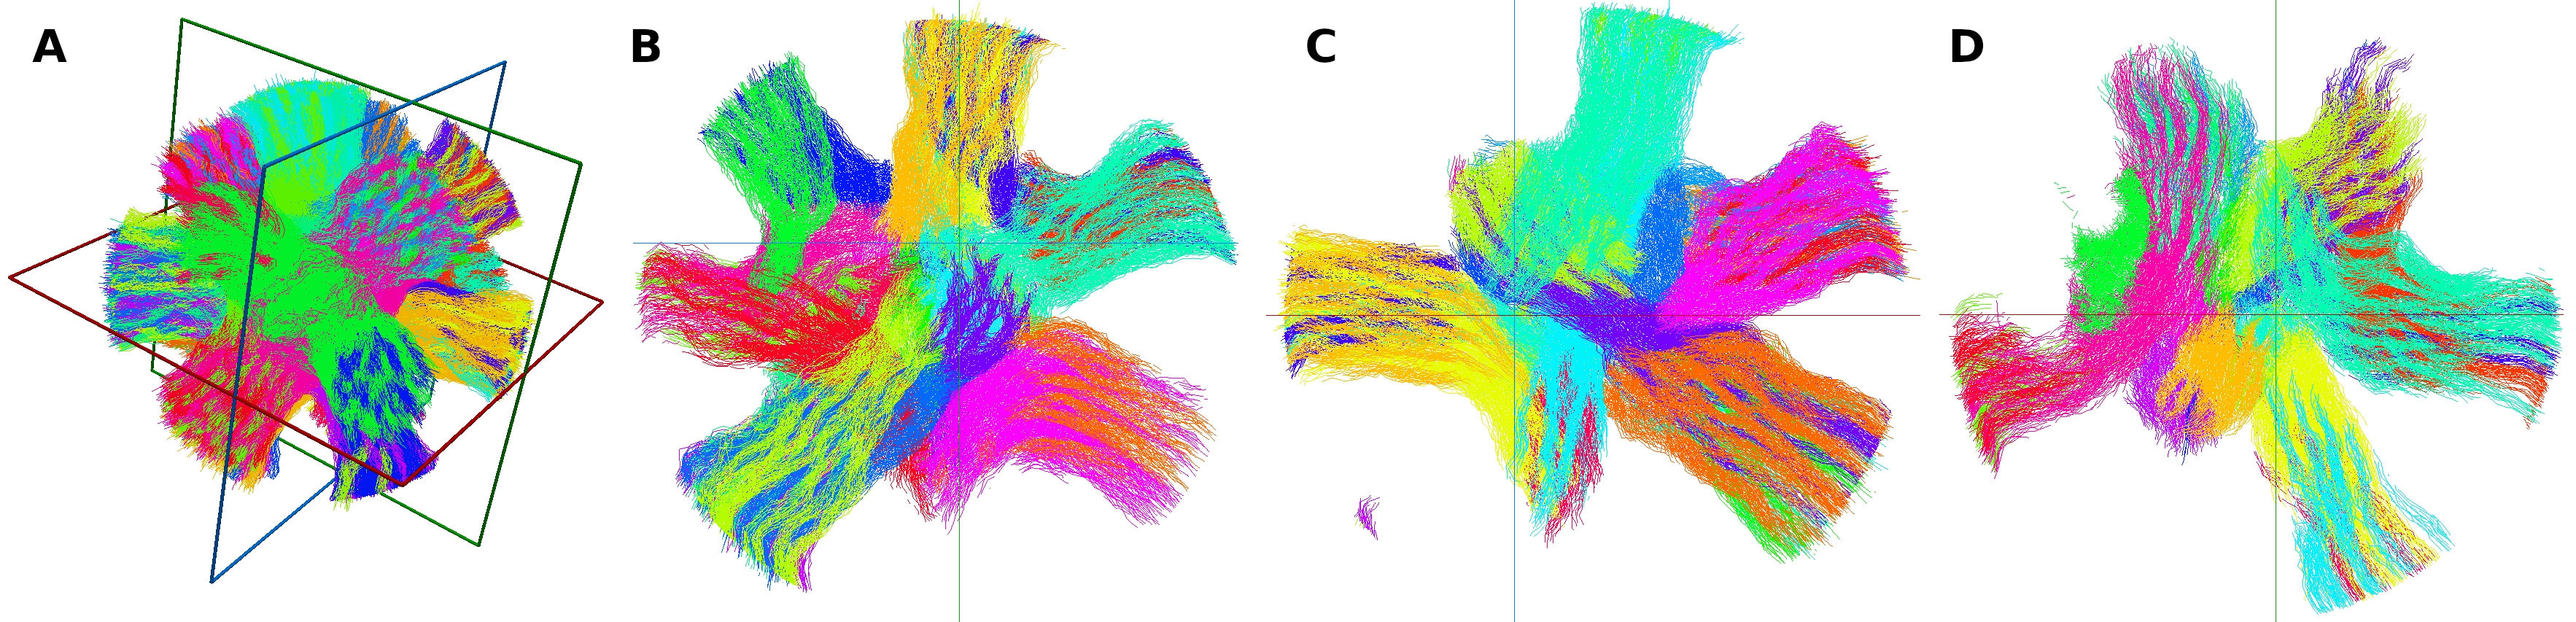
Figure 1. Ground truth 11,032 trajectories of the test dataset in a 3D view (A). The corresponding cross-sectional sections of the dataset are shown in axial (B), sagittal (C) and coronal (D) views. Trajectory segments within 1 mm range of the sections are shown. All trajectories of each of the 26 bundles are shown with a different colour.