2102
Investigation of the inferior fronto-occipital fasciculus in the macaque fascicularis brain using 11.7 T ultra-high field diffusion data1BAOBAB, NeuroSpin, Université Paris-Saclay, CNRS, CEA, Gif-sur-Yvette, France, 2Unité Imagerie & Cerveau (iBrain), UMRS INSERM 1253, Université de Tours, Tours, France
Synopsis
In this study, we investigated the controversial presence of the inferior fronto-occipital fasciculus (IFOF) in the macaque species (Macaca fascicularis) using ultra-high field MRI (11.7 T) diffusion data. Thanks to a fiber clustering approach, we were able to reconstruct the IFOF in both hemispheres. We observed thin frontal connections and a more developed fasciculus on the right hemisphere compared to the left. The presence of this special fasciculus, known in Humans as being part of the ventral pathways for multi-modal language processing, is a new step forward concerning the comprehension of the macaque brain, and the primate brain in general.
Introduction
The frontal lobe of the human brain is central to human cognition and behavior. It is known to be connected to the occipital lobe by the inferior fronto-occipital fasciculus (IFOF)1. Whereas this particular fasciculus seems to be involved in the Human ventral pathways for multi-modal language processing2, the presence of this fasciculus in the non-human primate brain and especially in the macaque brain is still debated. Diffusion MRI is a widely used method of white matter bundles investigation and already permitted a deeper dig into the non-human primate brain connectivity singularity3,4. Using an ultra-high field diffusion MRI protocol at 11.,7 Tesla and a dedicated tractography and fiber clustering pipeline, we assess in this work, the controversial presence of an IFOF in the macaca fasculis species.Methods
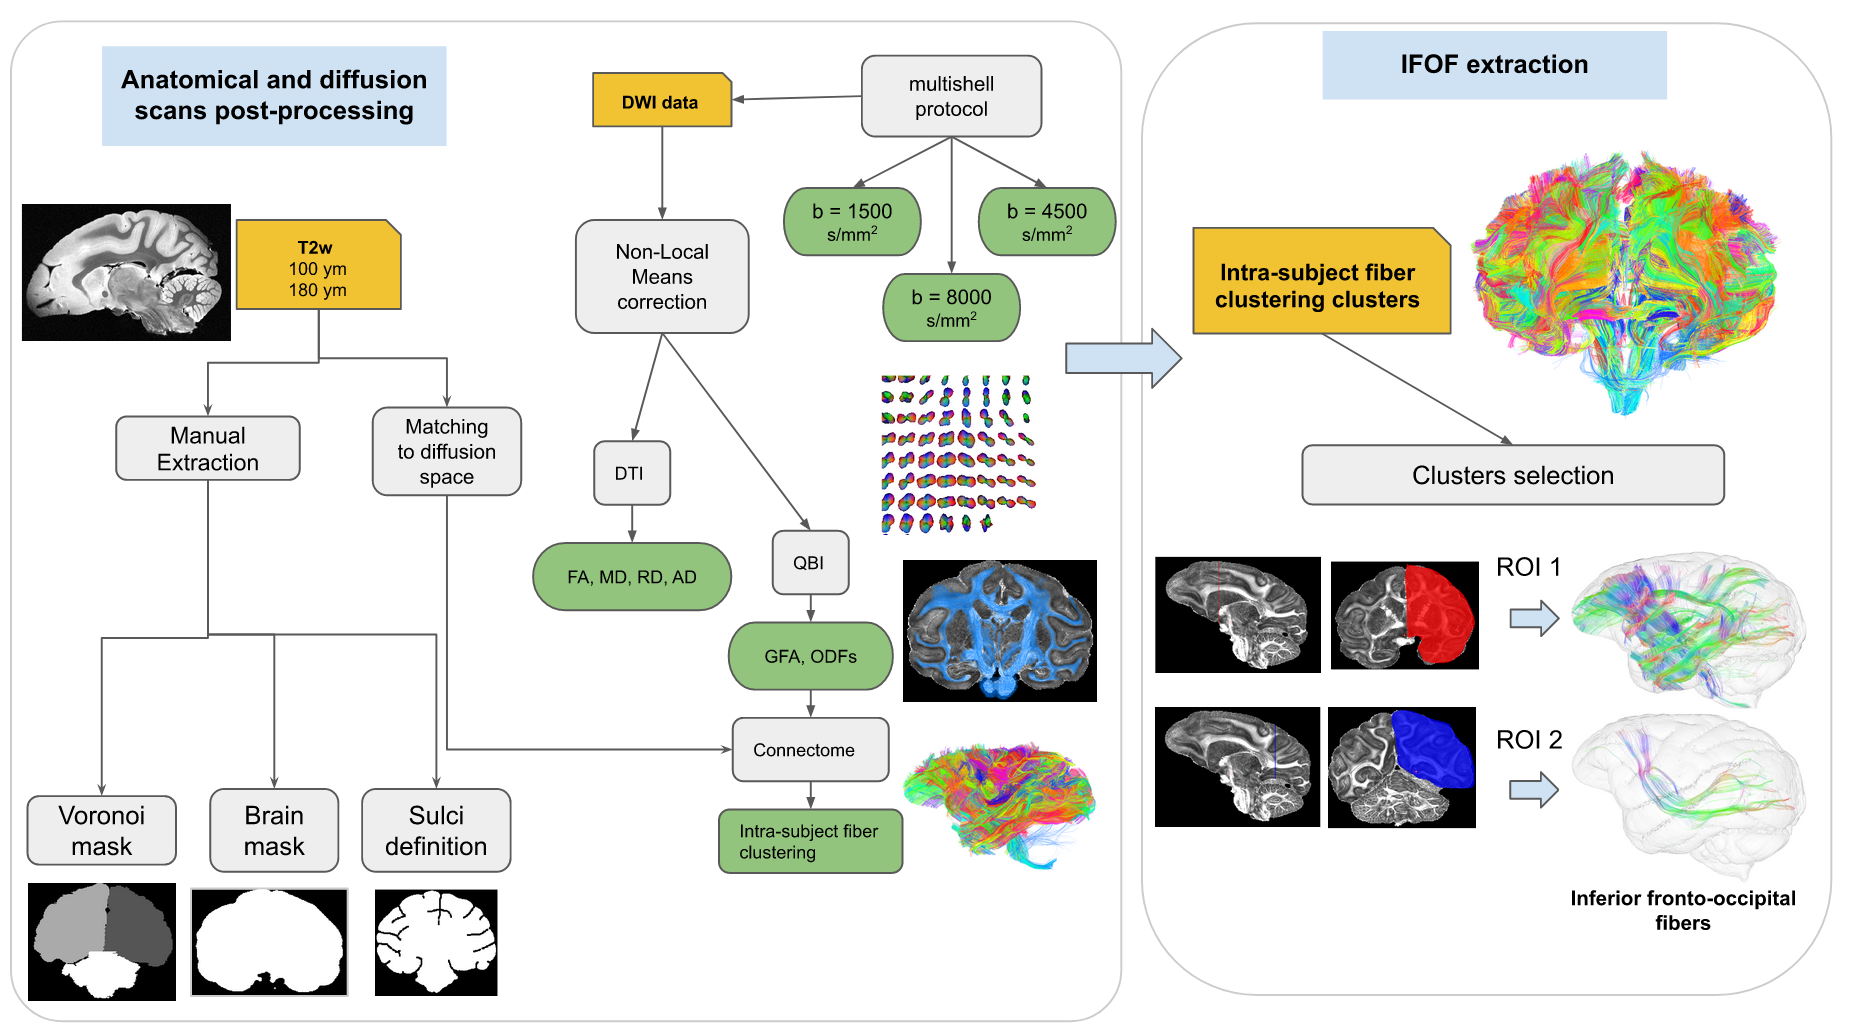
Subject - One female macaque (Macaca Fascicularis species) brain of 3 years old collected by the INSERM U1253 iBrain Unit (University of Tours, France) was studied in the frame of an imaging protocol approved by the Local Animal Welfare Committee.Imaging protocol - The subject was scanned using a Bruker Biospin 11.7 T MRI system and a 60mm volume coil with an imaging protocol including a 3D T2-weighted MSME 100μm scan, a 180μm 2D T2-weighted MSME scan and a multishell diffusion MRI (dMRI) scan using a 3D segmented EPI PGSE sequence at b=1500/4500/8000s/mm² along 25/60/90 directions (TE/TR=24/250ms, 33 segments, 0.25mm isotropic resolution).
Pre/Post-processing - After correcting for imaging artifacts, dMRI data were used to compute analytical Q-ball ODF maps5 (SH order 6, Laplace-Beltrami regularization factor of 0.006) from which a whole brain regularized deterministic tractography6 was performed (1 seed/voxel, forward step 60um, aperture angle 15°, GFA threshold 0.04) to obtain the subject’s tractogram. A hierarchical fiber clustering algorithm7 was then applied to the tractogram to create a parsimonious representation of the tractogram composed of small white matter fascicles (represented individually by a centroid fiber) subdivided in two sets corresponding to the 2 hemispheres, and further classified according to their length ranges. Diffusion MRI dataset were also co-registered to the 2 anatomical T2-weighted scans using the ANTs toolbox8.
Inferior fronto-occipital fasciculus reconstruction - For each hemisphere, two ROIs were then manually segmented at the level of 2 distant coronal planes: a first ROI corresponding to the middle part of the frontal lobe and a second ROI corresponding to the anterior part of the occipital lobe. Fascicles passing through the two ROIs were then selected to identify the 2 target left and right IFOFs. The processing pipeline is summarized into Figure 1.
Results
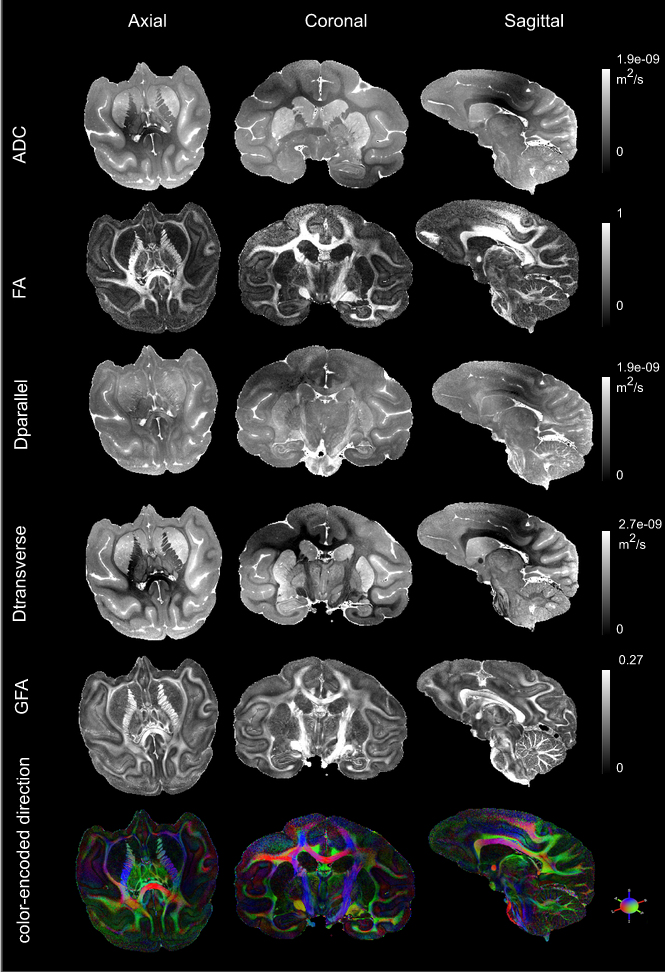
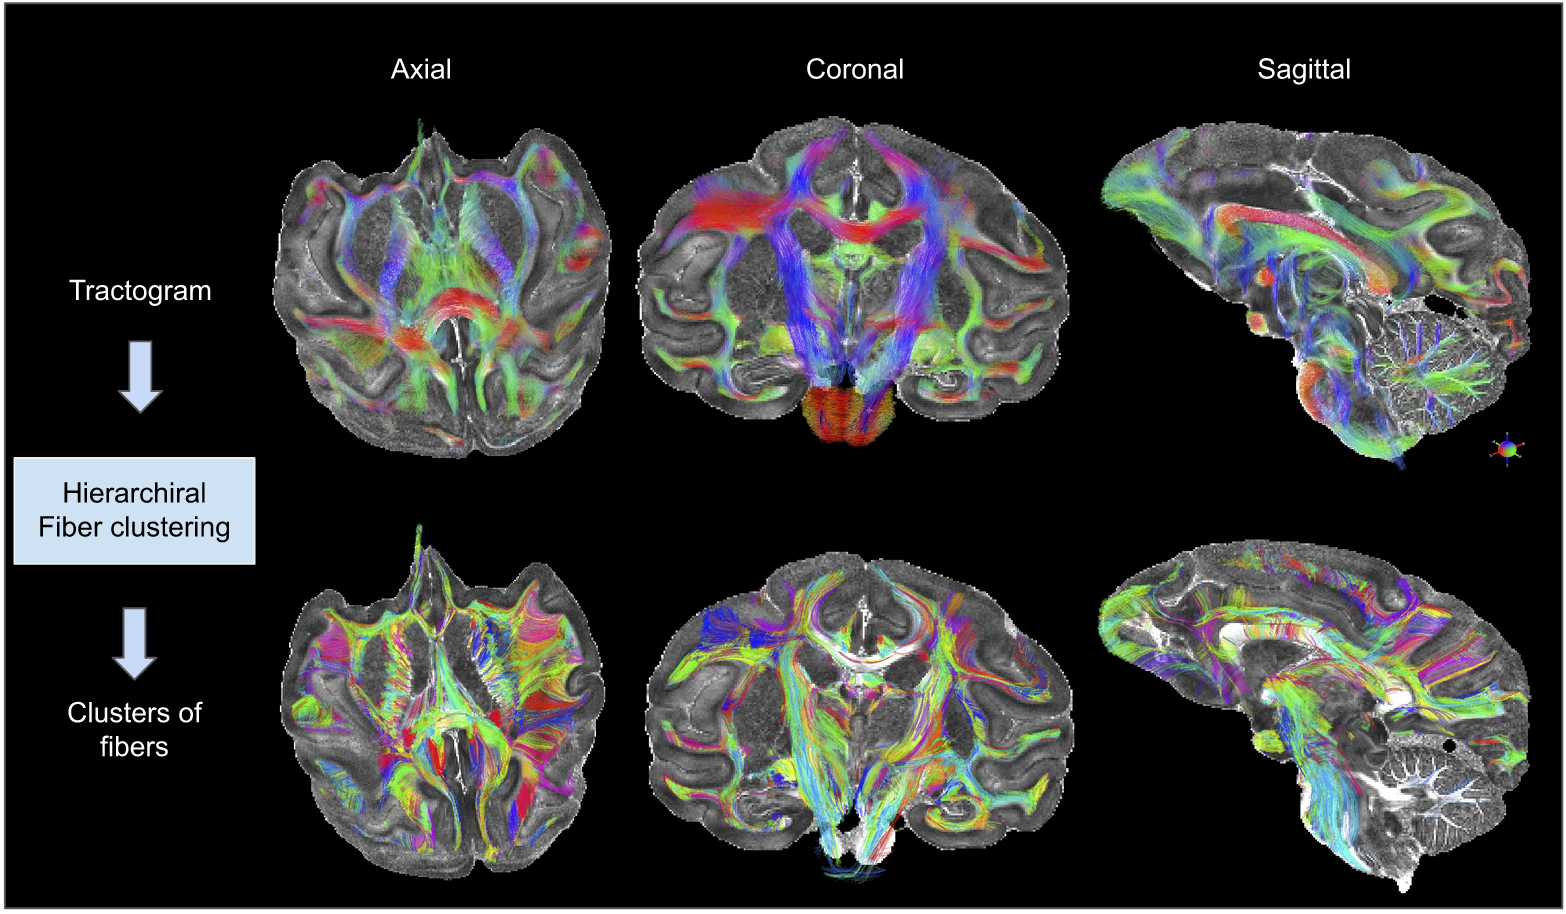
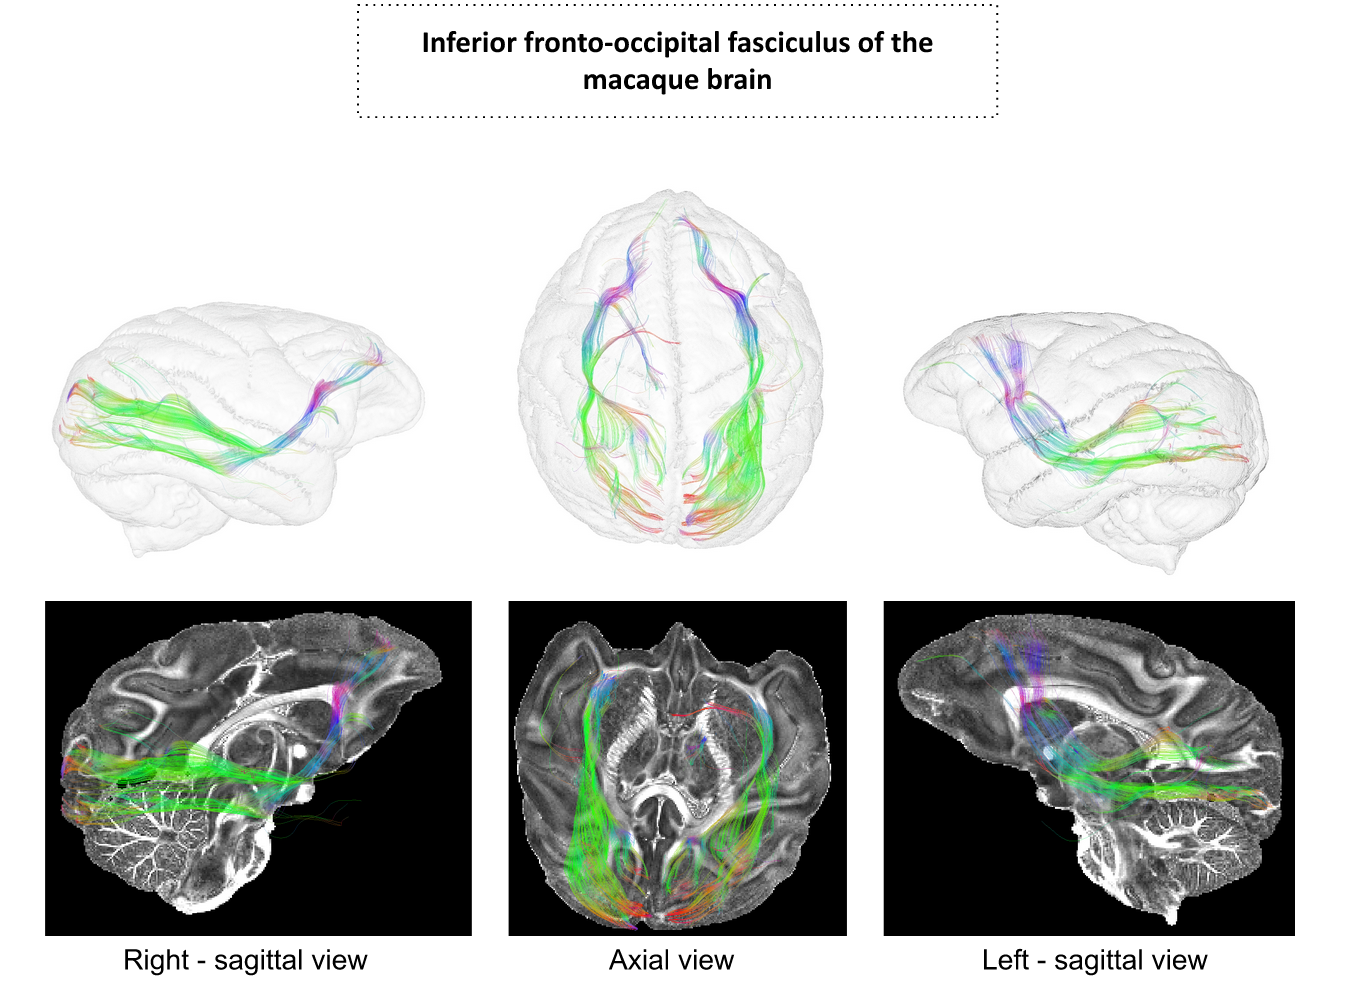
The figure 2 shows the reconstructed DTI and analytical Q-ball quantitative feature maps including ADC, FA, parallel and transverse diffusivity, color-encoded direction maps, assessing the high degree of quality of the scan reached at 11.7T. The figure 3 provides various planes showing the precision of the reconstructed connectogram, composed of 995982 fibers, yielding 14630 clusters for the left hemisphere and 14452 clusters for the right hemisphere, being slightly higher for the left hemisphere, after the application of the hierarchical fiber clustering method. After the selection of fibers uniquely passing through the two defined ROIs, the IFOFs were reconstructed. The two IFOFs start in the occipital cortex, pass through in the depth of the temporal lobe and end in the superior part of the frontal lobe. We can notice that the frontal connections remained thin in both hemispheres. The left IFOF was composed of 42 clusters including 454 fibers, and the right IFOF was composed of 110 clusters including 1050 fibers, making it significantly more developed than the left IFOF.Discussion
We were able to reconstruct the IFOF thanks to the combination of high resolution MRI diffusion / anatomical scans and a fiber clustering approach. These results contradict previous studies depicting that the IFOF is specific to humans9,10. The fibers’ pathway and crossing regions are closely similar to the ones of humans11. We observed particularly thin connections in the frontal lobe compared with Humans, which confirms studies on rhesus macaques12 implying that the frontal lobe could be associated with higher cognitive functions lacking in the macaque brain. Furthermore, it also confirms recent studies on the vervet monkey using fiber dissection13, evidencing the presence of IFOF in non-human primates, which leads to a better comprehension of the primate brain connectivity evolution.Acknowledgements
No acknowledgement found.References
1. Catani, M., & Thiebaut de Schotten, M. (2008). A diffusion tensor imaging tractography atlas for virtual in vivo dissections. Cortex; a journal devoted to the study of the nervous system and behavior, 44(8), 1105–1132. https://doi.org/10.1016/j.cortex.2008.05.004
2. Duffau, H., Herbet, G., & Moritz-Gasser, S. (2013). Toward a pluri-component, multimodal, and dynamic organization of the ventral semantic stream in humans: lessons from stimulation mapping in awake patients. Frontiers in systems neuroscience, 7, 44. https://doi.org/10.3389/fnsys.2013.00044
3. Bryant KL, Li L, Eichert N, Mars RB (2020) A comprehensive atlas of white matter tracts in the chimpanzee. PLoS Biol 18(12): e3000971. https://doi.org/10.1371/journal.pbio.3000971
4. Chauvel, M., Uszynski, I., Hopkins, W., Mangin, J.-F., Poupon, C. (2021), the international society for magnetic resonance (ISMRM) conference abstract.
5. Descoteaux, M., Angelino, E., Fitzgibbons,
S., & Deriche, R. (2007). Regularized, fast, and robust analytical
Q-ball imaging. Magnetic resonance in medicine, 58(3), 497–510. https://doi.org/10.1002/mrm.21277
6. Perrin, M., Poupon, C., Cointepas, Y., Rieul, B., Golestani, N., Pallier, C., Rivière, D., Constantinesco, A., Le Bihan, D., & Mangin, J. F. (2005). Fiber Tracking in q-Ball Fields Using Regularized Particle Trajectories. Information processing in medical imaging : proceedings of the ... conference, 19, 52–63. https://doi.org/10.1007/11505730_5
7. Guevara, P., Duclap, D., Poupon, C., Marrakchi-Kacem, L., Fillard, P., Le Bihan, D., Leboyer, M., Houenou, J., & Mangin, J. F. (2012). Automatic fiber bundle segmentation in massive tractography datasets using a multi-subject bundle atlas. NeuroImage, 61(4), 1083–1099. https://doi.org/10.1016/j.neuroimage.2012.02.071
8. Avants, B. B., Tustison, N. J., Song, G., Cook, P. A., Klein, A., & Gee, J. C. (2011). A reproducible evaluation of ANTs similarity metric performance in brain image registration. NeuroImage, 54(3), 2033–2044. https://doi.org/10.1016/j.neuroimage.2010.09.025
9. Yeterian, E. H., Pandya, D. N., Tomaiuolo, F., & Petrides, M. (2012). The cortical connectivity of the prefrontal cortex in the monkey brain. Cortex; a journal devoted to the study of the nervous system and behavior, 48(1), 58–81. https://doi.org/10.1016/j.cortex.2011.03.004
10. Forkel, S. J., Thiebaut de Schotten, M., Kawadler, J. M., Dell'Acqua, F., Danek, A., & Catani, M. (2014). The anatomy of fronto-occipital connections from early blunt dissections to contemporary tractography. Cortex; a journal devoted to the study of the nervous system and behavior, 56, 73–84. https://doi.org/10.1016/j.cortex.2012.09.005
11. Wu, Y., Sun, D., Wang, Y., & Wang, Y. (2016). Subcomponents and Connectivity of the Inferior Fronto-Occipital Fasciculus Revealed by Diffusion Spectrum Imaging Fiber Tracking. Frontiers in neuroanatomy, 10, 88. https://doi.org/10.3389/fnana.2016.00088
12. Barrett, R., Dawson, M., Dyrby, T. B., Krug, K., Ptito, M., D'Arceuil, H., Croxson, P. L., Johnson, P. J., Howells, H., Forkel, S. J., Dell'Acqua, F., & Catani, M. (2020). Differences in Frontal Network Anatomy Across Primate Species. The Journal of neuroscience : the official journal of the Society for Neuroscience, 40(10), 2094–2107. https://doi.org/10.1523/JNEUROSCI.1650-18.2019
13. Sarubbo, S., Petit, L., De Benedictis, A.,
Chioffi, F., Ptito, M., & Dyrby, T. B. (2019). Uncovering the
inferior fronto-occipital fascicle and its topological organization in
non-human primates: the missing connection for language evolution. Brain structure & function, 224(4), 1553–1567. https://doi.org/10.1007/s00429-019-01856-2
Figures