2101
Chronic anemia: the effects on the connectivity of white matter1Neuroscience Graduate Program, University of Southern California, Los Angeles, CA, United States, 2Signal and Image Processing Institute, University of Southern California, Los Angeles, CA, United States, 3Ming Hsieh Department of Electrical and Computer Engineering, Viterbi School of Engineering, University of Southern California, Los Angeles, CA, United States, 4Department of Pediatrics and Radiology, Children's Hospital Los Angeles, Los Angeles, CA, United States, 5Biomedical Engineering, University of Southern California, Los Angeles, CA, United States
Synopsis
Chronic anemia is commonly observed in patients with hemoglobinopathies, mainly represented by disorders in hemoglobin structure (e.g., sickle cell anemia, SCA) and hemoglobin synthesis (e.g., thalassemia syndrome). These hemoglobin disorders have been associated with white matter alterations. In this study, changes in white matter connectivity on chronic anemic patients were characterized by quantifying the volumetric mean of fractional anisotropy along the pathway of tracks connecting two ROIs (defined by BrainSuite’s BCI-DNI atlas) and comparing it with healthy individuals. SCA patients showed interhemispheric FA derangements but not to the same extent as changes observed in the watershed areas of non-SCA patients.
Introduction
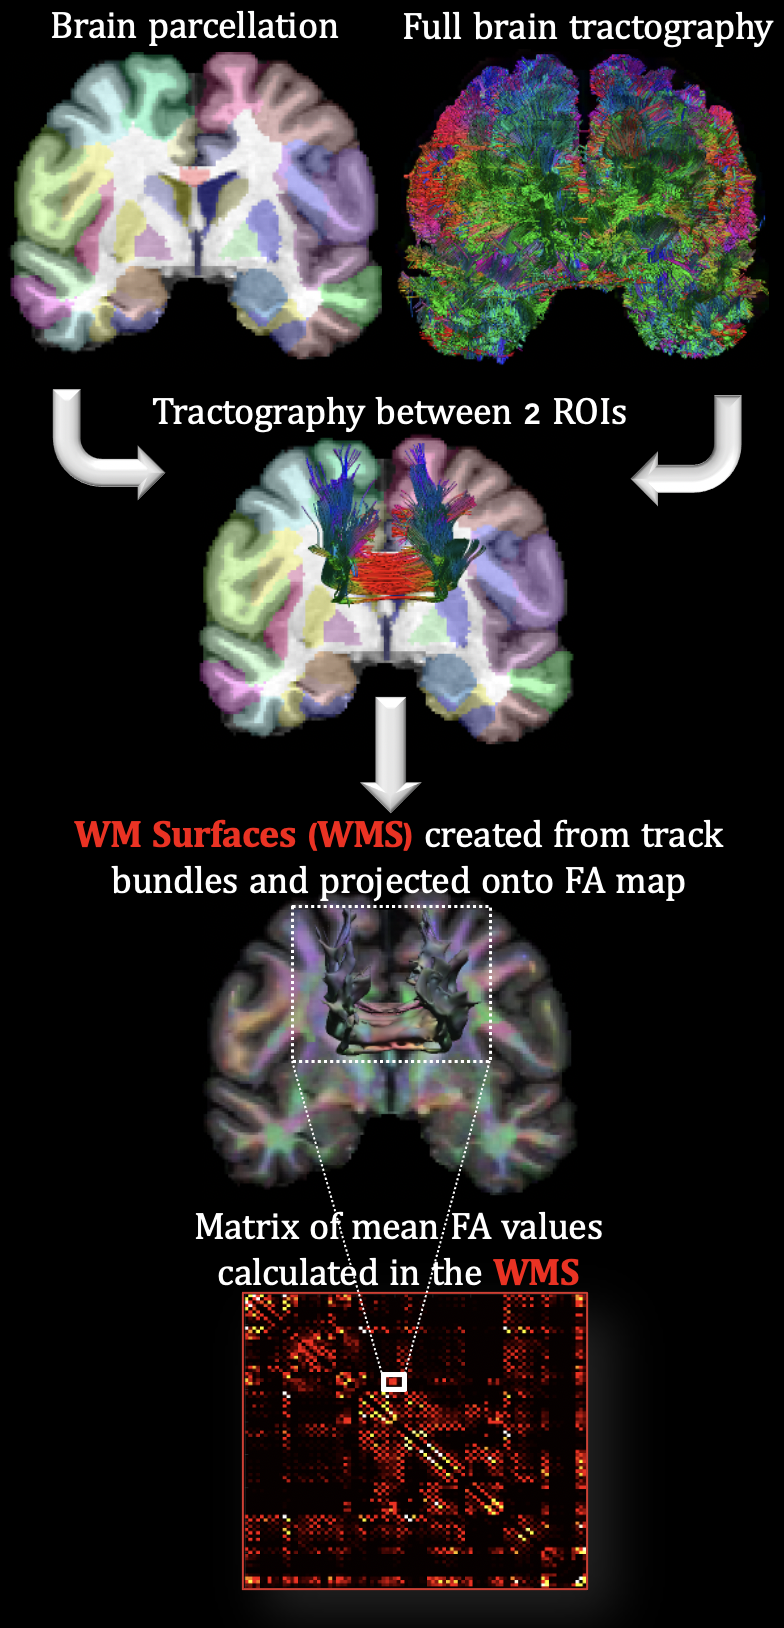
Chronic anemia (CA) is commonly observed in patients with hemoglobinopathies1, mainly represented by qualitative disorders in hemoglobin (Hb) structure (e.g., sickle cell anemia, SCA) and quantitative disorders of Hb synthesis (e.g., thalassemia syndromes, non-SCA)2. Both hemoglobinopathies have been associated with white matter (WM) alterations3,4. Novel structural MRI research in our laboratory demonstrated that WM volume was diffusely lower in deep, watershed areas proportionally to anemia severity5. Furthermore, diffusion MRI (dMRI) analysis has provided evidence that WM microstructure is disrupted proportionally to Hb level and oxygen saturation6,7. In this study, SCA and non-SCA patients (with a wide range of Hb values) were compared, allowing the characterization of the effects of CA in isolation of sickle Hb. To quantify changes in WM connectivity, the fractional anisotropy (FA, i.e., overall directionality of water diffusion) volumetric mean was calculated along the pathway of tracks connecting two ROIs, defined by BrainSuite’s BCI-DNI atlas (http://brainsuite.org), Fig. 1. Particularly, the EAP Response Function Optimized (ERFO) was used to model the orientation distribution functions (ODFs) because it has shown advantages over the tensor model (capable of rendering crossing fibers with single shell data) and other ODF methods8.Methods
Participants: 19 clinically asymptomatic SCA patients (age = 22.4±7.8; Hb = 10.1±2.1, F = 9), 15 non-SCA patients (age = 22.4±4.8; Hb = 10±2.8; F = 8) and 23 control (CTL) subjects (age = 21.3±6; Hb = 13.3±1.2; F = 14).Neuroimaging data: MRI data were acquired on a 3T Philips Achieva using an 8-channel head coil. 3D T1-weighted (T1-w) images with TR/TE = 8.3/3.8 ms and isotropic voxel size (VS) of 1 mm3. Single-shell dMRI with TR/TE = 4.8/2.5 ms; VS=2.5 mm3; 30 diffusion-encoding directions at b-value = 1000 s/mm2 and one b-value=0 s/mm2.
Diffusion modeling: T1-w cortical surface delineation, registration, and parcellation to the BCI-DNI anatomical atlas was done using BrainSuite. dMRI data were subsequently coregistered to the T1-w images. Lastly, whole-brain tractography was calculated using ERFO ODF’s. For each individual, tracks connecting each pair of ROIs were used to define a new volumetric WM surface (WMS) projected to the FA map to calculate the mean value. 88 ROIs from the BCI-DNI atlas were used to form a connectivity-like matrix, with the mean volumetric FA values, Fig.1.
Statistical analysis: FA differences between groups were modeled for each element of the connectivity matrix with multiple linear regression analysis after controlling for age (log-transformed), sex, group, and false discovery rate (FDR). A similar analysis was performed using FDR-corrected permutation model.
Results
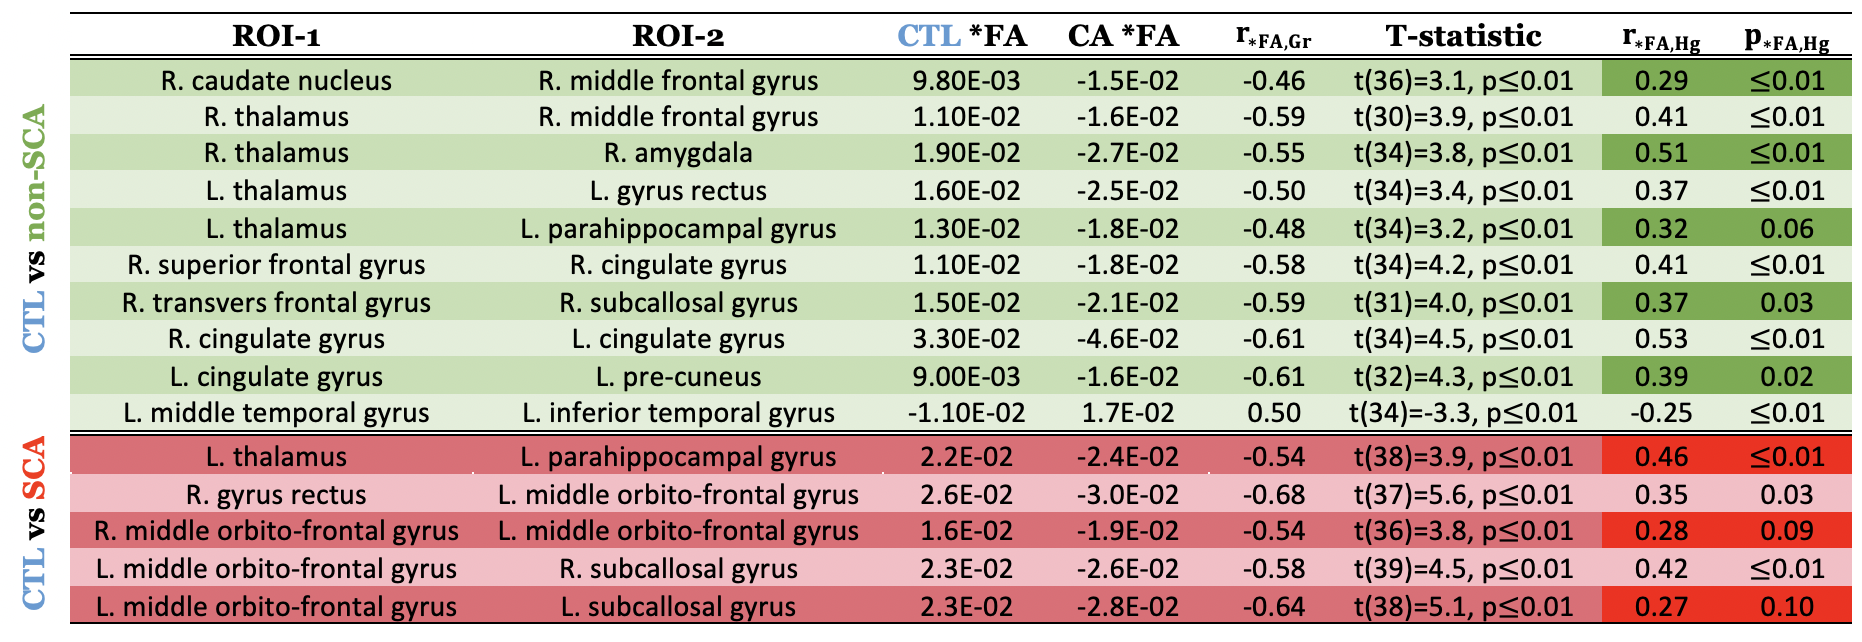
Table 1 shows the WMSs (connectivity between ROI-1 and ROI-2) for SCA and non-SCA patients compared with CTL that were statistically significant after 20% FDR correction in both models: multiple linear regression and permutation analysis. *FA represents the mean of FA residuals from the linear regression controlled by the logarithm of age and sex. The point-biserial correlation coefficient $$$r_{*FA,Gr}$$$ between groups and *FA is also displayed along with the unpaired two-samples t-test statistic. Additionally, $$$r_{*FA,Hb}$$$ represents the Pearson correlation between *FA and Hb, and the respective p-value is also shown. No statistically significant WMSs were found when comparing SCA with non-SCA patients.The results displayed in Table 1 predominantly show lower *FA values on CA patients indicating the loss of coherence in the main diffusion direction and WM injury. Furthermore, a positive correlation of *FA with Hb along the WMSs suggests that decreased *FA is highly driven by chronic hypoxia. Interestingly, more WMSs survived for the non-SCA (mainly intrahemispheric and along watershed areas) than the SCA (mainly interhemispheric) group than healthy controls.Discussion
Lower FA along WMS in non-SCA patients compared with healthy controls followed an intuitive pattern, located primarily in the frontal-parietal watershed areas and deep WMS. Most of the affected connections were unilateral except for the tract connecting the right-left cingulate gyrus, which captures the cingulum bundle which runs through the corpus callosum (CC). For SCA patients and controls, three out of five connections cross to the contralateral side. Interhemispheric involvement is consistent with previous results in our laboratory showing lower FA6 and WM volume6,9, in the CC on CA patients (higher burden on SCA). Furthermore, many significant WMSs were in the prefrontal cortex, where WM shrinkage has been associated with a neurocognitive decline in CA patients5. This study was limited by the sample size, a single diffusion shell, and tensor modeling resulting in not resolving sex disease-specific differences.Conclusion
To characterize the effects of CA in WM alterations, mean FA along the WMSs of SCA and non-SCA patients were compared, allowing the isolation of sickle Hb. Surprisingly, SCA patients did not show systematic FA derangements in the watershed areas to the same extent as observed in the non-SCA patients. This most likely reflects the variable disease expression in our SCA cohort and uncontrolled confounders of mesostructural integrity such as chronic pain. However, finding interhemispheric WMSs affected in SCA aligns with previous results showing decreased FA in the CC on CA patients.Acknowledgements
This work was supported by National Heart, Lung, and Blood Institute (grant 1U01-HL-117718-01, 1R01-HL136484-01A1), and the National Center for Research (5UL1-TR000130-05) through the Clinical Translational Science Institute at Children’s Hospital Los Angeles. Philips Healthcare provided support for protocol development and applications engineering on a support-in-kind basis.References
[1] M. Angastiniotis, A. Eleftheriou and R. Galanello, "Epidemiology of hemoglobinopathies," in Chapter 2: prevention of thalassaemias and other hemoglobin disorders: Volume 1: Principles, Nicosia (Cyprus), Thalassaemia International Federation, 2013.
[2] A. Wahed, A. Dasgupta, A. Wahed and A. Dasgupta, "Chapter 4: Hemoglobinopathies and thalassemias," in Hematology and coagulation, San Diego, Elsevier, 2015, pp. 55-80.
[3] B. Sun, R. C. Brown, L. Hayes, T. G. Burns, J. Huamani, D. J. Bearden and R. A. Jones, "White matter damage in asymptomatic patients with sickle cell anemia: screening with diffusion tensor imaging," Am. J. Neuroradiol., vol. 33, no. 11, pp. 2043-2049, 2012.
[4]S. Choi, R. M. Leahy and J. C. Wood, "Lower white matter volume in beta-thalassemia associated with anemia and cognitive performance," American Journal of Hematology, vol. 95, no. 6, pp. 144-146, 2020.
[5] S. Choi, S. H. O'Neil, A. A. Joshi, J. Li, M. A. Bush, T. D. Coates, R. M. Leahy and J. C. Wood, "Anemia predicts lower white matter volume and cognitive performance in sickle and non-sickle cell anemia syndrome," American Journal of Hematology, vol. 94, no. 10, pp. 1055-1065, 2019.
[6] Y. Chai, C. Ji, J. Coloigner, S. Choi, M. Balderrama, C. Vu, B. Tamrazi, T. Coates, J. C. Wood, S. H. O'Neil and N. T. Lepore, "Tract-specific analysis and neurocognitive functioning in sickle cell patients without history of overt stroke.," Brain Behav., vol. 11, no. 3, 2021.
[7] Kawadler, J. M, F. J. Kirkham, J. D. Clayden, Hollocks, M. J, Seymour, E. L, R. Edey, P. Telfer, A. Robins, O. Wilkey, S. Barker, T. C. S. Cox and C. A. Clark, "White matter damage relates to oxygen saturation in children with sickle cell anemia without silent cerebral infarcts," Stroke, vol. 46, no. 7, pp. 1793-1799, 2015.
[8] D. Varadarajan and J. P. Haldar, "A theoretical signal processing framework for linear diffusion MRI: implications for parameter estimation and experiment design," NeuroImage, vol. 161, p. 206–218, 2017.
[9] S. Choi, A. M. Bush, M. T. Borzage, A. A. Joshi, W. J. Mack, T. D. Coates, R. M. Leahy and J. C. Wood, "Hemoglobin and mean platelet volume predicts diffuse T1-MRI white matter volume decrease in sickle cell disease patients," Neuroimage Clinical, vol. 15, pp. 239-246, 2017.
Figures