2100
Age-associated White Matter Microstructure and Connectome Abnormalities in Autism Spectrum Disorder1Radiology and Biomedical Imaging, Yale School of Medicine, New Haven, CT, United States, 2University of California, San Francisco, San Francisco, CA, United States, 3Pediatrics, Neurology, Cellular and Molecular Physiology, Yale School of Medicine, New Haven, CT, United States
Synopsis
Analyzing four study cohorts spanning from infancy to adulthood, we compared DTI-derived diffusion metrics as well as connectome Edge Density between subjects with Autism Spectrum Disorders (ASD) and neurotypical controls. Additionally, we explored the performance of several machine learning algorithms applied to tract-based values for prediction of ASD. We found age- and ASD-related alterations in white matter microstructure and connectome in both voxel-wise and tract-based analyses that show how ASD-associated abnormalities emerge and change over time. Our machine learning analysis evaluated several different approaches and identified a model that achieved 0.75 AUC in the prediction of an ASD diagnosis.
Introduction
There is increasing evidence of white matter microstructural alterations in DTI-derived metrics among individuals with Autism Spectrum Disorder (ASD). However, previous studies were limited in study cohort size and composition which could mask age- and sex-related effects. We aimed to draw conclusive deductions about age-related white matter (WM) microstructural changes in ASD by considering a large dataset that contains multiple age cohorts. We analyzed conventional DTI-derived metrics as well as Edge Density maps constructed using probabilistic tractography and evaluated the applicability of machine learning in this context. Our approach considers multi-modal data that better reflects the underlying neurobiology and could ultimately help find reliable biomarkers to improve diagnosis and treatment monitoring.Methods
We included all studies from the National Database of Autism Research that have both T1 weighted and DTI images. These four studies comprise four age cohorts: (i) A Longitudinal MRI Study of Infants at Risk of Autism(1) (infants), n=155, age 7 (6-7)m, 34 ASD/121 controls, 65.8% male; (ii) Biomarkers of Autism at 12 Months(2) (toddlers), n=102, age 32 (25-36)m, 57 ASD/45 controls, 73.5% male: (iii) Multimodal Developmental Neurogenetics of Females with Autism(3) (adolescents), n=230, age 158 (123-186)m, 106 ASD/124 controls, 50.9% male; (iv) Atypical Late Neurodevelopment in Autism(4) (young adults), n=96, age 229.5 (188-316.5)m, 67 ASD/29 controls, 99% male. Age: median (interquartile) in months. DTI was preprocessed using FSL. We used the FSL Diffusion Tensor Fitting program to retrieve Mean (MD), Radial (RD) and Axial Diffusivity (AD) as well as Fractional Anisotropy (FA) maps. We identified 48 cortical and 7 subcortical nodes specified in the Harvard-Oxford atlas and coregistered them to native FA space to guide probabilistic tractography and retrieve Edge Density (ED) maps(5,6). After applying FSL TBSS, we analyzed FA, MD, RD, AD and ED maps using voxel-wise general linear models (GLM) to assess the influence of age, gender and ASD diagnosis. Considering the 48 WM tracts specified in the JHU white matter labels atlas, we retrieved mean values within each tract for each modality. Voxel-wise comparisons were validated in a multiple regression analysis of tract-based values. Additionally, we fed mean tract-based values into a machine learning pipeline. All data were split into a n=400 training set and a n=183 test dataset. We applied combinations of six different classifiers and six different feature selection algorithms in different feature subsets to identify the best performing model. In the training dataset, we built a framework of 20 rounds of 5-fold cross validation and used Bayesian Optimization to tune hyperparameters. Performance was assessed using the mean Area under the Receiver Operator Characteristics Curve (AUC) across 100 validation folds. The model with highest mean AUC was then applied to the independent test dataset.Results
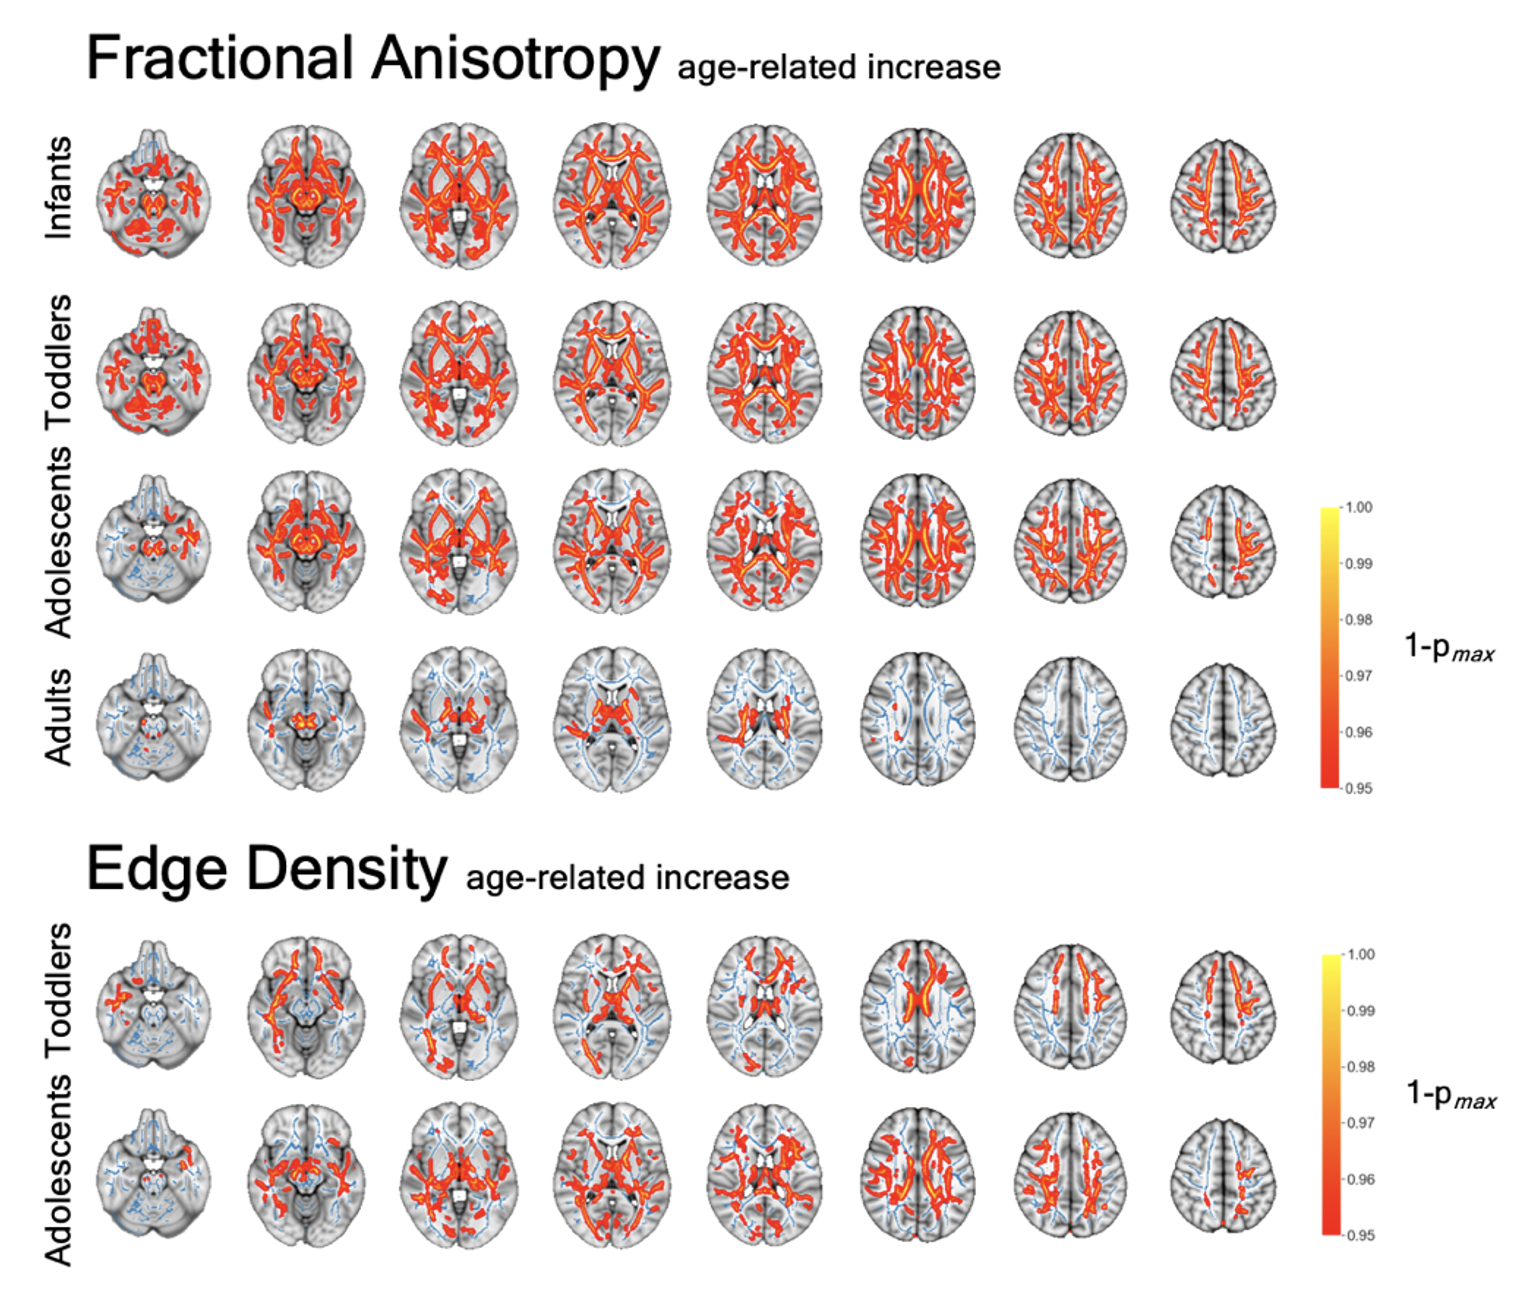
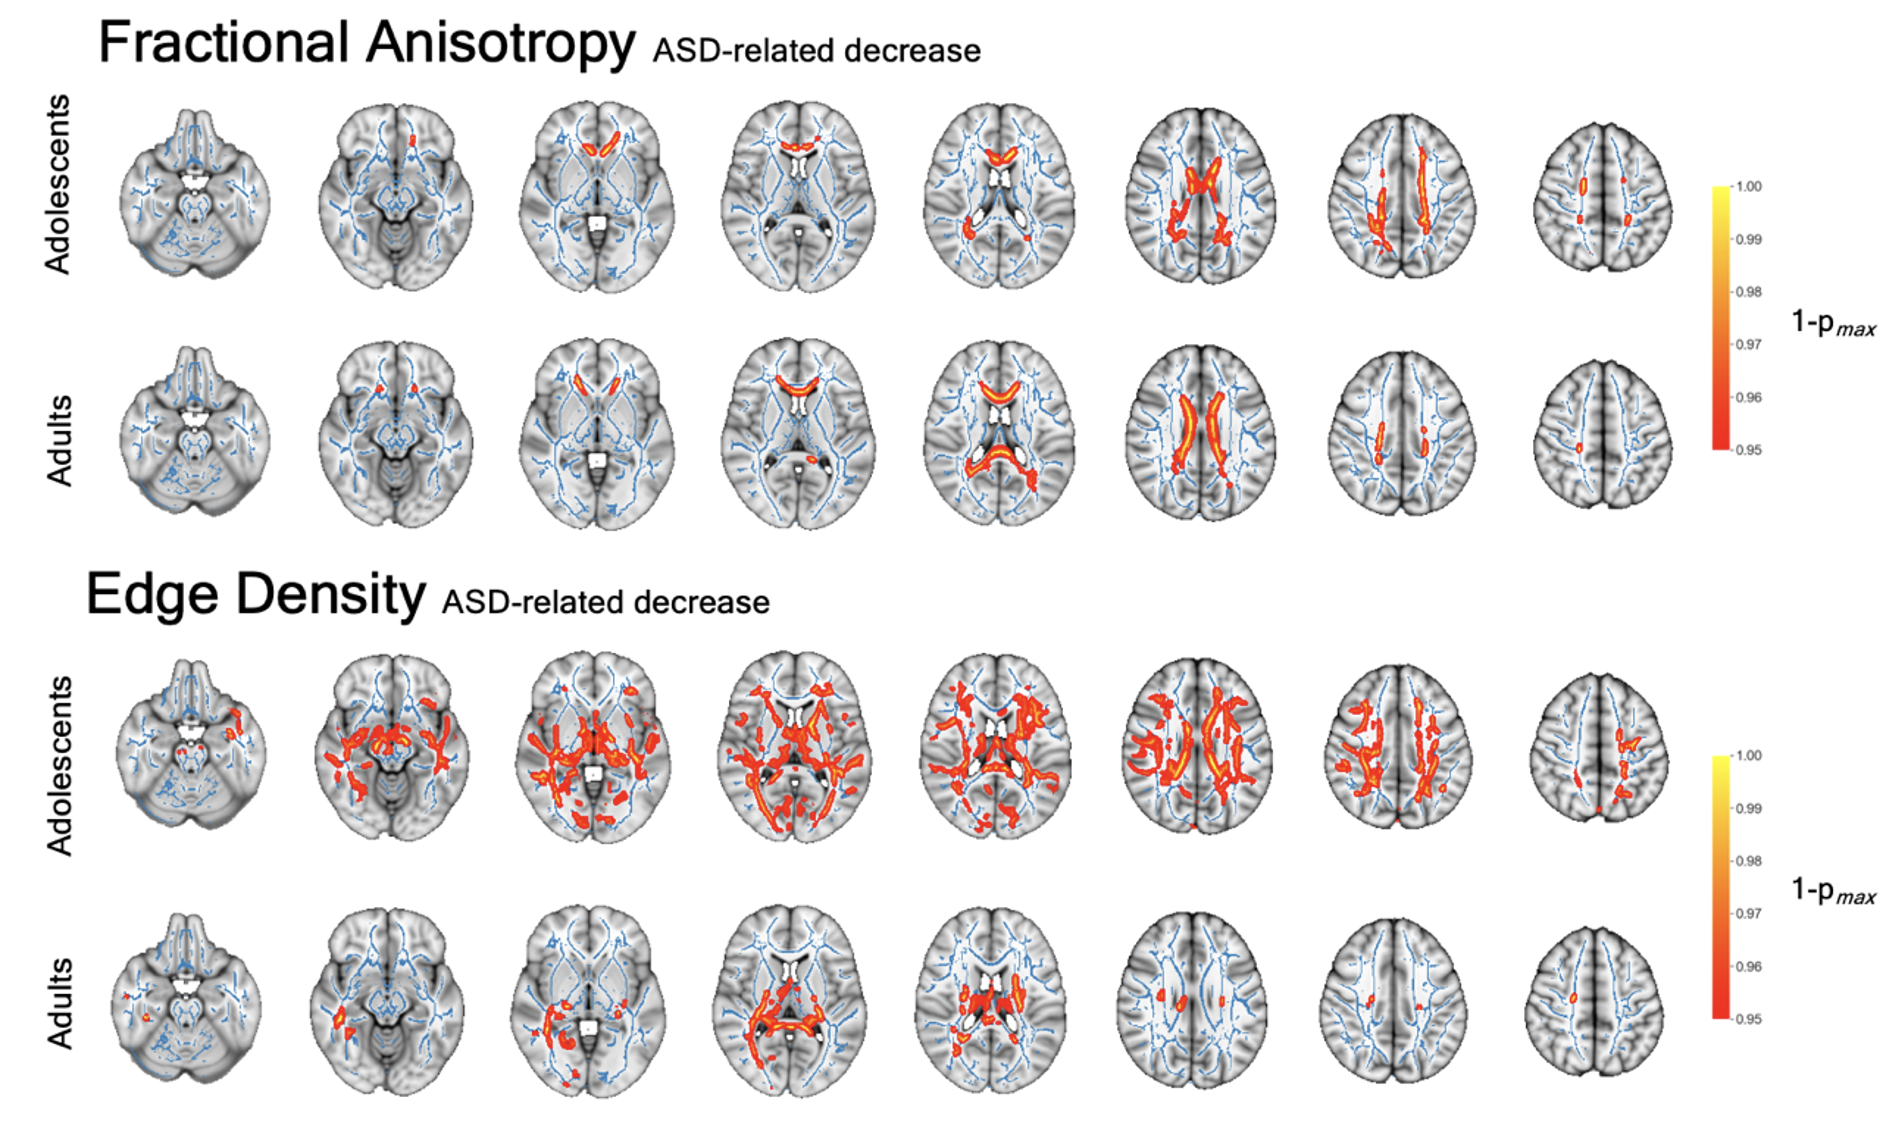
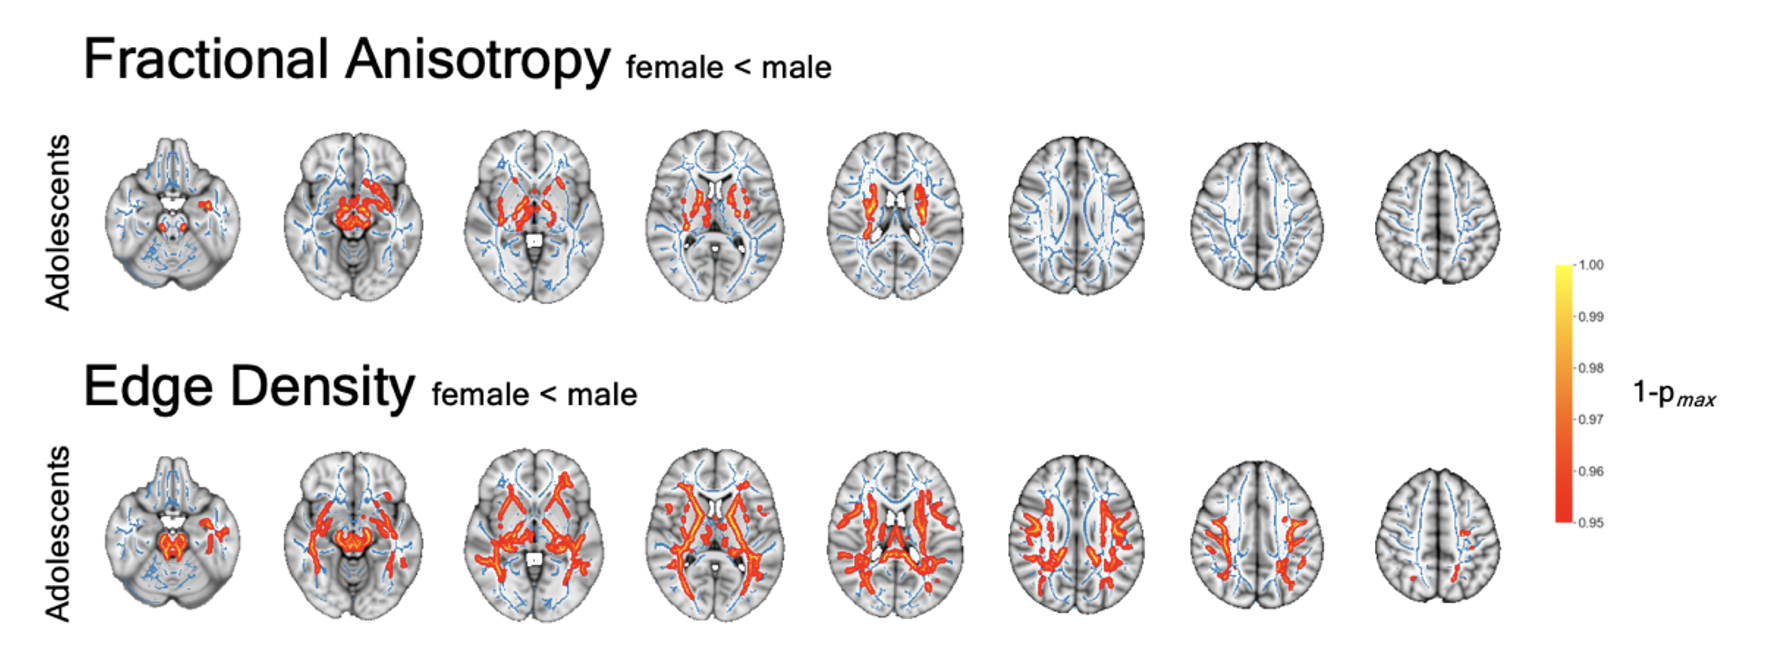
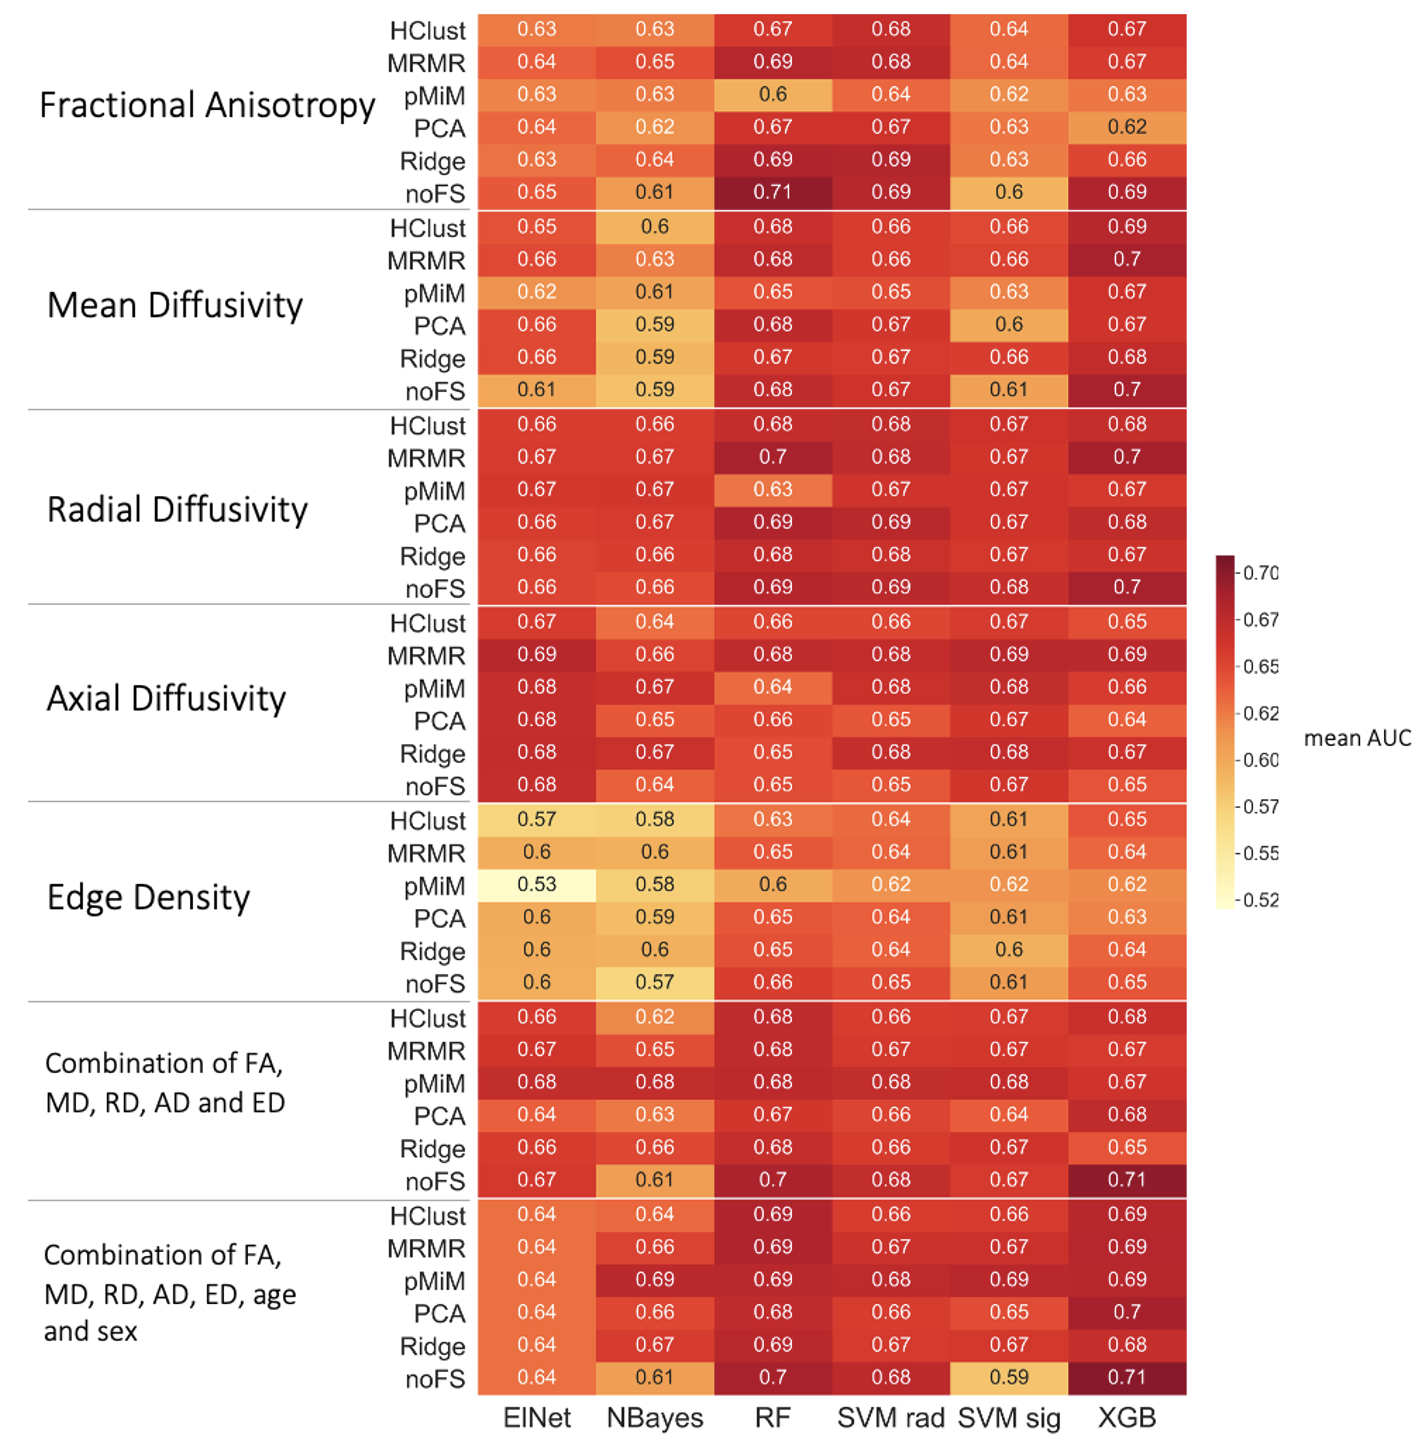
In the voxel-wise analysis, we identified significant FA increases with age in all four study cohorts (Figure 1). Corresponding age-related decline was found in other diffusivity metrics. Edge Density increased with age in toddlers and adolescents, but not in infants or adults. We identified ASD-related alterations in the adolescent and adult cohort. FA was reduced in the anterior and central corpus callosum of adolescents and became more pronounced and spread to posterior callosal tracts in adults. We found ASD-related ED reduction ubiquitously in adolescents and in several periventricular tracts in adults (Figure 2). There were no significant changes detectable in younger cohorts. Additionally, we found sex-related alterations in the adolescent cohorts. FA and ED were reduced in females as compared to males after controlling for the influence of age and ASD diagnosis (Figure 3). We could not detect this effect in younger cohorts and were unable to validate this finding in the adult cohort as only one female adult was included.Our machine learning analysis showed that classifiers performed with AUC between 0.52 and 0.71 in a cross validation analysis. A heatmap of mean AUC values in cross validation is provided in Figure 4. We identified Extreme Gradient Boosting without feature selection as the best performing model with mean AUC of 0.71 in cross validation and achieved an AUC of 0.75 in independent validation – totally held out sample test set (n=183) (Figure 5).Discussion
We could detect age-related increase in FA and ED and decreases in MD and RD among most WM tracts. Our findings align with the literature on age-related DTI alterations that reflect white matter maturation and increasing myelination(7,8). ASD status was associated with WM microstructure dysintegrity in adolescent and adults, which was not detectable in infants and toddlers. Changes were located primarily in the corpus callosum. EDI showed an association between the microstructural connectome and an ASD diagnosis. We found sex-related effects that aligns with the literature(9). This underlines the importance of including female study subjects to better understand sex-specific etiologies and phenotypic differences. We also showed the potential applicability of machine learning classifiers in ASD diagnosis prediction based on DTI-derived inputs.Conclusion
We found age-related changes in all four study cohorts and ASD-related changes in adolescents and young adults. Additionally, we found sex-related effects in adolescents. We could add evidence to age- and ASD related microstructural changes and create a framework for future applications of machine learning in DTI-based ASD evaluation.Acknowledgements
No acknowledgement found.References
1 NIH Reporter: A Longitudinal MRI Study of Infants at Risk for Autism, <https://reporter.nih.gov/project-details/8386423>
2 NIH Reporter: Biomarkers of Autism at 12 months: From Brain Overgrowth to Genes, <https://reporter.nih.gov/project-details/7277408>
3 NIH Reporter: Multimodal Developmental Neurogenetics of Females with ASD, <https://reporter.nih.gov/project-details/9296949>
4 NIH Reporter: Atypical Late Neurodevelopment in Autism: A Longitudinal MRI and DTI Study, <https://reporter.nih.gov/project-details/7297715>
5 Owen, J. P., Chang, Y. S. & Mukherjee, P. Edge density imaging: mapping the anatomic embedding of the structural connectome within the white matter of the human brain. Neuroimage 109, 402-417, doi:10.1016/j.neuroimage.2015.01.007 (2015).
6 Payabvash, S. et al. White Matter Connectome Edge Density in Children with Autism Spectrum Disorders: Potential Imaging Biomarkers Using Machine-Learning Models. 9, doi:10.1089/brain.2018.0658 (2019).
7 Alexander, A. L. et al. Diffusion tensor imaging of the corpus callosum in Autism. 34, 61-73, doi:10.1016/j.neuroimage.2006.08.032 (2007).
8 Barnea-Goraly, N. et al. White matter development during childhood and adolescence: A cross-sectional diffusion tensor imaging study. 15, 1848-1854, doi:10.1093/cercor/bhi062 (2005).
9 Walsh, M. J. M., Wallace, G. L., Gallegos, S. M. & Braden, B. B. Brain-based sex differences in autism spectrum disorder across the lifespan: A systematic review of structural MRI, fMRI, and DTI findings. Neuroimage Clin 31, 102719, doi:10.1016/j.nicl.2021.102719 (2021).
Figures