2099
Increases in Quantitative T2 Values in Spinal Cord of Chiari Patients with Syrinx1Georgia Institute of Technology, Atlanta, GA, United States, 2Emory University, Atlanta, GA, United States
Synopsis
Here we use quantitative T2 mapping of the spinal cord in Chiari malformation patients to evaluate the ability to discriminate between spinal cord tissue in Chiari patients with syrinx and spinal cord tissue without. Spinal cord tissue adjacent to syrinx lesions show significantly elevated T2 values suggesting potential utility of T2 mapping for clinical management of Chiari patients.
Introduction
Chiari malformation is a congenital condition that results in a structural defect at the base of the skull, leading to displacement of brain tissue into the spinal canal1. Chiari patients are at risk of developing a syrinx, or a cerebral spinal fluid (CSF) filled lesion in the spinal cord2. These lesions can grow and may be treated with decompression surgery if they prove to hinder the patient's quality of life. However, clinical decision making for when to perform surgery currently lacks tools that are able to prognosticate lesion progression. T2-weighted images, while sufficient for identifying lesions with T2-bright signal, provide limited value in determining risk of lesion formation or progression1. The purpose of this study was to assess whether quantitative T2 mapping of the spinal cord could discern differences between spinal cord tissue of Chiari patients with lesions and that of Chiari patients without lesions.Methods
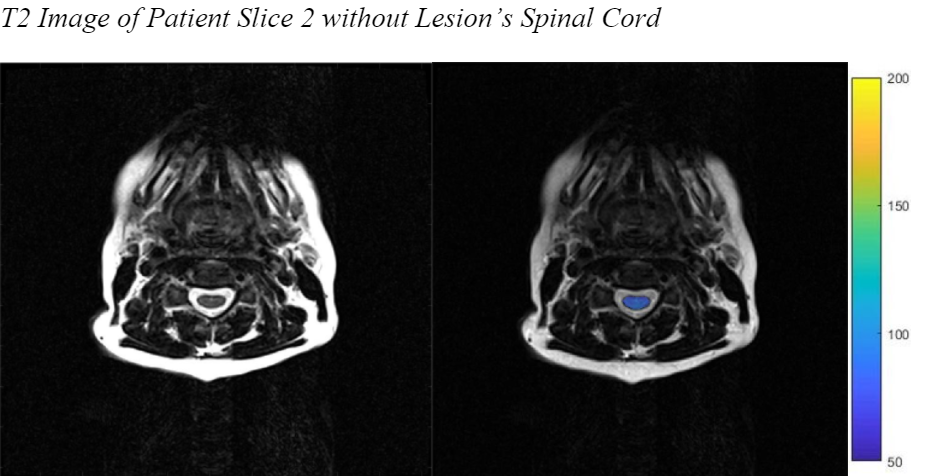
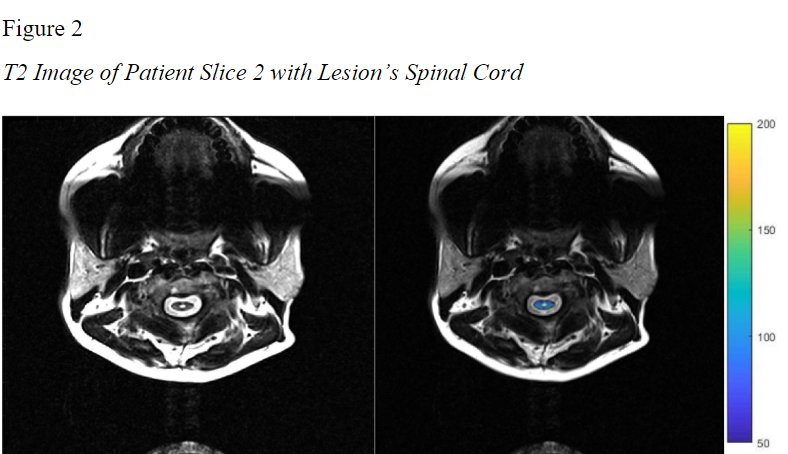
MRI data from twenty-seven Chiari MRI studies were analyzed. The subjects included 7 with and 20 without syrinx lesions. MRI was performed using a 3 Tesla MRI (MAGNETOM Prisma Fit, Siemens Healthcare, Erlangen, Germany) with combined use of a 20-channel head coil and spine coil. An axial multi-slice multi-echo spin echo was acquired from seven slices positioned within each level of the cervical spine. Sequence parameters included TR/TE=2080/10ms, echo train length=28, in-plane resolution 0.43×0.43, and pixel bandwidth 245Hz. Images were processed off-line using in-house MATLAB scripts. T2 maps were computed by fitting 28 echo images to a monoexponential decay expression. Region of interest analysis was used to segment spinal cord from CSF, for quantitation of spinal cord T2 values. If a syrinx lesion was present, all image pixels containing a T2 value of over 175ms were removed to eliminate the T2 values of the syrinx from the analysis. This served as a conservative threshold to eliminate CSF partial volume and potentially bias T2 comparisons of non-lesion spinal cord. A value of 175ms was used as the threshold for removal because typical gray and white matter values were significantly lower during the analysis1. Values for T2 (mean, median, standard deviation, max, and min) were computed for each slice in each patient for subsequent analysis. One-way ANOVA testing was run for each slice comparing those with and without lesions. Both mean and median values were analyzed. Each slice was isolated in the analysis to prevent compounding of rising T2 values as the slice level was more caudal.Results and Discussion
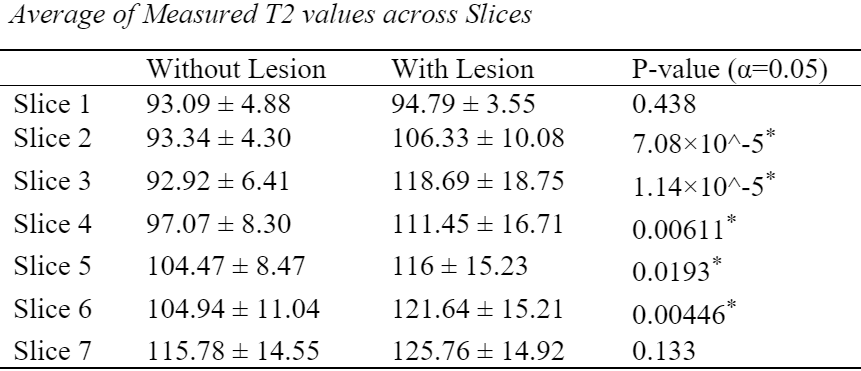
Presence of lesions varied by level in these patients with some patients exhibiting syrinx that extended over part of the cervical spine. Table 1 shows mean T2 values by slice (ascending from cranial to caudal). Slice 1 consisted of 21 patients without lesion and 6 patients with lesion. The remaining slices consisted of 20 patients without lesions and 7 patients with lesions. When comparing within level (slice), average non-lesion spinal cord T2 values were significantly elevated compared with spinal cord T2 values without lesions in slices 2-6. Similar findings were observed when comparing median T2 values in slices 2, 3, 4, and 6. Ongoing work will examine T2 distributions within the spinal cord to identify marker that would predict lesion progression. These preliminary findings suggest potential utility in using T2 mapping in the clinical management of Chiari patients with and without lesion for early indication of syrinx development.Acknowledgements
No acknowledgements found.References
1. Bender, B., & Klose, U. (2009). Cerebrospinal fluid and interstitial fluid volume measurements in the human brain at 3T with EPI. Magnetic Resonance in Medicine, 61.
2. U.S. Department of Health and Human Services. (n.d.). Syringomyelia fact sheet. National Institute of Neurological Disorders and Stroke. Retrieved November 11, 2021, from https://www.ninds.nih.gov/Disorders/Patient-Caregiver-Education/Fact-Sheets/Syringomyelia-Fact-Sheet.
Figures