2095
Brainstem 7T 1H-MRS: comparison between single-channel (1Tx32Rx) and parallel transmit (8Tx32Rx) coils1Wolfson Brain Imaging Centre, University of Cambridge, Cambridge, United Kingdom, 2Invicro LLC, A Konica Minolta Company, London, United Kingdom
Synopsis
7T MRS offers increased SNR and peak separation. Many Siemens 7T sites have both 1Tx32Rx and 8Tx32Rx head coils. Workflow is similar when using the TrueForm/CP+ mode. We compared MP2RAGE and semiLASER 1H-MRS in brainstem in healthy volunteers to identify a preferred coil for future studies.
Results: voxelplacement, linewidth, and concentrations were not significantly different. SNRNAA increased 27% and CRLBs for Gln, GABA & GSH trended to be lower for the 8Tx coil.
This encourages regular use of the 8Tx32Rx coil for brainstem 1H-MRS and facilitates method development by allowing full pTx sequences to be added on to scheduled examinations.
Introduction
7T MRS gives higher SNR and better spectral separation compared to clinical field strengths. This allows detection of low-concentration metabolites such as Glu & Gln. Peak B1+ transmit can limit echo times at 7T or for MRSI over larger volumes of interest B1+-inhomogeneity can become limiting1. Parallel transmit (pTx) offers potential solutions to these problems. But in practice, pTx scans require a different transmit coil and a different mode of operation on our 7T Terra (Siemens) MRI scanner.To help the wider testing of pTx methods in our site, we need to understand whether we obtain equivalent data from our two head coils: a 1Tx32Rx coil (Nova) and an 8Tx32Rx coil run in circularly polarised (CP+)/TrueForm mode (Nova). Hence, in this work, we aimed to assess the equivalence of single voxel spectroscopy measurements in brainstem using both coils. We compared the resulting neurometabolite profiles and markers of spectral quality (i.e. linewidth and signal-to-noise ratio).
Methods
Six healthy volunteers were scanned twice on a 7T Terra MRI (Siemens). Data was acquired using a 1Tx32Rx head coil (Nova) and in a separate scan using an 8Tx32Rx head coil (Nova) on the pTX system running in TrueForm/CP+ mode. Scans for individual subjects were conducted back-to-back and in a randomised order.The 1hr MR Protocol for each coil included B0 and B1 mapping sequences, an anatomical MP2RAGE2, quantitative MR imaging (described in detail elsewhere) and 1H-MRS. Scans on the pTx system were conducted in TrueForm mode to harmonize acquisition between the coils, mimicking the 1Tx acquisition on the 8Tx32Rx coil in practice. We acquired 1H-MRS with a semi-LASER sequence in the ponto-medullary junction as previously described3.
Post-processing: Semi-LASER data was pre-processed in MRSpa (version 1.5g)4 before fitting in LCModel5 (v6.3-1R) with water scaling for concentration referencing. The volumetric fraction of cerebrospinal fluid (fCSF) was determined on the MP2RAGE with FSL-MRS and FSL’s FAST6-8. Final metabolite concentrations are reported in institutional units (I.U.), calculated as:
$$[met](I.U.)=\frac{[met]_{LCModel}}{(1-f_{CSF})}\cdot 1000 $$
Data was only unblinded after completion of the statistical analysis as to which coil was used. CRLBs are used as a marker for fit accuracy.
Statistical Analysis:
The non-parametric Wilcoxon rank-sum test was used to assess differences in metabolite concentration as well as spectral quality metrics between the coils (Python 3.9)9–13. The coefficient of variation for metabolite concentrations between the two coils was calculated as
$$CoV_{met} = (1+\frac{1}{4n})\cdot \frac{\sigma}{\mu}$$
to account for the small sample size14.
Results
Spectral Quality:Representative voxel placements and spectra acquired with either coil are shown in Figure 1. The MP2RAGE acquired with the 8Tx32Rx Coil offered better coverage of the medulla and extended into the upper cervical cord, aiding in the precise placement of the voxel likely due to differences in transmit efficiency (Figure 2). Table 1 shows that the 8Tx Coil has superior SNR with a median increase of 27% (p=0.031), while the linewidths were comparable (+5.7%, p=0.89).
Metabolite Concentrations and Fitting Uncertainty:
The concentrations of NAA, tCr, tCho, Ins, Glu, Gln, GABA, GSH, sIns and NAAG for each scan are shown in Figure 3 and were not significantly different between the 1Tx and 8Tx Coil with p>0.15 for all metabolites that were investigated (Table 2) as expected. Furthermore, the median CoVs for metabolites were below 10% for the majority, while Gln, GABA, GSH and sIns had higher CoVs, since these metabolites typically have higher %CRLBs and therefore lower fit accuracy as shown by a trend towards lower CRLBs for Gln, GABA & GSH (p<0.10).
Discussion
We investigated the equivalence of short TE, long TR brainstem semi-LASER spectroscopy using two similar coils that differ in their transmit structure (1Tx vs 8Tx). We matched our MR protocol to our previous two-site study investigating post-acute metabolic changes of patients recovering from COVID-193,15 to help with interpretation.The better coverage of the lower brain, medulla and upper cervical cord as evident on the MP2RAGE anatomical image in the 8Tx32Rx Coil allowed a precise voxel placement and permitted the acquisition of 1H-MRS spectra in the brainstem with a median SNR increase of 27%. Higher SNR in 1H-MRS acquisition is of interest, since it aids the accuracy of estimating metabolite concentrations which are lower concentrated e.g. GABA16 or may permit the acquisition of functional MRS17.
The minor differences in metabolite concentrations may originate from slight imprecisions in voxel placement. Since the participants had to be repositioned in the scanner for each scan, the neck extension was not identical each time. Thus, voxel placement accuracy should be included in future models investigating the equivalency of these coils.
Comparison with previous reproducibility studies
Metabolite CoVs between the two coils were lower than in a recent study using a similar 1H-MRS protocol with a larger VOI albeit fewer individual spectra18. This suggests that the minor differences in concentrations between the two coils are consistent with scan-rescan inaccuracies that are commonly encountered, but may be reduced slightly by the higher SNR observed for the 8Tx32Rx for brainstem 7T 1H-MRS.
Conclusion
Overall, the 8Tx32Rx head coil gave comparable metabolite concentrations and improved quality metrics for brainstem 7T 1H-MRS. This supports wider use of the 8Tx32Rx coil for brainstem or other structures inferior to the cerebrum.Acknowledgements
We thank the volunteers their participation. The Wolfson Brain Imaging Centre is supported by the NIHR Cambridge Biomedical Research Centre and an MRC Clinical Research Infrastructure Award for 7T research. CG is supported by a Cambridge European Scholarship awarded by the Cambridge Trust and the W.D. Armstrong Studentship in Engineering and Medicine. CTR is funded by the Wellcome Trust and the Royal Society [098436/Z/12/B].
References
- Maudsley, A. A. et al. Advanced magnetic resonance spectroscopic neuroimaging: Experts’ consensus recommendations. (2020).
- Clarke, W. T. et al. Multi-site harmonization of 7 tesla MRI neuroimaging protocols. Neuroimage 206, 116335 (2020).
- Graf, C. et al. Two-site 7T 1H-MRS study in brainstem of “long COVID” patients. in Proc. Intl. Soc. Mag. Reson. Med. 29 1730 (International Society for Magnetic Resonance in Medicine, 2021).
- Deelchand, D. K. MRspa – Magnetic Resonance spectral processing and analysis. (University of Minnesota, 2020).
- Provencher, S. W. Estimation of metabolite concentrations from localized in vivo proton NMR spectra. Magn. Reson. Med. 30, 672–679 (1993).
- Clarke, W. T., Stagg, C. J. & Jbabdi, S. FSL-MRS: An end-to-end spectroscopy analysis package. Magn. Reson. Med. 17.11.2020, 2020.06.16.155291 (2020).
- Zhang, Y., Brady, M. & Smith, S. Segmentation of brain MR images through a hidden Markov random field model and the expectation-maximization algorithm. IEEE Trans. Med. Imaging 20, 45–57 (2001).
- Smith, S. M. Fast robust automated brain extraction. Hum. Brain Mapp. 17, 143–155 (2002).
- Hunter, J. D. Matplotlib: A 2D Graphics Environment. Computing in Science Engineering 9, 90–95 (2007).
- McKinney, W. Data Structures for Statistical Computing in Python. in Proceedings of the 9th Python in Science Conference (SciPy, 2010). doi:10.25080/majora-92bf1922-00a.
- Virtanen, P. et al. SciPy 1.0: fundamental algorithms for scientific computing in Python. Nat. Methods 17, 261–272 (2020).
- Waskom, M. seaborn: statistical data visualization. J. Open Source Softw. 6, 3021 (2021).
- Wilcoxon, F. Individual Comparisons by Ranking Methods. Biometrics Bulletin 1, 80–83 (1945).
- Sokal, R. R. & Rohlf, F. J. The Coefficient of Variation. in Biometry: the principles and practice of statistics in biological research 57–59 (W.H. Freeman and Company, 1995).
- Rua, C. et al. Characterization of brain susceptibility changes in post-hospitalisation COVID-19 patients at 7 Tesla. in Proc. Intl. Soc. Mag. Reson. Med. 29 {0218} (International Society for Magnetic Resonance in Medicine, 2021).
- Marjańska, M., Deelchand, D. K., Kreis, R. & 2016 ISMRM MRS Study Group Fitting Challenge Team. Results and interpretation of a fitting challenge for MR spectroscopy set up by the MRS study group of ISMRM. Magn. Reson. Med. (2021) doi:10.1002/mrm.28942.
- Jelen, L. A., King, S., Mullins, P. G. & Stone, J. M. Beyond static measures: A review of functional magnetic resonance spectroscopy and its potential to investigate dynamic glutamatergic abnormalities in schizophrenia. J. Psychopharmacol. 32, 497–508 (2018).
- van de Bank, B. L. et al. Multi-center reproducibility of neurochemical profiles in the human brain at 7 T. NMR Biomed. 28, 306–316 (2015).
Figures
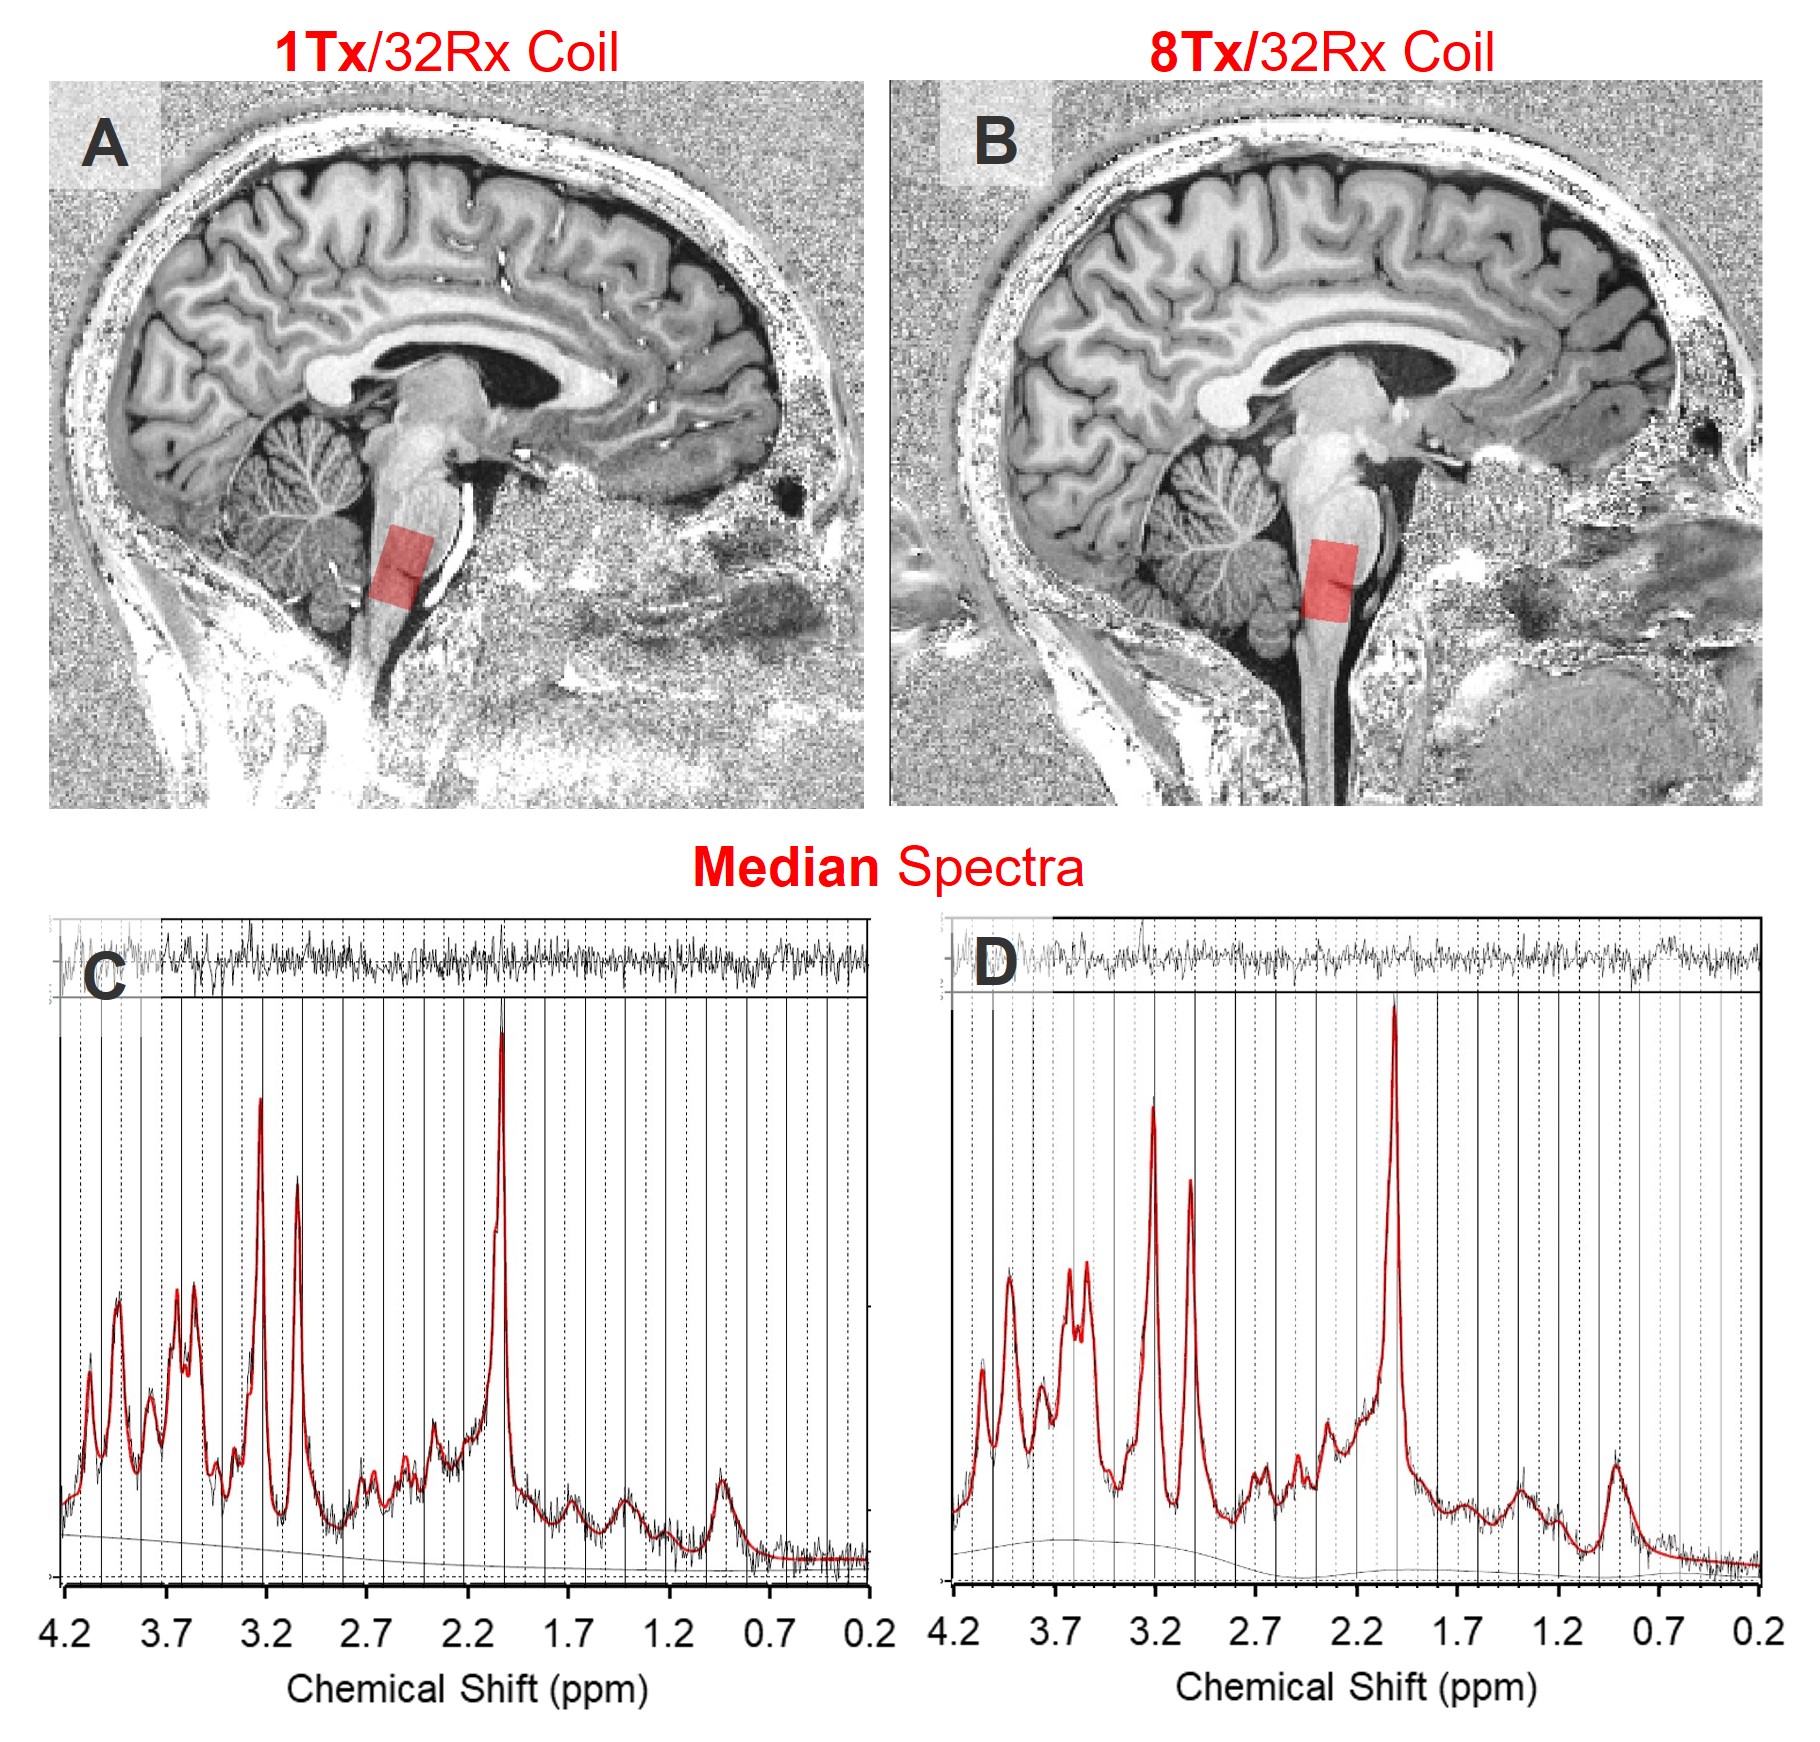
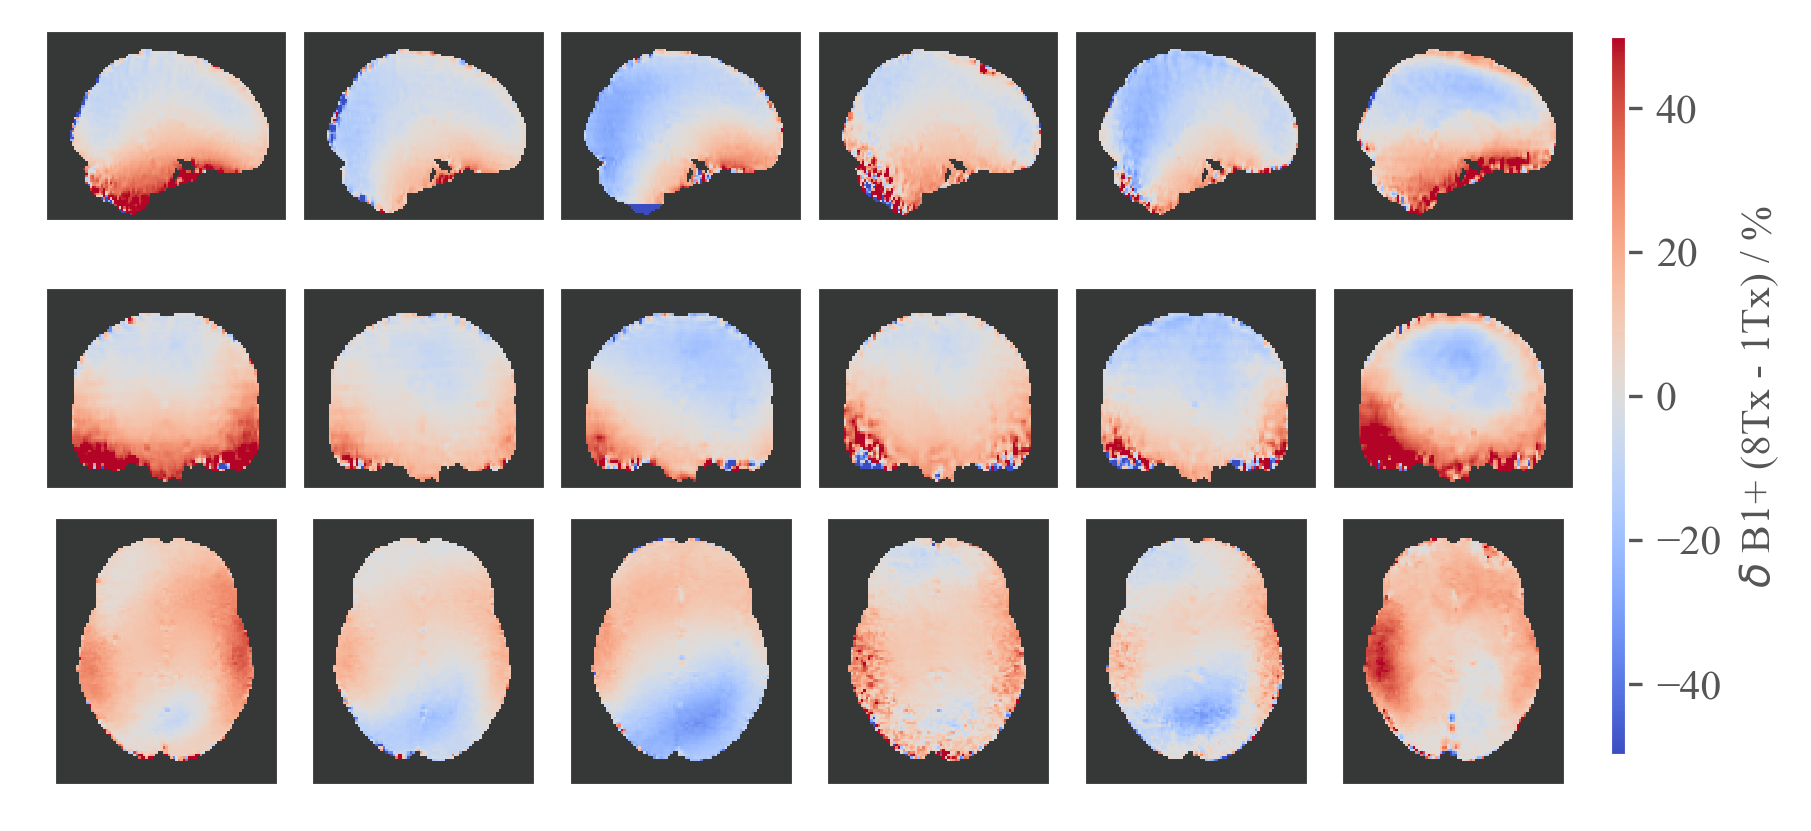
Figure 2: Difference Flip Angle Maps for the two coils. The 1Tx32Rx Coil has lower FA in the brainstem (blue shade) than the 8Tx32Rx Coil (red shade).
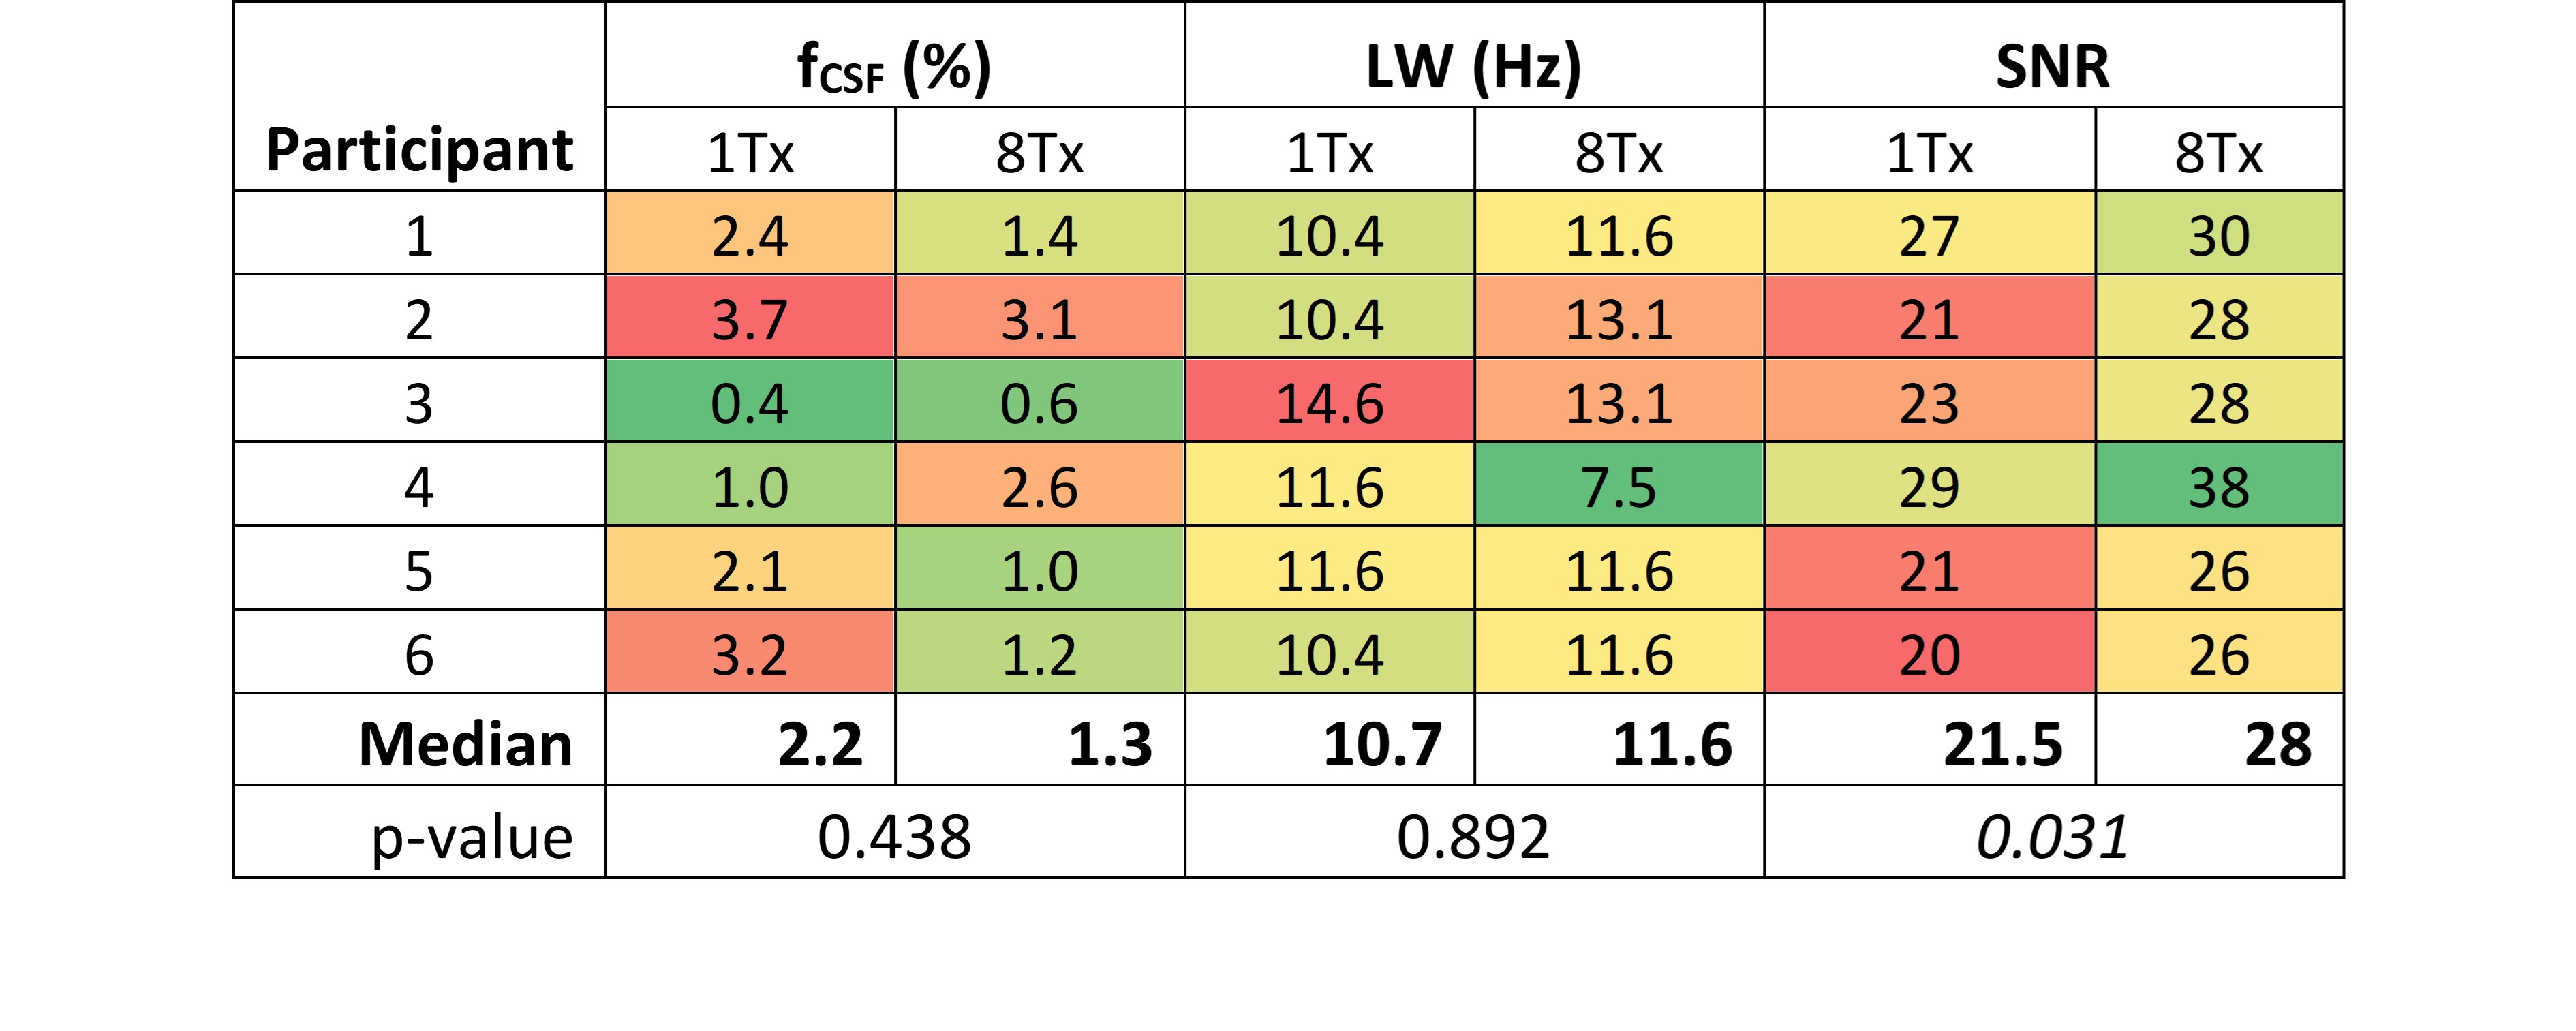
Table 1: Spectral quality metrics for all six participants. CSF volume fraction (fCSF) as determined with FSL, metabolite linewidth (LW) and NAA’s signal-to-noise ratio (SNR) as determined by LCModel fitting. Note the significantly higher SNR for the 8Tx32Rx Coil (+27%, p=0.031) in comparison to the 1Tx32Rx Coil. Both LW and fCSF were similar between the two set-ups.
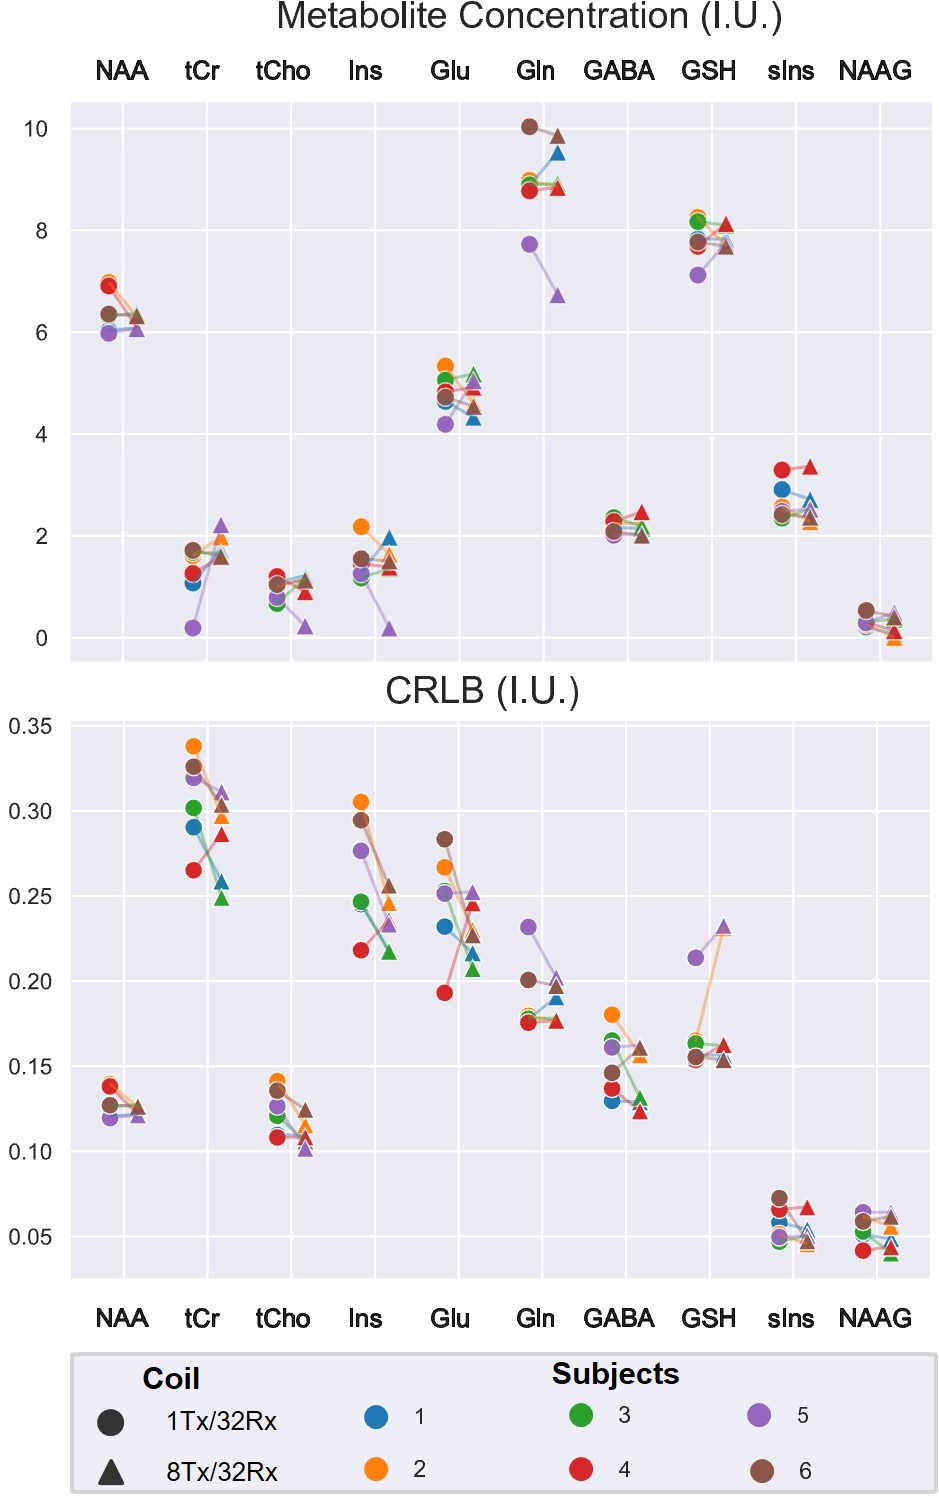
Figure 3: Metabolite concentrations and CRLB for each participant and scan. There was no significant difference for any of the metabolite concentrations or CRLB investigated (p > 0.05), however for some metabolites which are typically more difficult to measure i.e. Gln, GABA & GSH there was a trend (p < 0.1) to improved fitting uncertainty with the 8Tx32Rx coil (see also Table 2).
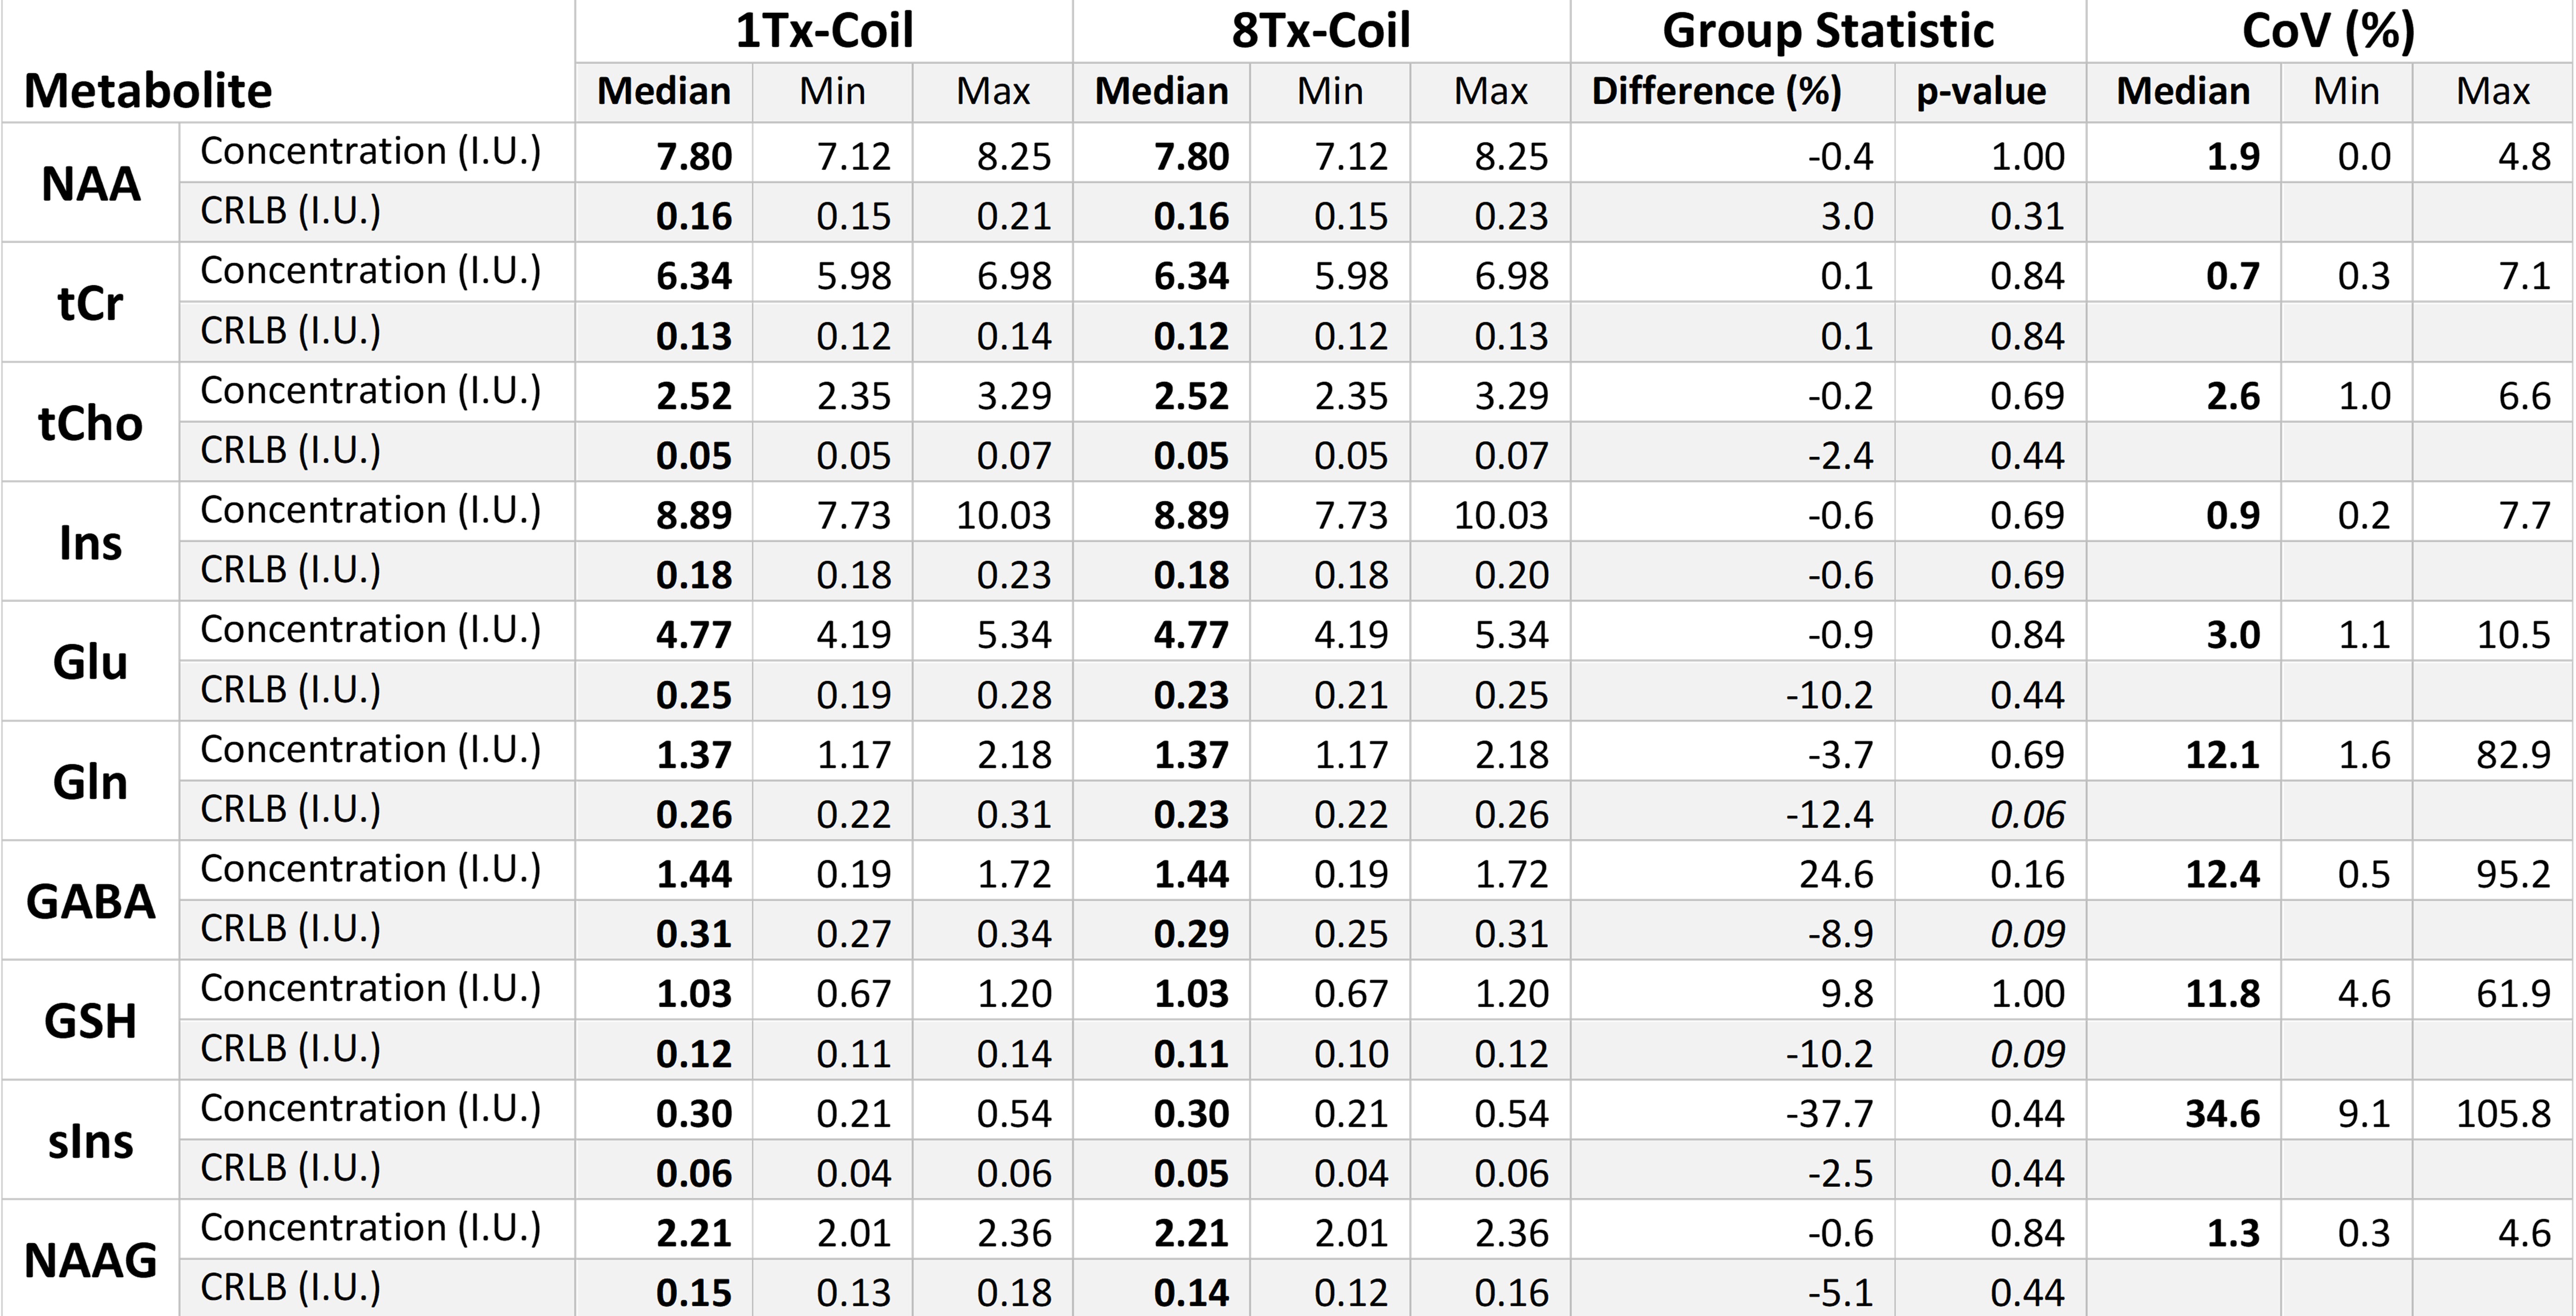
Table 2: Reproducibility statistics for metabolites. p-values were obtained with the Wilcoxon rank-sum test. Metrics with a slight trend (p < 0.1) are highlighted in italics. Difference (%) is defined as the median of the pairwise differences for each participant and metabolite (8Tx – 1Tx). Coefficients of variation (CoV) were comparable with previously published reproducibility studies at 7T.