2094
Comparison of Nova 1Tx vs 8Tx head coils for routine 7T neuroimaging
Belinda Ding1, Catarina Rua1,2, and Christopher T Rodgers1
1Wolfson Brain Imaging Centre, University of Cambridge, Cambridge, United Kingdom, 2Invicro LLC, A Konica Minolta Company, London, United Kingdom
1Wolfson Brain Imaging Centre, University of Cambridge, Cambridge, United Kingdom, 2Invicro LLC, A Konica Minolta Company, London, United Kingdom
Synopsis
Most 7T MRI sites have two head coils available for neuroimaging: a single-transmit coil and one capable of parallel transmission (pTx, or 8Tx). The 8Tx coil has a circularly polarised (CP) mode, allowing it to play RF waveforms identical to its 1Tx counterpart. This study compares the performance of a 1Tx coil against an 8Tx coil from the same manufacturer for routine neuroimaging. The 8Tx coil gave better B1+ profiles in posterior brain regions which translates into improvements in other imaging sequences. It also enables the inclusion of pTx-enabled sequences. However, more detailed studies are needed before pooling data.
Introduction
Most 7T MRI sites have two head coils available for neuroimaging: a 1Tx head-coil for the single transmission (1Tx) system and an 8Tx head-coil for the parallel transmission (8Tx) system. In the circularly polarised (CP) mode (also known as TrueForm) the 8Tx coil should be identical to its 1Tx counterpart. However, no study has assessed this. Thus, we want to compare the performance of both systems for some commonly used sequences1 to determine any potential impact of switching routine 7T neuroimaging from 1Tx to 8Tx system in CP mode.Methods
Six volunteers (2 female; age = 31.3±4.5 years; BMI=21.3±1.2 kg/m2) were scanned on a MAGNETOM Terra 7T MRI (Siemens Healthineers). Two scans were performed per participant: one on the 1Tx system with the 1Tx32Rx head coil (Nova Medical, USA) and another on the 8Tx system in CP mode with the 8Tx32Rx head coil (Nova Medical, USA). The CP mode’s per-channel complex weightings should give similar B1+ to the birdcage 1Tx coil. Thus, both coils should give similar B1+ spatio-temporal waveforms.Scans were performed on the same day with a 15-minute break to allow switching between the systems. The time taken for the switch (inclusive of coil change) was also recorded.
Data acquisition: Six imaging sequences were acquired: dual-echo GRE for B0-mapping, turbo-FLASH for B1+-mapping, MP2RAGE, multi-echo GRE, GRE-EPI (5 subjects), and DTI with SE-EPI (3 subjects). The transmit voltage was determined automatically by the scanner. B0-shimming was performed using the scanner’s auto-calibration routine and manual tuning of shim currents to minimise measured linewidths. All imaging scans had the same shim volume. Figure 1 shows the scanning parameters used.
Data analysis: Data analysis was conducted using FSL (v6.0.3, FMRIB, UK)2 unless otherwise specified, and the workflow is shown in Figure 1. All ROI analyses were done in the native imaging space. A paired two-tailed Student’s t-test was used for statistical testing.
Results
On average, switching from 1Tx to 8Tx took 6:30 min and switching from 8Tx to 1Tx took 5:58 min.Histograms of whole-brain B0 and B1+ values are presented in Figure 2. There were no significant differences in the mean and standard deviations (std) of B0. There is a split peak in the 8Tx B0-histogram for subject 2 due to a possible operator’s error when performing manual shimming. We saw significantly higher mean-B1+ values with the 8Tx system in the caudate, insula, putamen, and temporal lobes. This improvement did not come with a penalty on the homogeneity: the 8Tx system showed significantly lower std-B1+ in six out of nine ROIs.
Both coils showed similar MP2RAGE image quality in the cerebrum, with no significant differences in grey, white matter, and ventricular volumes (Figure 3). However, differences were seen in the brainstem and cervical spine. The spinal cord was only defined in 50% of the subjects with the 1Tx system, while clear boundaries between the spinal cord and spinal canal were seen in all volunteers with the 8Tx system. Figures 4A, B and C show the EPI tSNR maps with the mean and std-tSNR measurements. There were no significant changes in tSNR in any ROIs. Considering homogeneity in tSNR, the 8Tx system showed significantly higher std-tSNR in four basal-ganglia ROIs but significantly lower std-tSNR in the occipital-lobe ROIs. In terms of R2*, the largest differences were observed in vessels and edges of the cortex (Figure 4D and E), but no significant differences in the mean and std-R2* values were detected.
DTI images are shown in Figure 5. The b=0s/mm2 images show a reduction of dropouts in the temporal lobes and cerebellum using the 8Tx system. The increased signal in those areas translates into more defined fitted white matter tracts.
Discussion
The two coils are often considered to be approximately equivalent (in CP mode). However, it is clear that the 8Tx coil actually provides better B1+ efficiency in posterior brain regions. This translates into improved image quality for MP2RAGE and DTI without compromising other imaging sequences.Switching to 8Tx mode and back took on average 12:28 min in total. With careful scheduling, it is feasible to run routine research protocols on the 8Tx system. Running protocols on the 8Tx system also opens up the possibility of including B1-shimmed/parallel transmission (pTx) protocols as add-on scans.
Although scanning on the 8Tx host does show some advantages, there are issues to consider before fully migrating protocols onto it. For example, changes in DTI signal intensity in the temporal lobes might affect a study if data acquired from the two different coils must be pooled. A future intra-coil and inter-coil reproducibility study will be needed to understand whether data can be pooled from both coils.
Conclusion
Overall, both systems give comparable image quality for routine neuroimaging (MP2RAGE structural, GRE-EPI, ME-GRE and DTI). The 8Tx coil gives more B1+ in the posterior brain regions which could benefit studies targeting those areas. It also allows pTx-enabled sequences to be run as an “add-on” to standard clinical protocols. Thus, we believe other sites could usefully investigate migrating their routine neuroimaging protocols to the 8Tx coil.Acknowledgements
BD is funded by Gates Cambridge. CTR is funded by the Wellcome Trust and Royal Society (098436/Z/12/B). This research was supported by the NIHR Cambridge Biomedical Research Centre (BRC-1215-20014). The views expressed are those of the author(s) and not necessarily those of the NIHR or the Department of Health and Social Care.References
- Clarke, W. T. et al. Multi-site harmonization of 7 tesla MRI neuroimaging protocols. NeuroImage 206, 116335 (2020).
- Jenkinson, M., Beckmann, C. F., Behrens, T. E. J., Woolrich, M. W. & Smith, S. M. Review FSL. Neuroimage 62, 782–790 (2012).
- Pei, M. et al. Algorithm for fast monoexponential fitting based on Auto-Regression on Linear Operations (ARLO) of data. Magnetic Resonance in Medicine 73, 843–850 (2015).
Figures
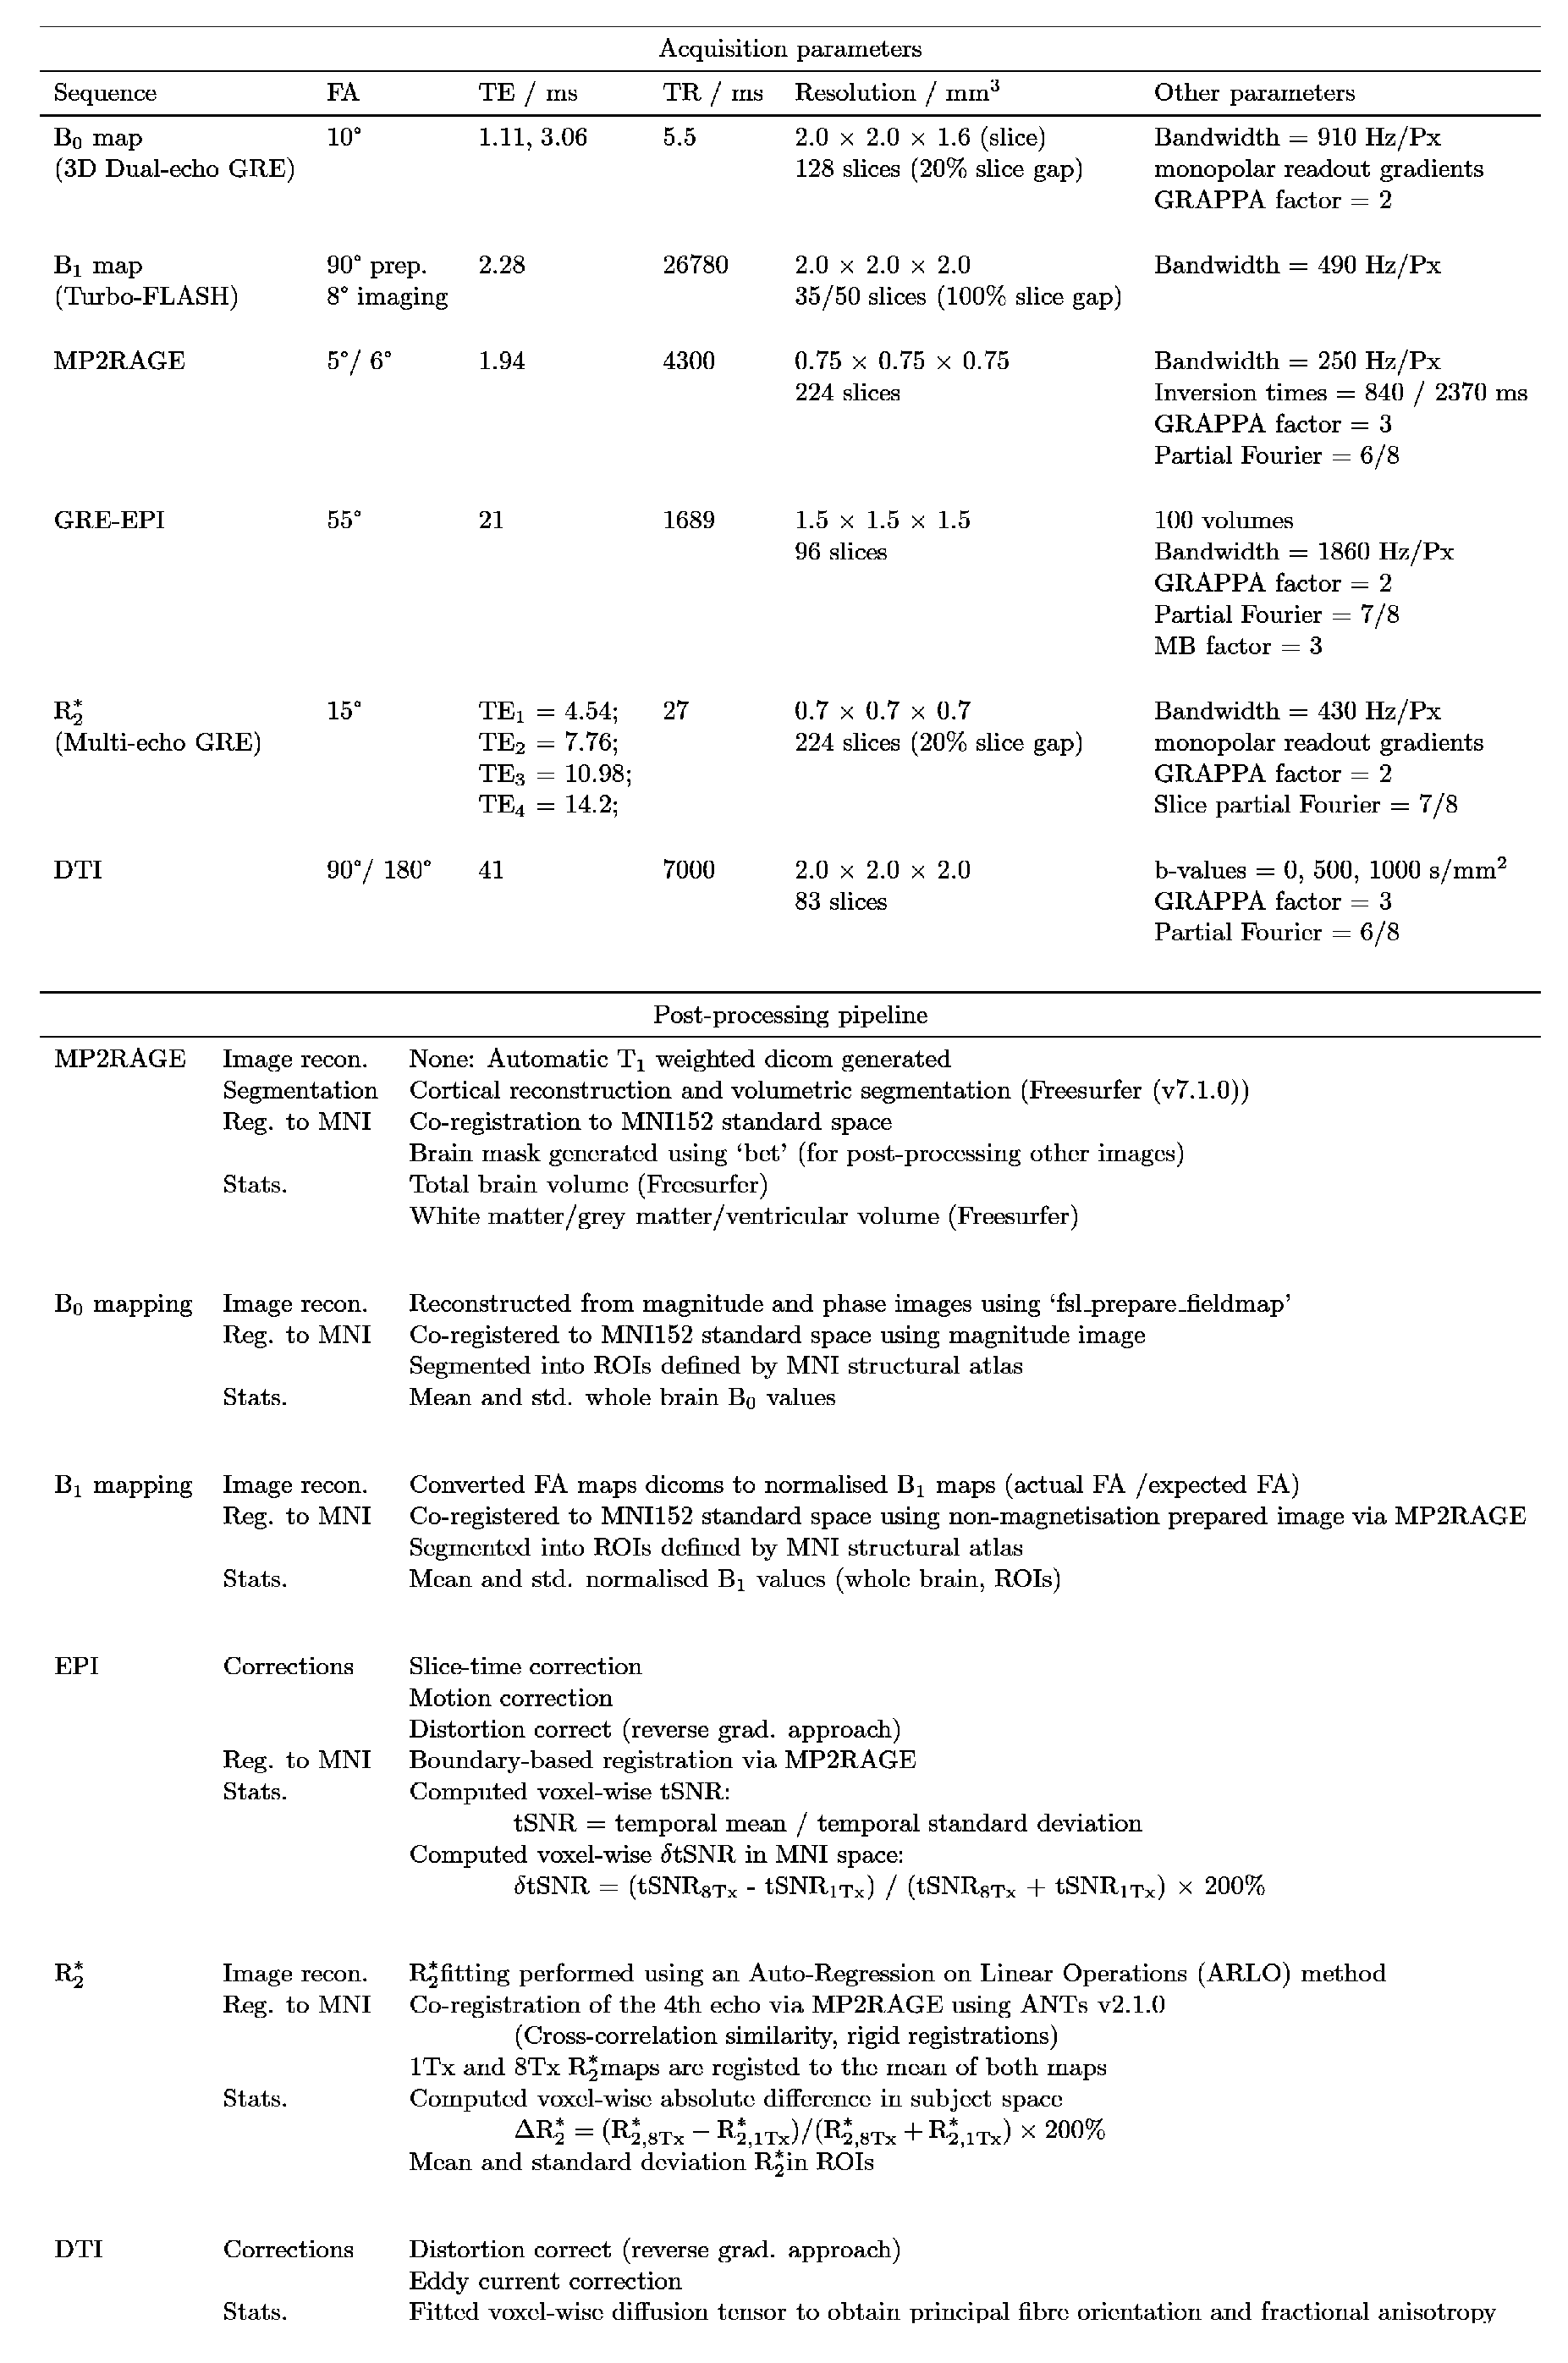
Figure 1:
Imaging parameters and post-processing pipeline are shown. Imaging parameters
were kept constant for both systems. All post-processing pipeline was done in
FSL on nifti images unless otherwise specified. ARLO analysis for R2*
was done as described by Pei et al 3.
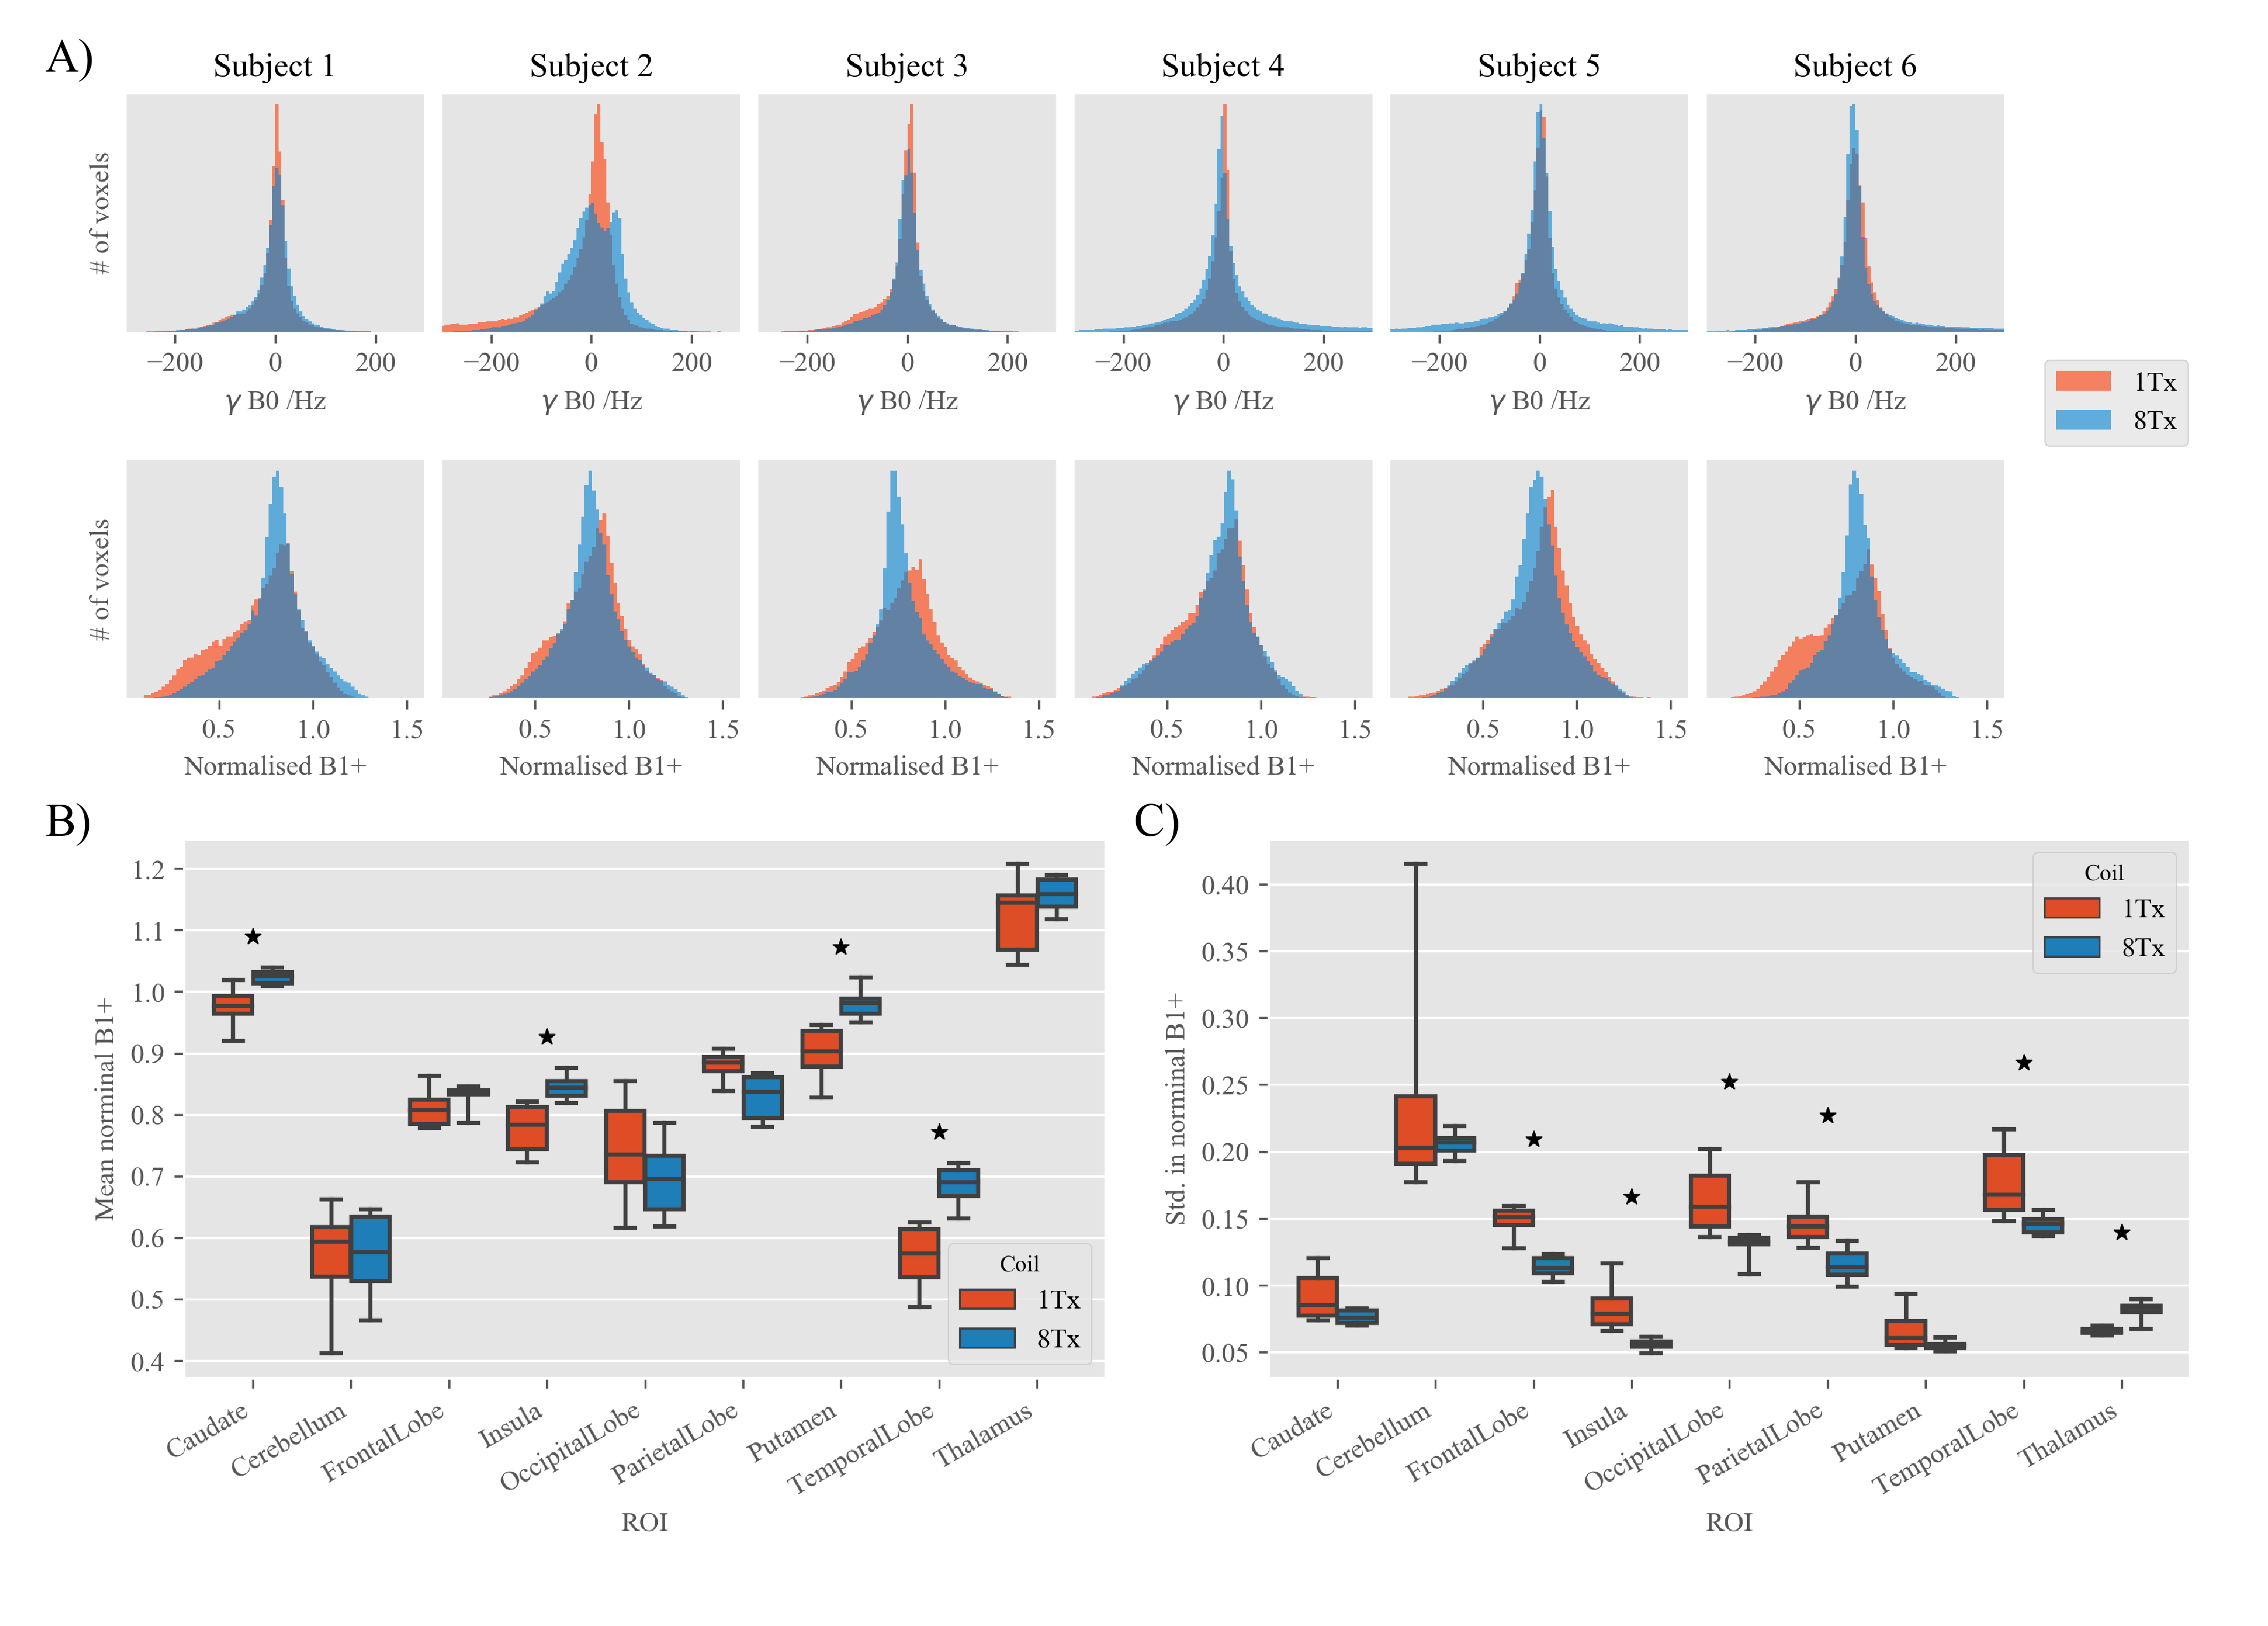
A) Histograms of B0 (top) and normalised B1+
(actual flip angle/expected flip angle) in all voxels defined by the brain
mask. B) Mean and standard deviations in normalised B1+
in the nine anatomical ROIs defined by the MNI atlas. The standard deviation
values across the ROI are used as an indicator of B1+ homogeneity. * = statistically significant difference (P<0.05) between 1Tx
and 8Tx value detected, adjusted for multiple comparisons.
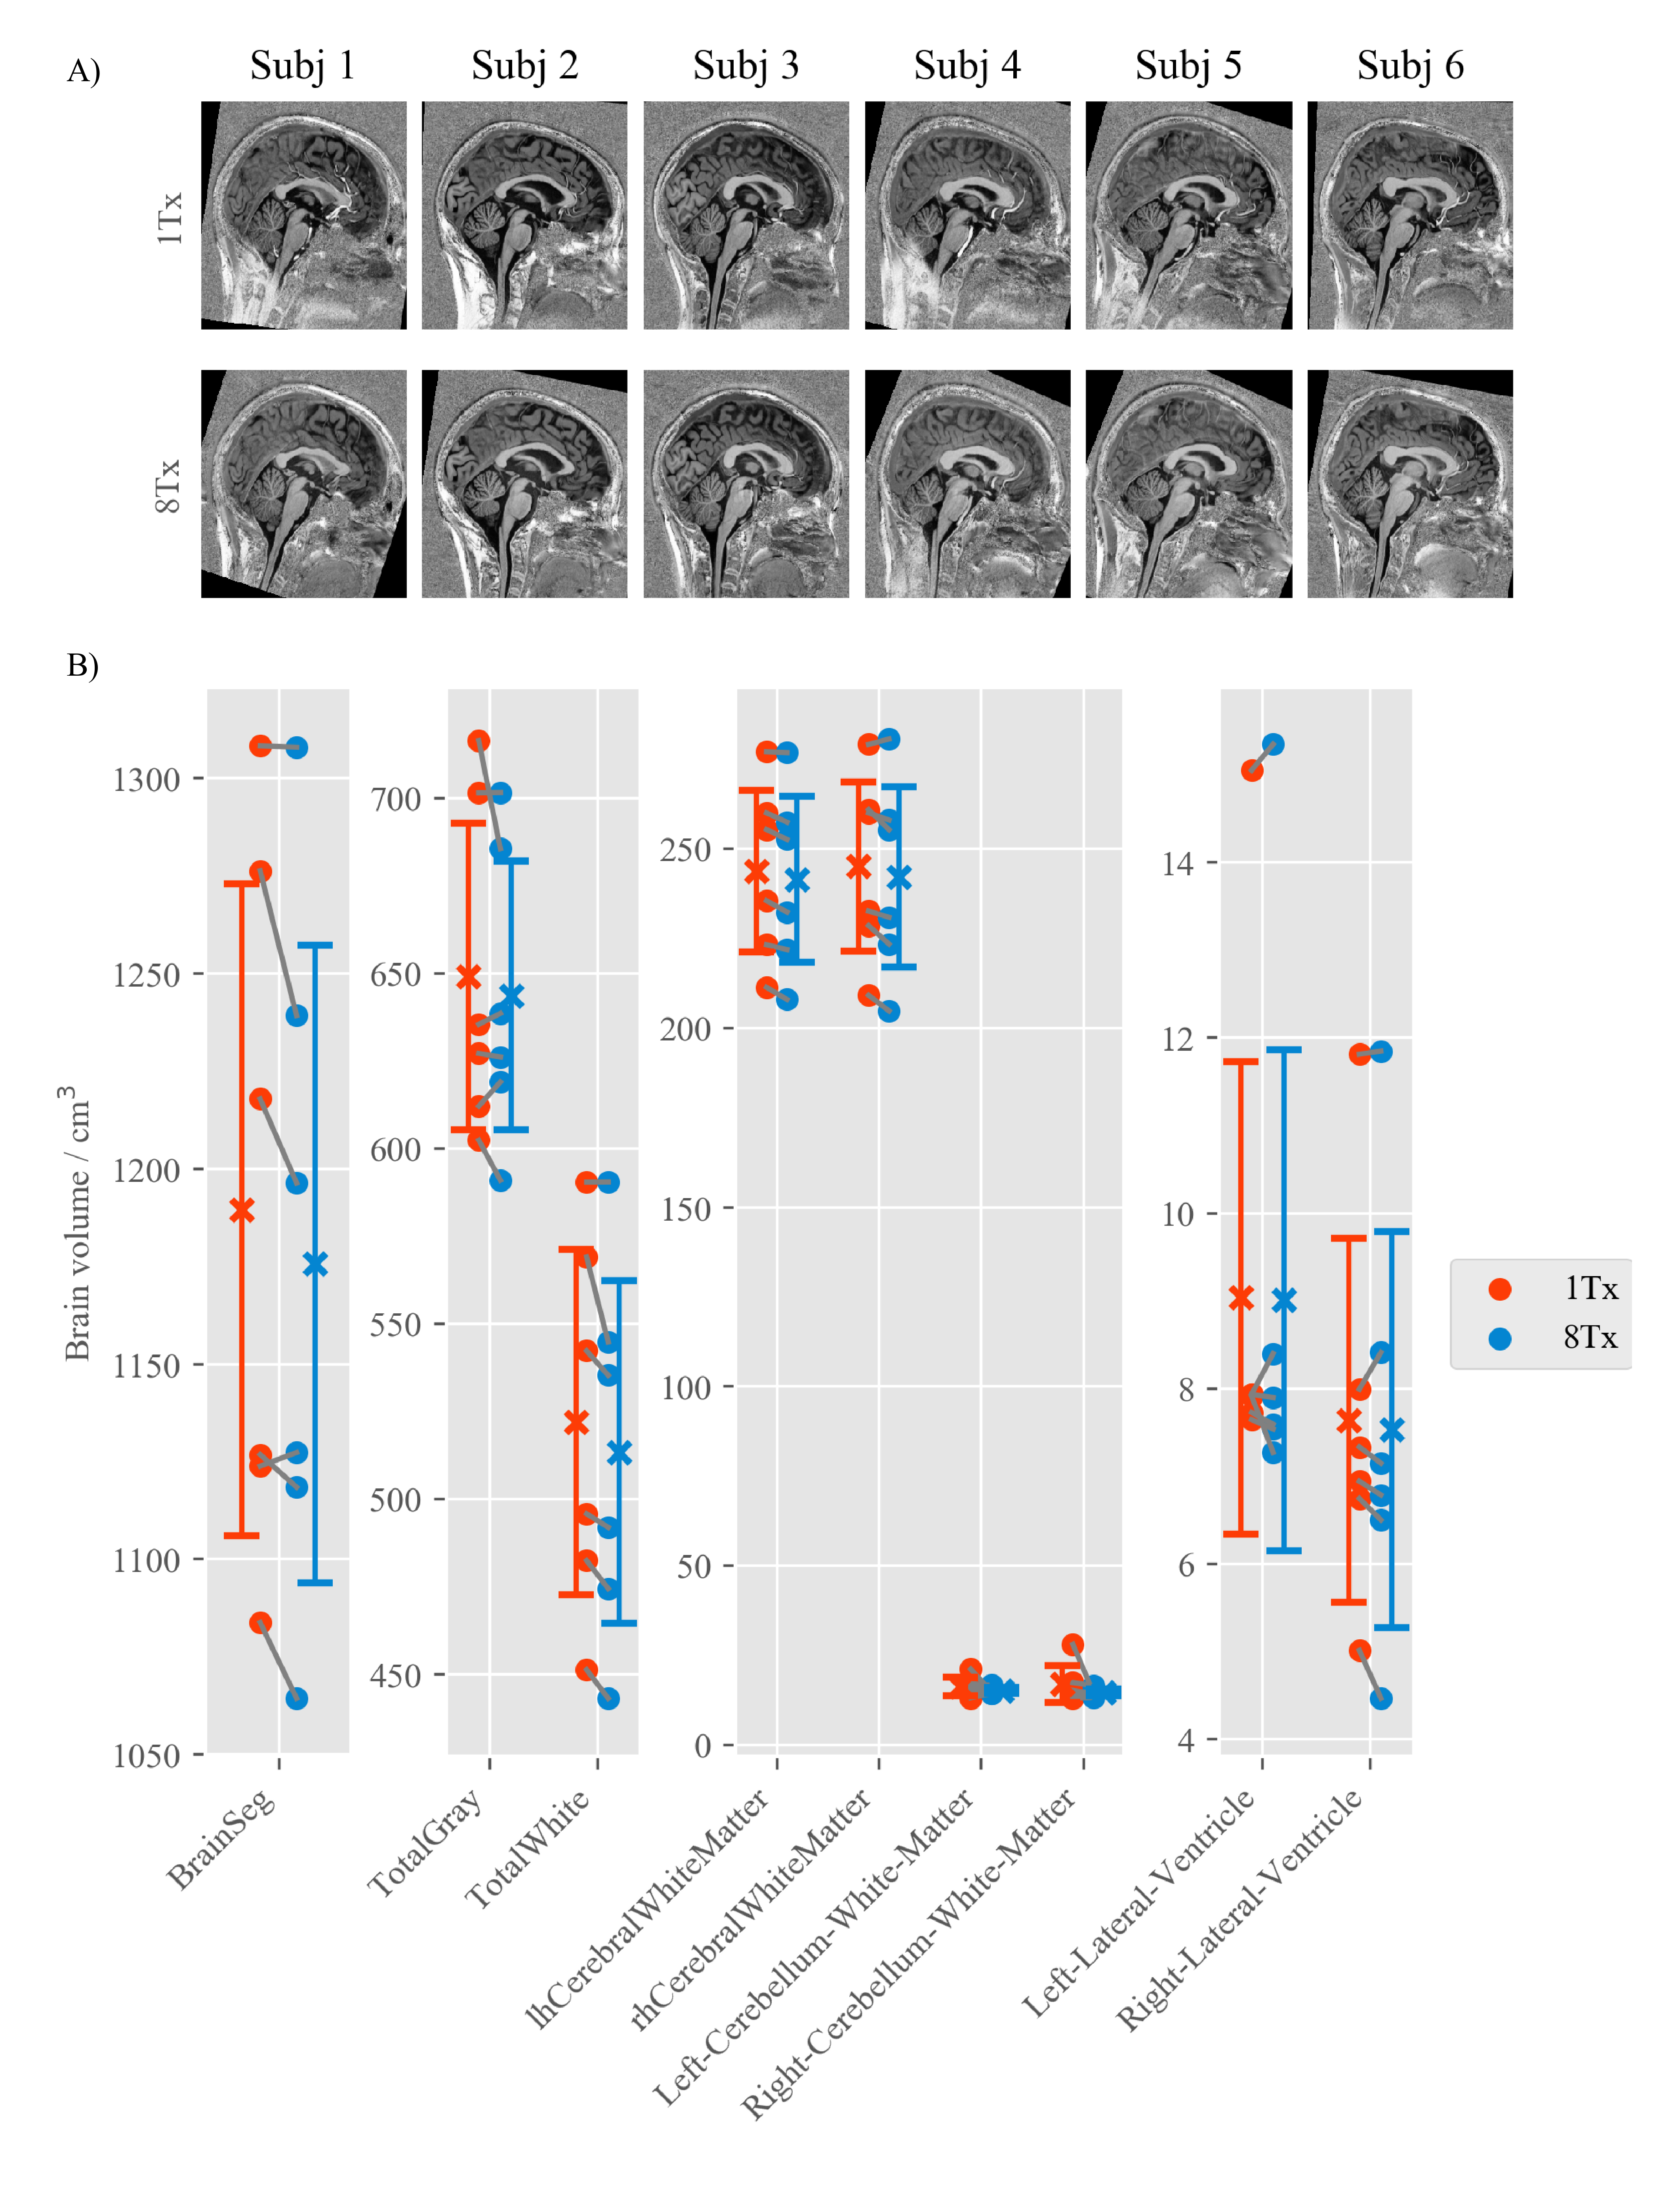
A) Sagittal T1 weighted MP2RAGE images
normalised into the MNI space. B) Scatter plot showing various brain volumes as
segmented by Freesurfer. The bars represent the means and standard deviations.
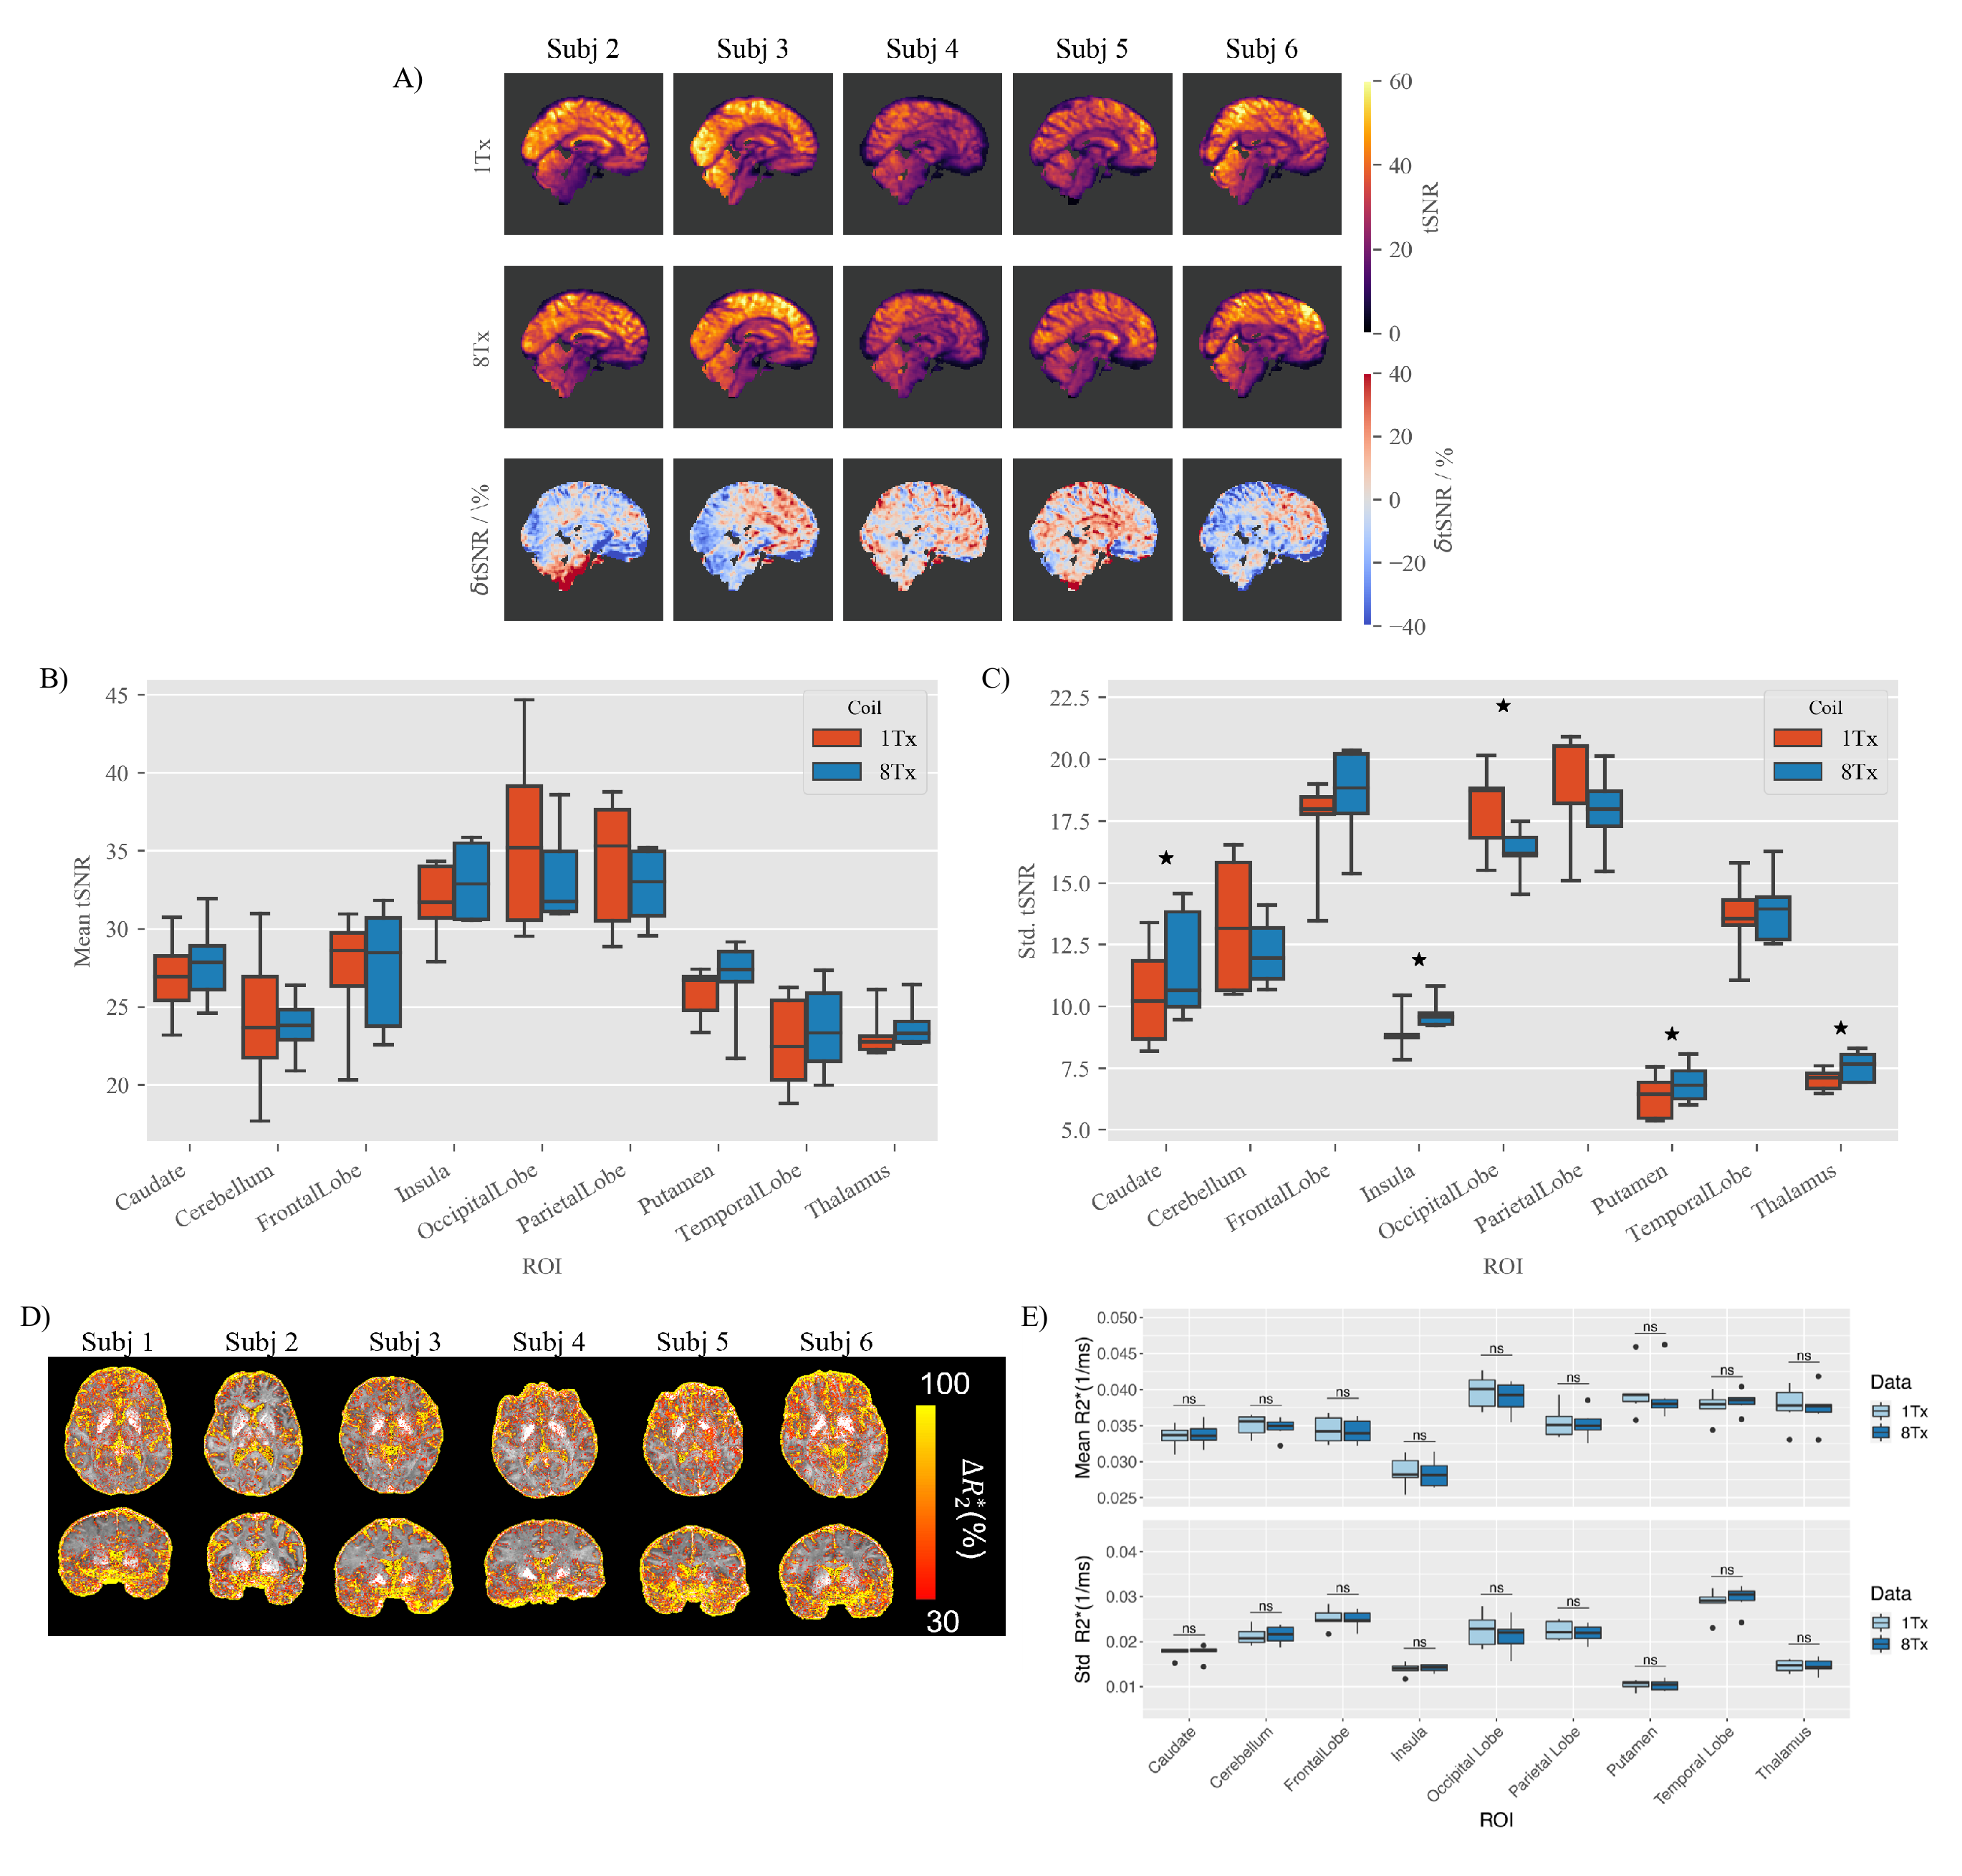
A) Sagittal views of tSNR and δtSNR maps for both coils
normalised into MNI space. B) Box plot showing mean tSNR in the anatomical ROIs
defined by the MNI atlas. C) Box plot showing standard deviations in tSNR in
the anatomical ROIs defined by the MNI atlas. D, E) ΔR2* maps and
mean and std R2* values in anatomical ROIs. * =
statistically significant difference (P<0.05) between 1Tx and 8Tx value
detected, adjusted for multiple comparisons.
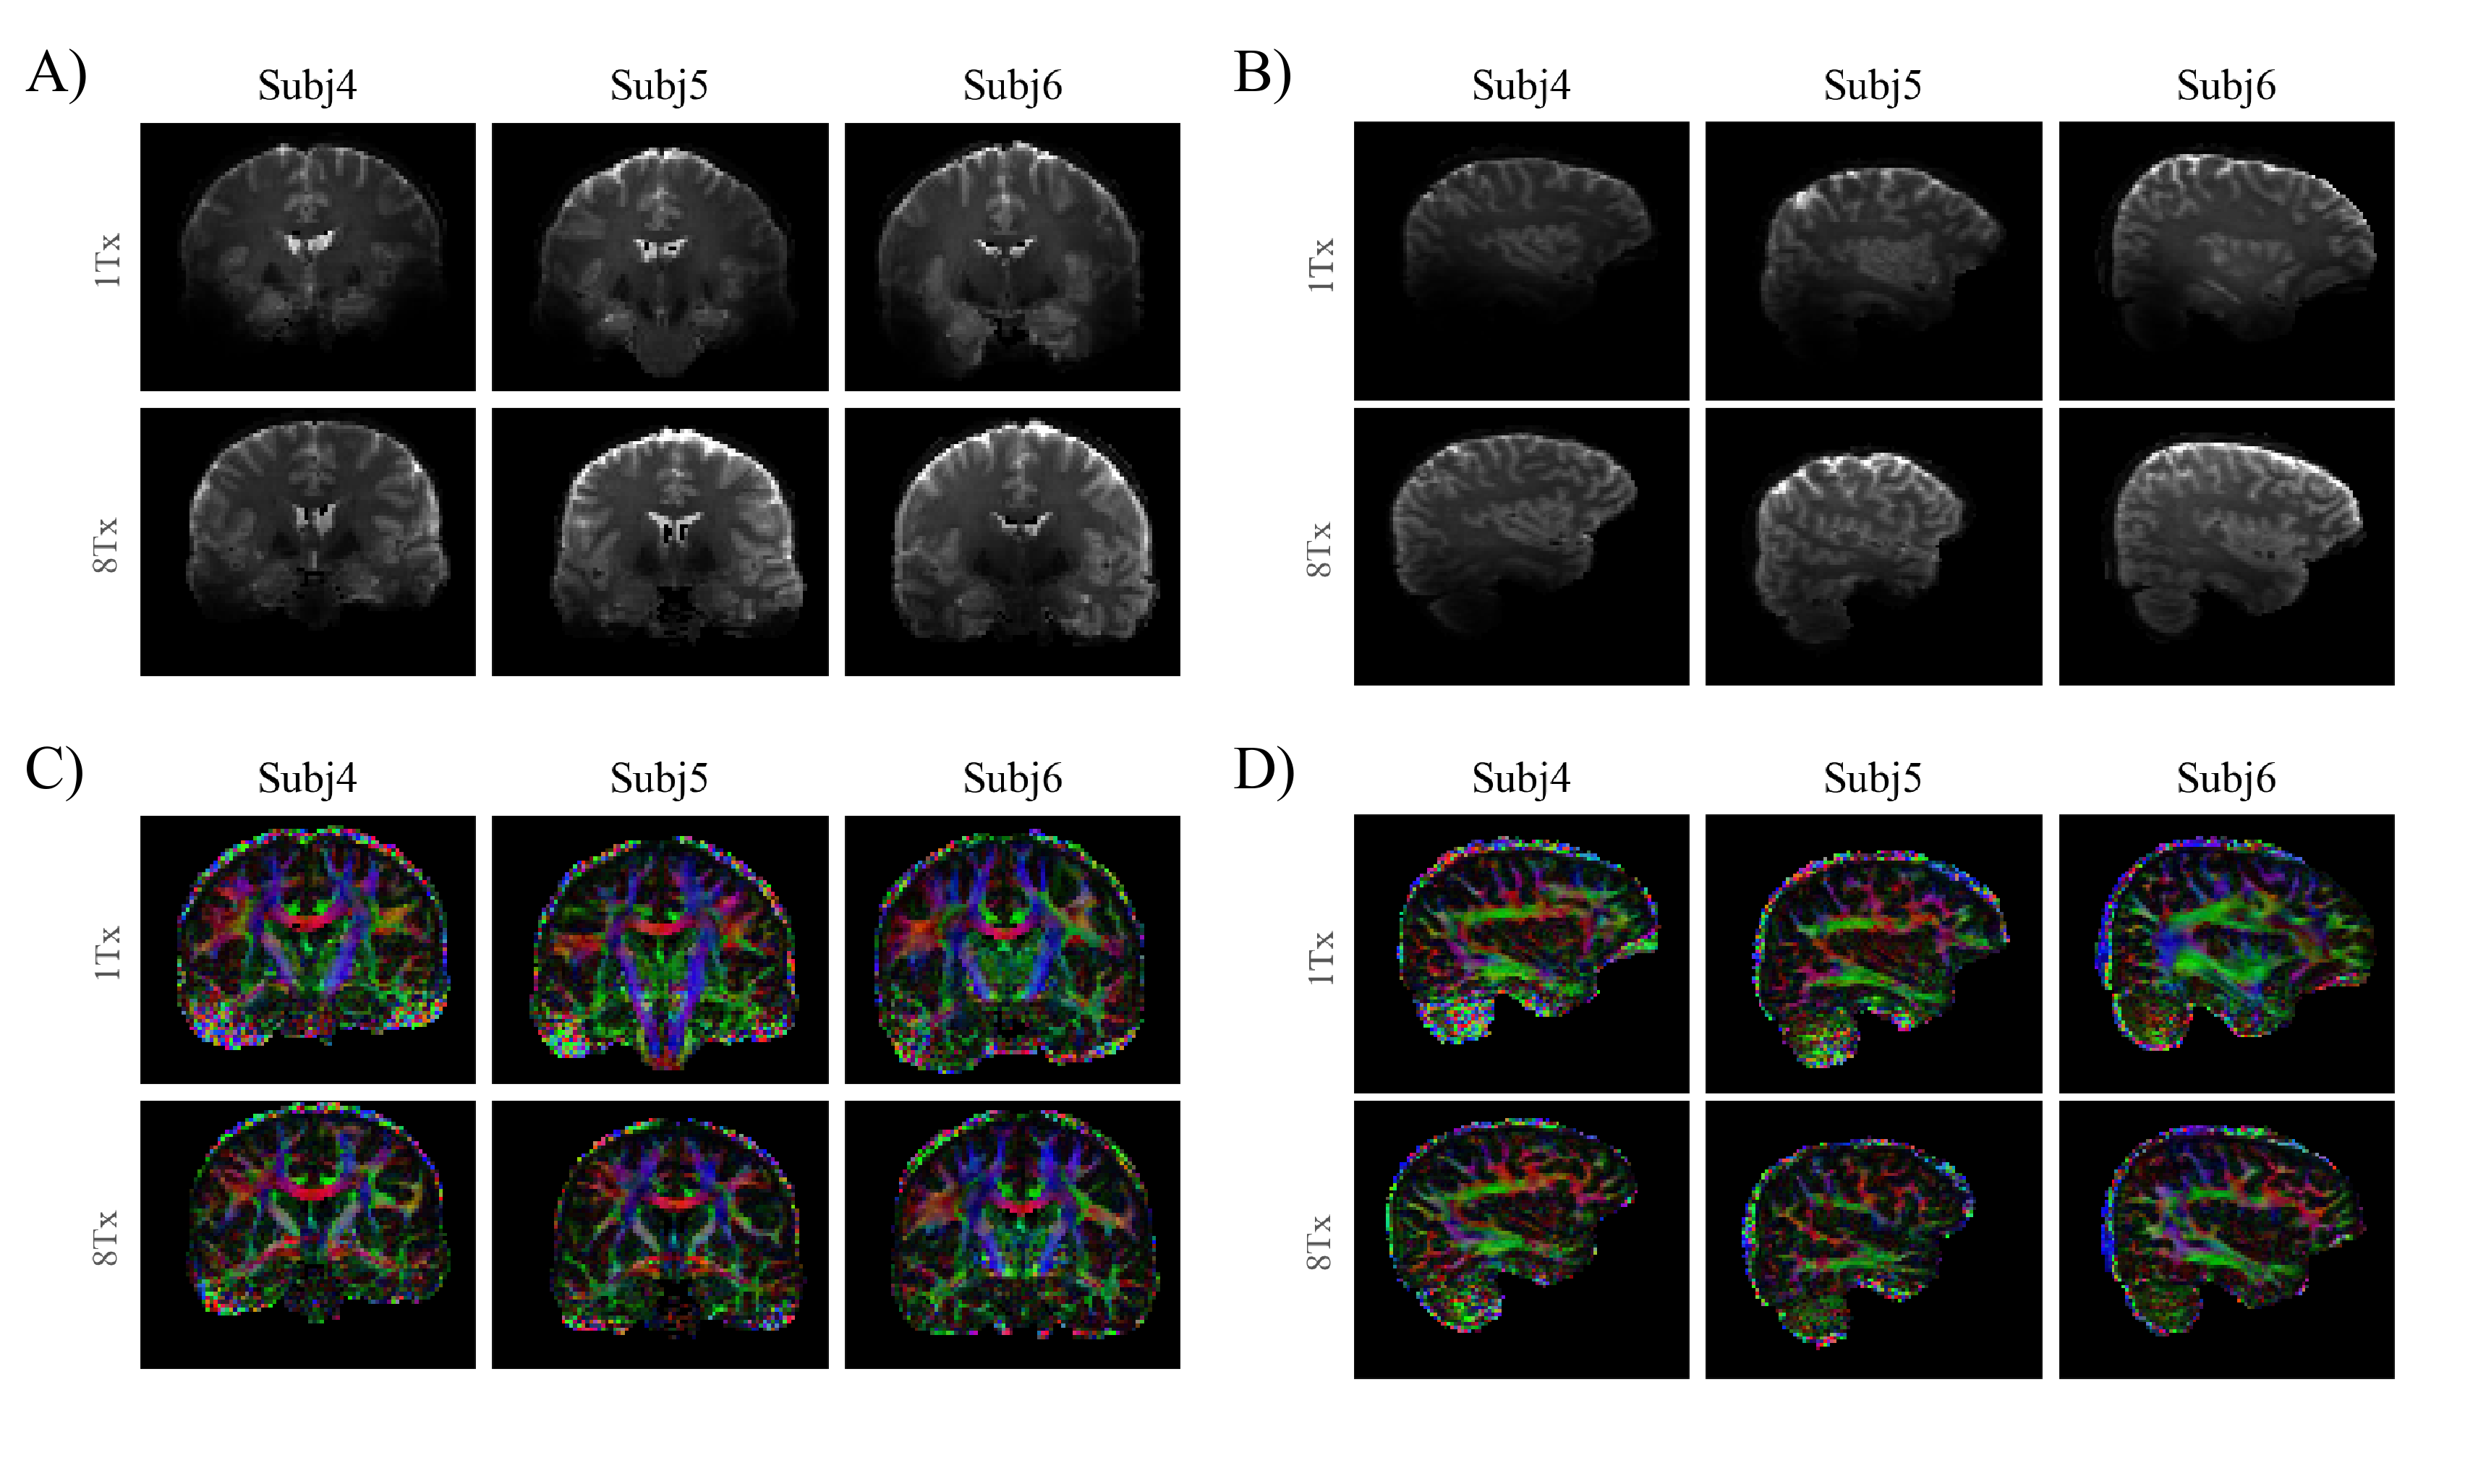
A, B) Coronal and sagittal view of the SE (b=0 s/mm2) images in the
native imaging space. C, D) Corresponding fractional anisotropy and diffusion
tensor maps in the native imaging space
DOI: https://doi.org/10.58530/2022/2094