2093
Functional MRI of large-scale brain networks involved in motor control using parallel transmission at 7 Tesla
Yidi Lu1, Chia-Yin Wu1,2,3, Shota Hodono1,2, Jin Jin2,4, David Reutens1,2, and Martijn A Cloos1,2
1Centre for Advanced Imaging, The University of Queensland, Brisbane, Australia, 2ARC Training Centre for Innovation in Biomedical Imaging Technology, The University of Queensland, Brisbane, Australia, 3School of Information Technology and Electrical Engineering, The University of Queensland, Brisbane, Australia, 4Siemens Healthcare Pty Ltd, Brisbane, Australia
1Centre for Advanced Imaging, The University of Queensland, Brisbane, Australia, 2ARC Training Centre for Innovation in Biomedical Imaging Technology, The University of Queensland, Brisbane, Australia, 3School of Information Technology and Electrical Engineering, The University of Queensland, Brisbane, Australia, 4Siemens Healthcare Pty Ltd, Brisbane, Australia
Synopsis
The standing wave artefact affects SNR and contrast of the images in Ultra-high field (UHF) functional magnetic resonance imaging (fMRI). One way to mitigate this effect is to use parallel transmission (pTx). In this study, we evaluate the benefits of pTx for studies that investigate large-scale brain networks involved in motor control. We show that, compared to the standard circularly polarized (CP) mode, activation patterns in the posterior lobule of the cerebellum, produced by a coordinated finger flexion-extension task in both hands, are better captured using subject-specific pTx pulses.
Introduction
Functional magnetic resonance imaging (fMRI) has been widely used in neuroscience and behavioural science to study the brain. Ultra-high field (UHF) fMRI provides images with high specificity1 and signal to noise ratio (SNR)2. However, the higher frequencies at which these UHF systems operate lead to shorter radiofrequency (RF) wavelengths, that exacerbate interference effects and produce inhomogeneous B1+ fields3. Consequently, when using a standard circularly polarised (CP) transmit coil, the tissue contrast and SNR in the image vary spatially4. In particular, the signal drops significantly in the cerebellum, which is involved in movement planning and motor coordination. One way to address this artefact is to use parallel transmission (pTx) which allows tailored RF pulses (e.g., spokes5 and kT-points6) to be designed to counteract the inhomogeneous field7. Here, we show preliminary results from a task-based fMRI experiment to highlight the benefits of pTx for fMRI of large-scale brain networks involved in fine motor control and coordination, including areas such as cerebellum.Methods
Paradigm: A block design paradigm was used for the task. The subject flexed and extended their fingers (~2 Hz) during the ON block (6s) and the hands remained in a relaxed position during the OFF block (12s) (Fig 1a). During each run, all fingers in both hands were flexed and extended either synchronously or asynchronously (Fig 1c). The complete paradigm was measured twice, once using the CP-mode and once using subject-specific pTx-kT-points pulses6 (8 sub-pulses, duration = 1.18ms). The task was also performed using only one hand (pTx mode only). A visual cue was used to instruct the participant when to move (Fig 1b). Additionally, a custom data glove8, which measures finger joint angles, was worn by the participant to monitor and record their finger movements during the scan (Fig 1d).Data acquisition: One subject was scanned on a 7 Tesla whole-body MRI scanner (Siemens Healthineers, Erlangen, Germany) using an 8-channel transmit/32-channel receive head coil array (Nova Medical, MA, USA). For calibration, SA2RAGE9 (TR/TE/TD1/TD2 = 2400ms/0.95ms/106ms/1800ms, 4x4x4mm3, iPAT = 2) and a custom 2D interleaved gradient recalled echo (GRE) (TR/TE = 300ms/3ms, 4×4×4mm3, iPAT = 3) were used to generate absolute B1+ maps. Additionally, T2*-weighted images (TR/TE = 1500ms/12ms, 2x2x2mm3, iPAT = 3) were also obtained to make brain masks in FSL-BET10 (Brain Extraction Tool) (FMRIB’s software library, www.fmrib.ox.ac.uk/fsl, version 6.0.4). An anatomical reference was acquired using an MP2RAGE11 sequence (0.75x0.75x0.75mm3, FOV = 156x225x240mm3, TR/TI1/TI2/TE = 4300ms/840ms/2450ms/1.99ms). All fMRI data were collected using a 3D gradient EPI sequence (1.25x1.25x1.25mm3, FOV = 150x220x220mm3, TRvol/TR/TE = 2035ms/55ms/26ms, flip angle = 12°, number of measurements per run = 150, total scan time per run = 5min). The study was approved by the local human research ethics committee in accordance with national guidelines.
Pre-processing: Motion correction was applied as the first step in SPM12 (Statistical Parametric Mapping, www.fil.ion.ucl.ac.uk/spm, version 12), then the realigned results were registered onto the MP2RAGE anatomical images. FSL-BET10 was used to extract the brain in the registered images. Smoothing (full width at half maximum = 2.5mm) was applied on the extracted brain images in SPM. Z-score maps were generated in FSL using a canonical hemodynamic response function (HRF) as a model. Temporal SNR (tSNR) maps were calculated for both pTx and CP-mode resting-state images by dividing the mean by the standard deviation of the time series. The mean tSNR in the cerebellum was calculated for both modes.
Results & Discussion
In pTx mode, the flip angles become more uniform (Fig 2) and the tSNR increased (Fig 3), in some locations, by more than a factor of 2. Mean tSNR in the cerebellum was 1.5 times higher than for CP-mode. Changes in tSNR and flip angles are well matched because greater flip angle homogeneity enables higher tSNR4.Activations for finger flexion-extension in one hand are shown in Fig 4. The contralateral primary motor cortex (M1) was activated in both left- and right-hand tasks as expected13,14,15. The ipsilateral anterior lobule of the cerebellum was also activated as previously observed16.
Activation patterns in the anterior cerebellum were similar for the asynchronous task using the pTx and CP-mode (Fig 5a), whereas activation of the posterior cerebellum, previously demonstrated for finger flexion-extension14, was only seen with the pTx acquisition. For the synchronous task, activations close to the primary fissure and in the posterior cerebellum were only seen in pTx-mode. In the CP-mode data, these activations were fewer with lower z-scores (Fig 5b).
Conclusion
At 7 Tesla, pTx pulses can improve the tSNR across the brain, especially in the cerebellum. pTx is beneficial when studying large-scale brain networks involved in fine motor control.Acknowledgements
This work was supported by ARC Future fellowship grant FT200100329. The authors acknowledge the facilities of the National Imaging Facility at the Centre for Advanced Imaging.References
- Ugurbil K. Magnetic resonance imaging at ultrahigh fields. IEEE Trans Biomed Eng. 2014;61(5):1364-1379.
- Vaughan JT, Garwood M, Collins CM, et al. 7T vs. 4T: RF power, homogeneity, and signal-to-noise comparison in head images. Magn Reson Med. 2001;46(1):24-30.
- Vaidya MV, Collins CM, Sodickson DK, Brown R, Wiggins GC, Lattanzi R. Dependence of B1+ and B1- Field Patterns of Surface Coils on the Electrical Properties of the Sample and the MR Operating Frequency. Concepts Magn Reson Part B Magn Reson Eng. 2016;46(1):25-40.
- Padormo F, Beqiri A, Hajnal JV, Malik SJ. Parallel transmission for ultrahigh-field imaging. NMR Biomed. 2016;29(9):1145-1161.
- Saekho S, Yip C, Noll DC, Boada FE, Stenger VA. Fast‐kz three‐dimensional tailored radiofrequency pulse for reduced B1 inhomogeneity. Magnet Reson Med. 2006;55(4): 719–724.
- Cloos MA, Boulant N, Luong M, et al. kT -points: short three-dimensional tailored RF pulses for flip-angle homogenization over an extended volume. Magn Reson Med. 2012;67(1):72-80.
- Le Ster C, Moreno A, Mauconduit F, et al. Comparison of SMS-EPI and 3D-EPI at 7T in an fMRI localizer study with matched spatiotemporal resolution and homogenized excitation profiles. PLoS One. 2019;14(11):e0225286.
- Hodono S, Maillet D, Jin J, Reutens D, Cloos MA. A custom MR-compatible data glove for fMRI of the human motor cortex at 7T. Proc. 29th ISMRM. 2021; Abstract 2673.
- Eggenschwiler F, Kober T, Magill AW, Gruetter R, Marques JP. SA2RAGE: a new sequence for fast B1+ -mapping. Magn Reson Med. 2012;67(6):1609-1619.
- Smith SM. Fast robust automated brain extraction. Hum Brain Mapp. 2002;17(3):143-155.
- Marques JP, Kober T, Krueger G, van der Zwaag W, Van de Moortele PF, Gruetter R. MP2RAGE, a self bias-field corrected sequence for improved segmentation and T1-mapping at high field. Neuroimage. 2010;49(2):1271-1281.
- Penny WD, Friston KJ, Ashburner JT, Kiebel SJ, Nichols TE. Statistical parametric mapping: the analysis of functional brain images: the analysis of functional brain images. Elsevier; 2011.
- Habas C, Axelrad H, Nguyen TH, Cabanis E. Specific neocerebellar activation during out-of-phase bimanual movements. Neuroreport. 2004;15(4):595-9.
- Thickbroom GW, Byrnes ML, Mastaglia FL. Dual representation of the hand in the cerebellum: activation with voluntary and passive finger movement. Neuroimage. 2003;18(3):670-674.
- Arbuckle SA, Weiler J, Kirk E, et al. Structure of population activity in primary motor cortex for single finger flexion and extension. J Neurosci. 2020;40(48):9210-9223.
- Manto M, Bower JM, Conforto AB, et al. Consensus paper: roles of the cerebellum in motor control--the diversity of ideas on cerebellar involvement in movement. Cerebellum. 2012;11(2):457-487.
Figures
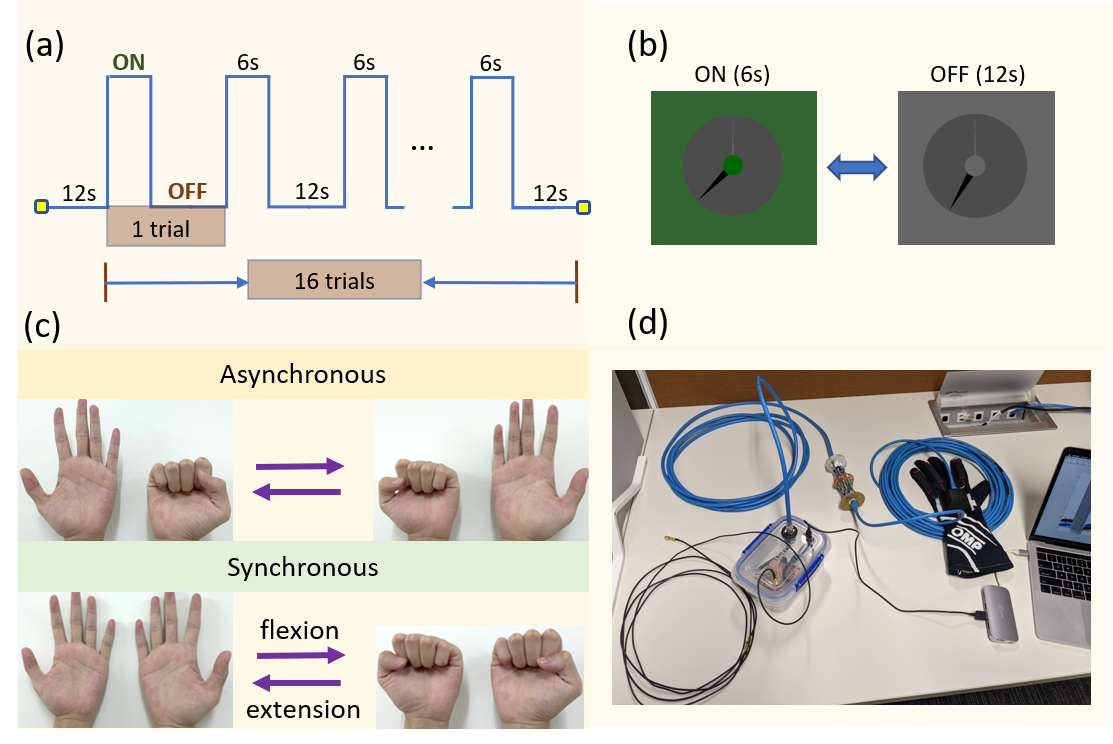
Figure 1: (a) Paradigm for the finger flexion-extension task. Every
run was 5 minutes and contained 16 trials. Each trial consisted of 6s ON block
and 12s OFF block. (b) Visual cue used for task instruction. During ON block,
the central green circle flickered at 2Hz, instructing each flexion-extension
action. During OFF block, the clock turned into grey. (c) Asynchronous and
synchronous finger flexion-extension tasks.
(d) Custom data glove8 used to monitor and record the finger movement
during the scan.
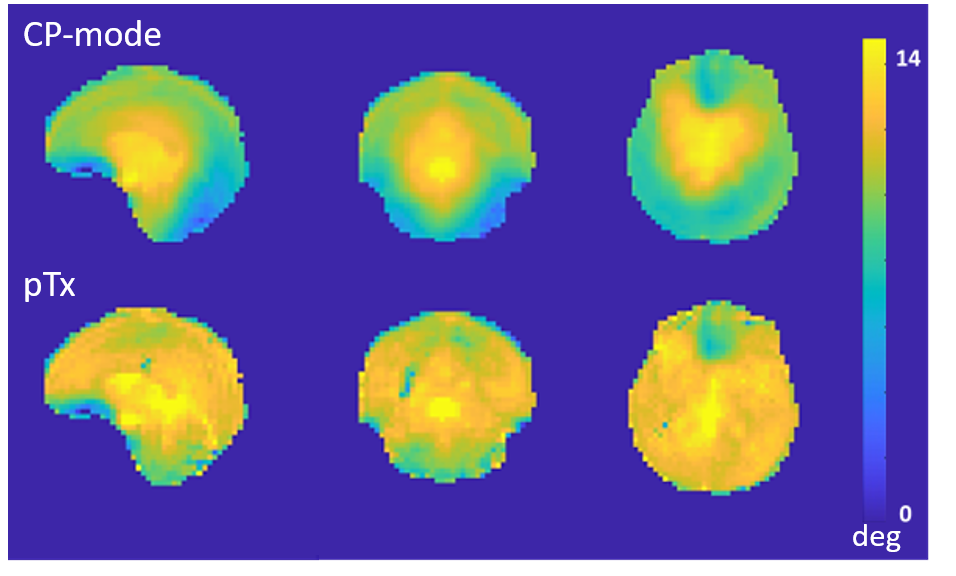
Figure 2: Flip angle maps acquired using CP-mode and pTx, both
with flip angle set to 12°.
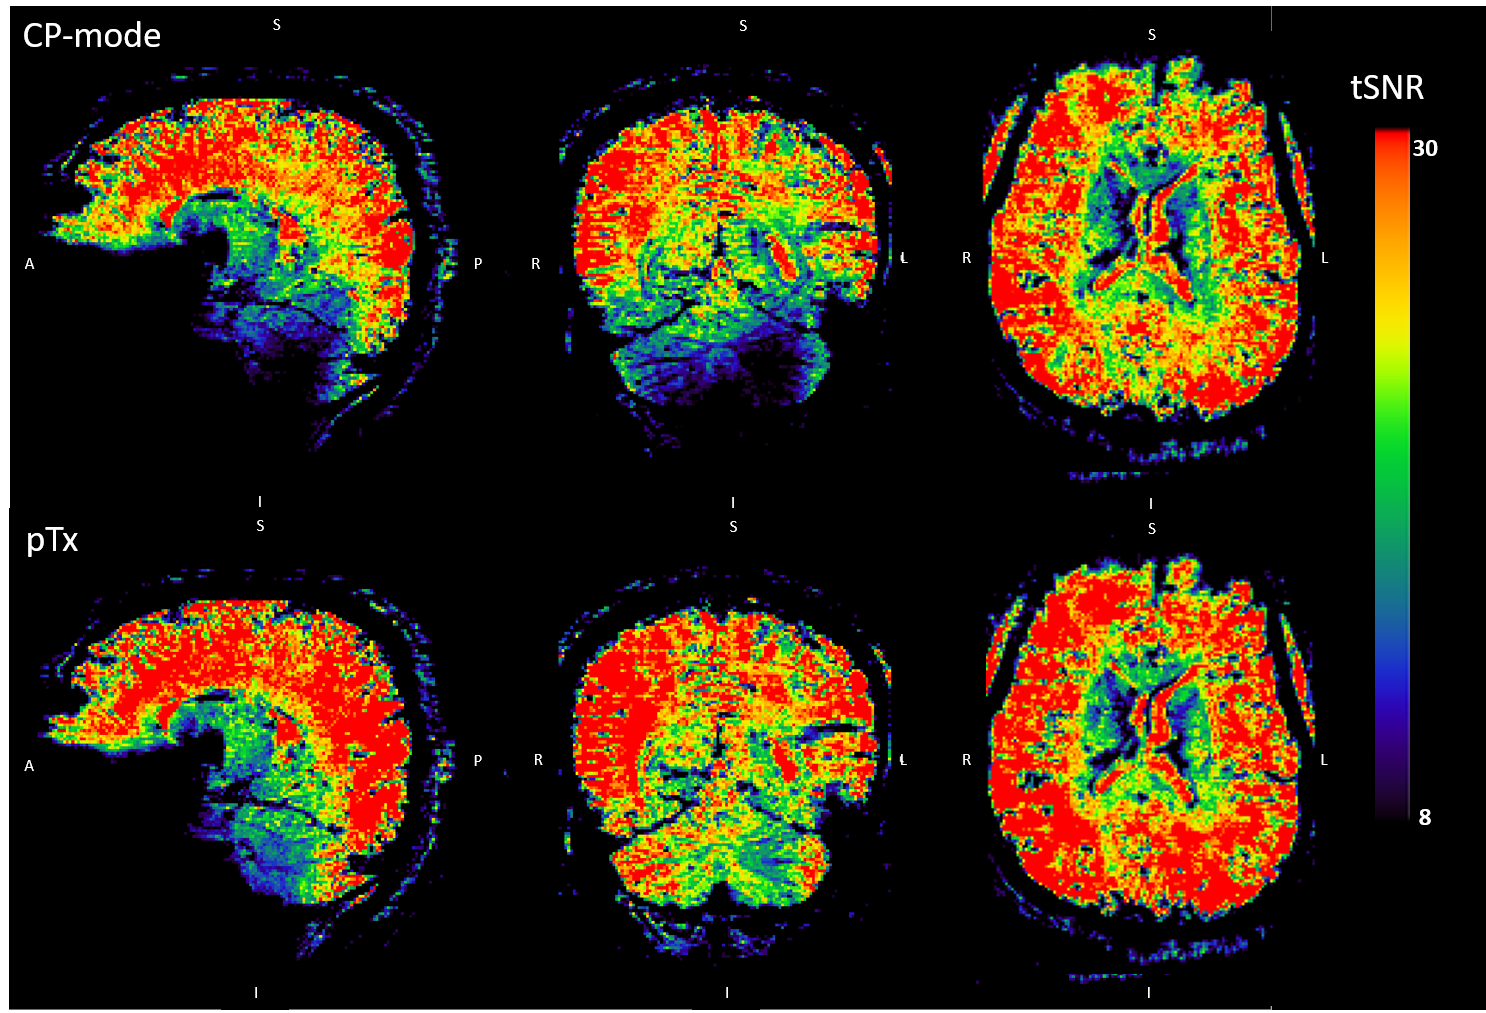
Figure 3: Temporal signal to noise ratio (tSNR) maps using
CP-mode and pTx. The maps were calculated by dividing the mean by the standard
deviation of the time series. Warm and cold colours represent high and low tSNR
respectively.
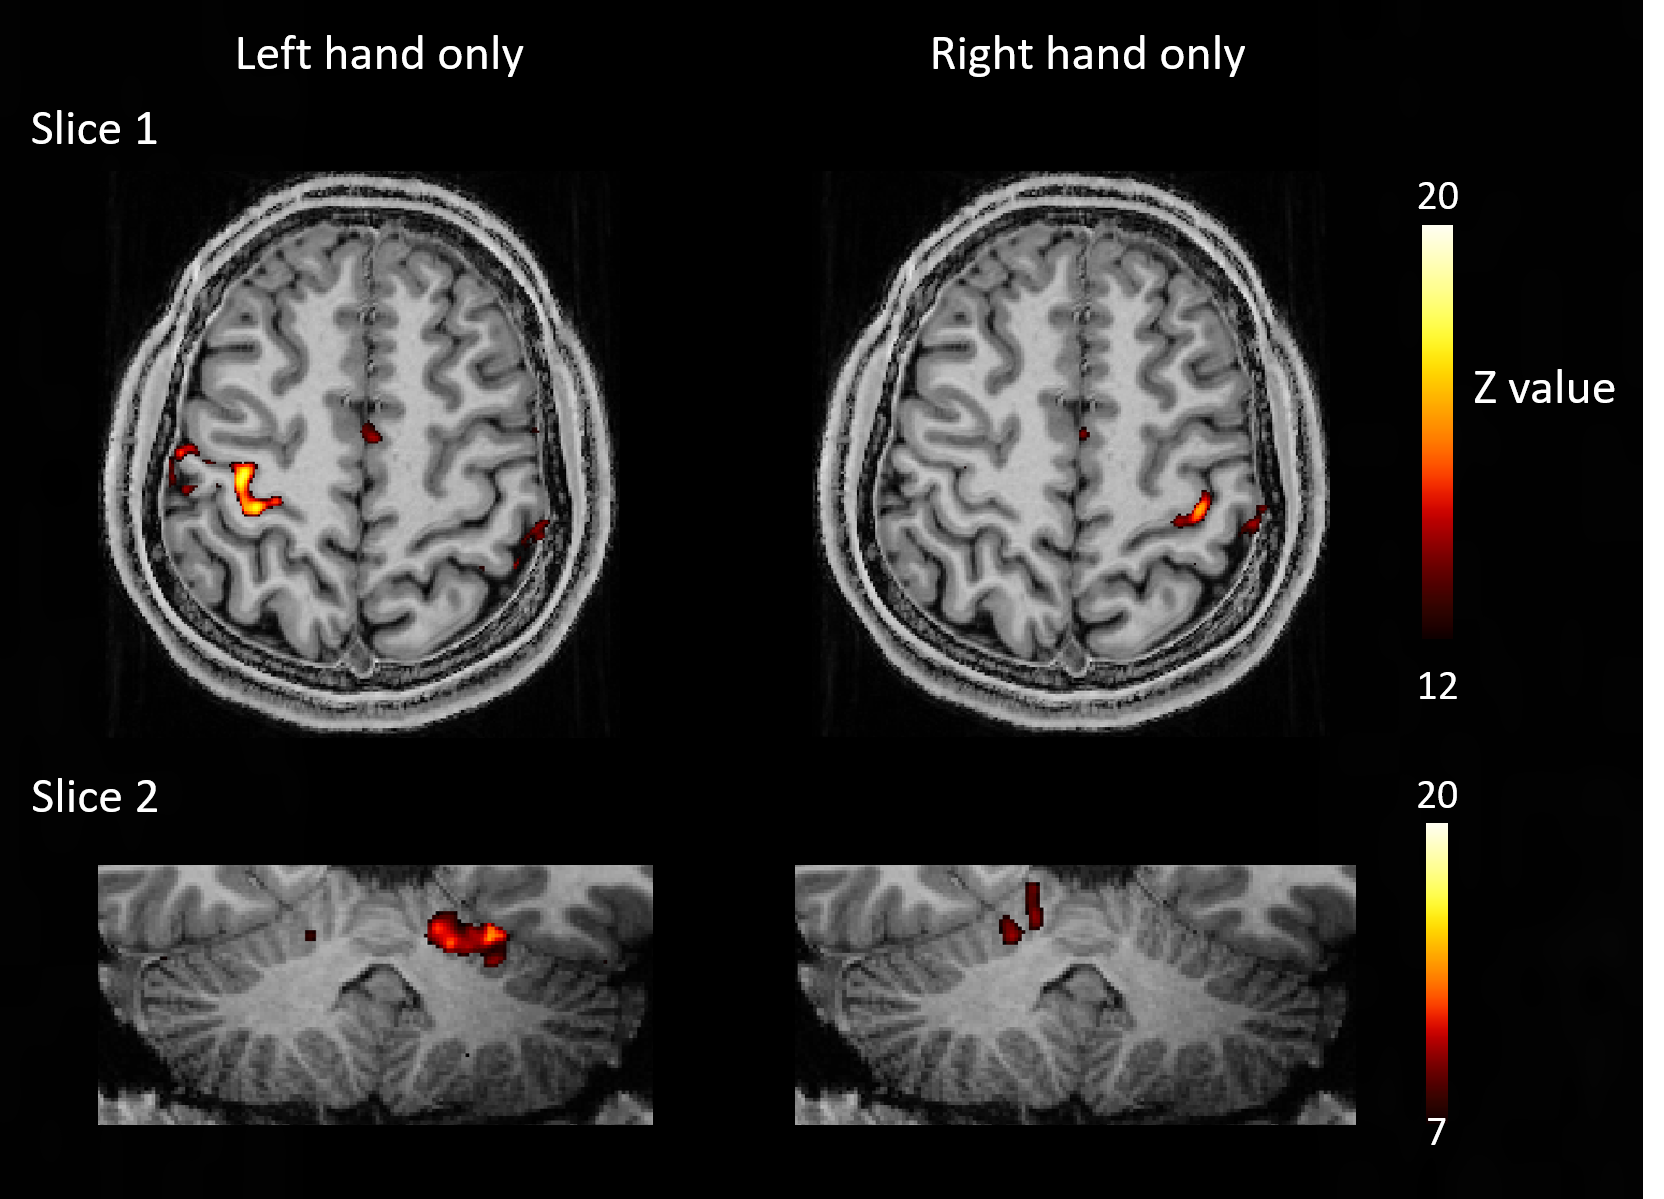
Figure 4: Z-scores for the brain activation during finger
flexion-extension using left or right hand with pTx. Same slices were selected
here for left/right hand results comparison. An axial slice and a coronal slice
were picked to demonstrate activations in primary motor cortex and cerebellum,
respectively. The ranges of z-scores were set differently for slice 1 and 2.
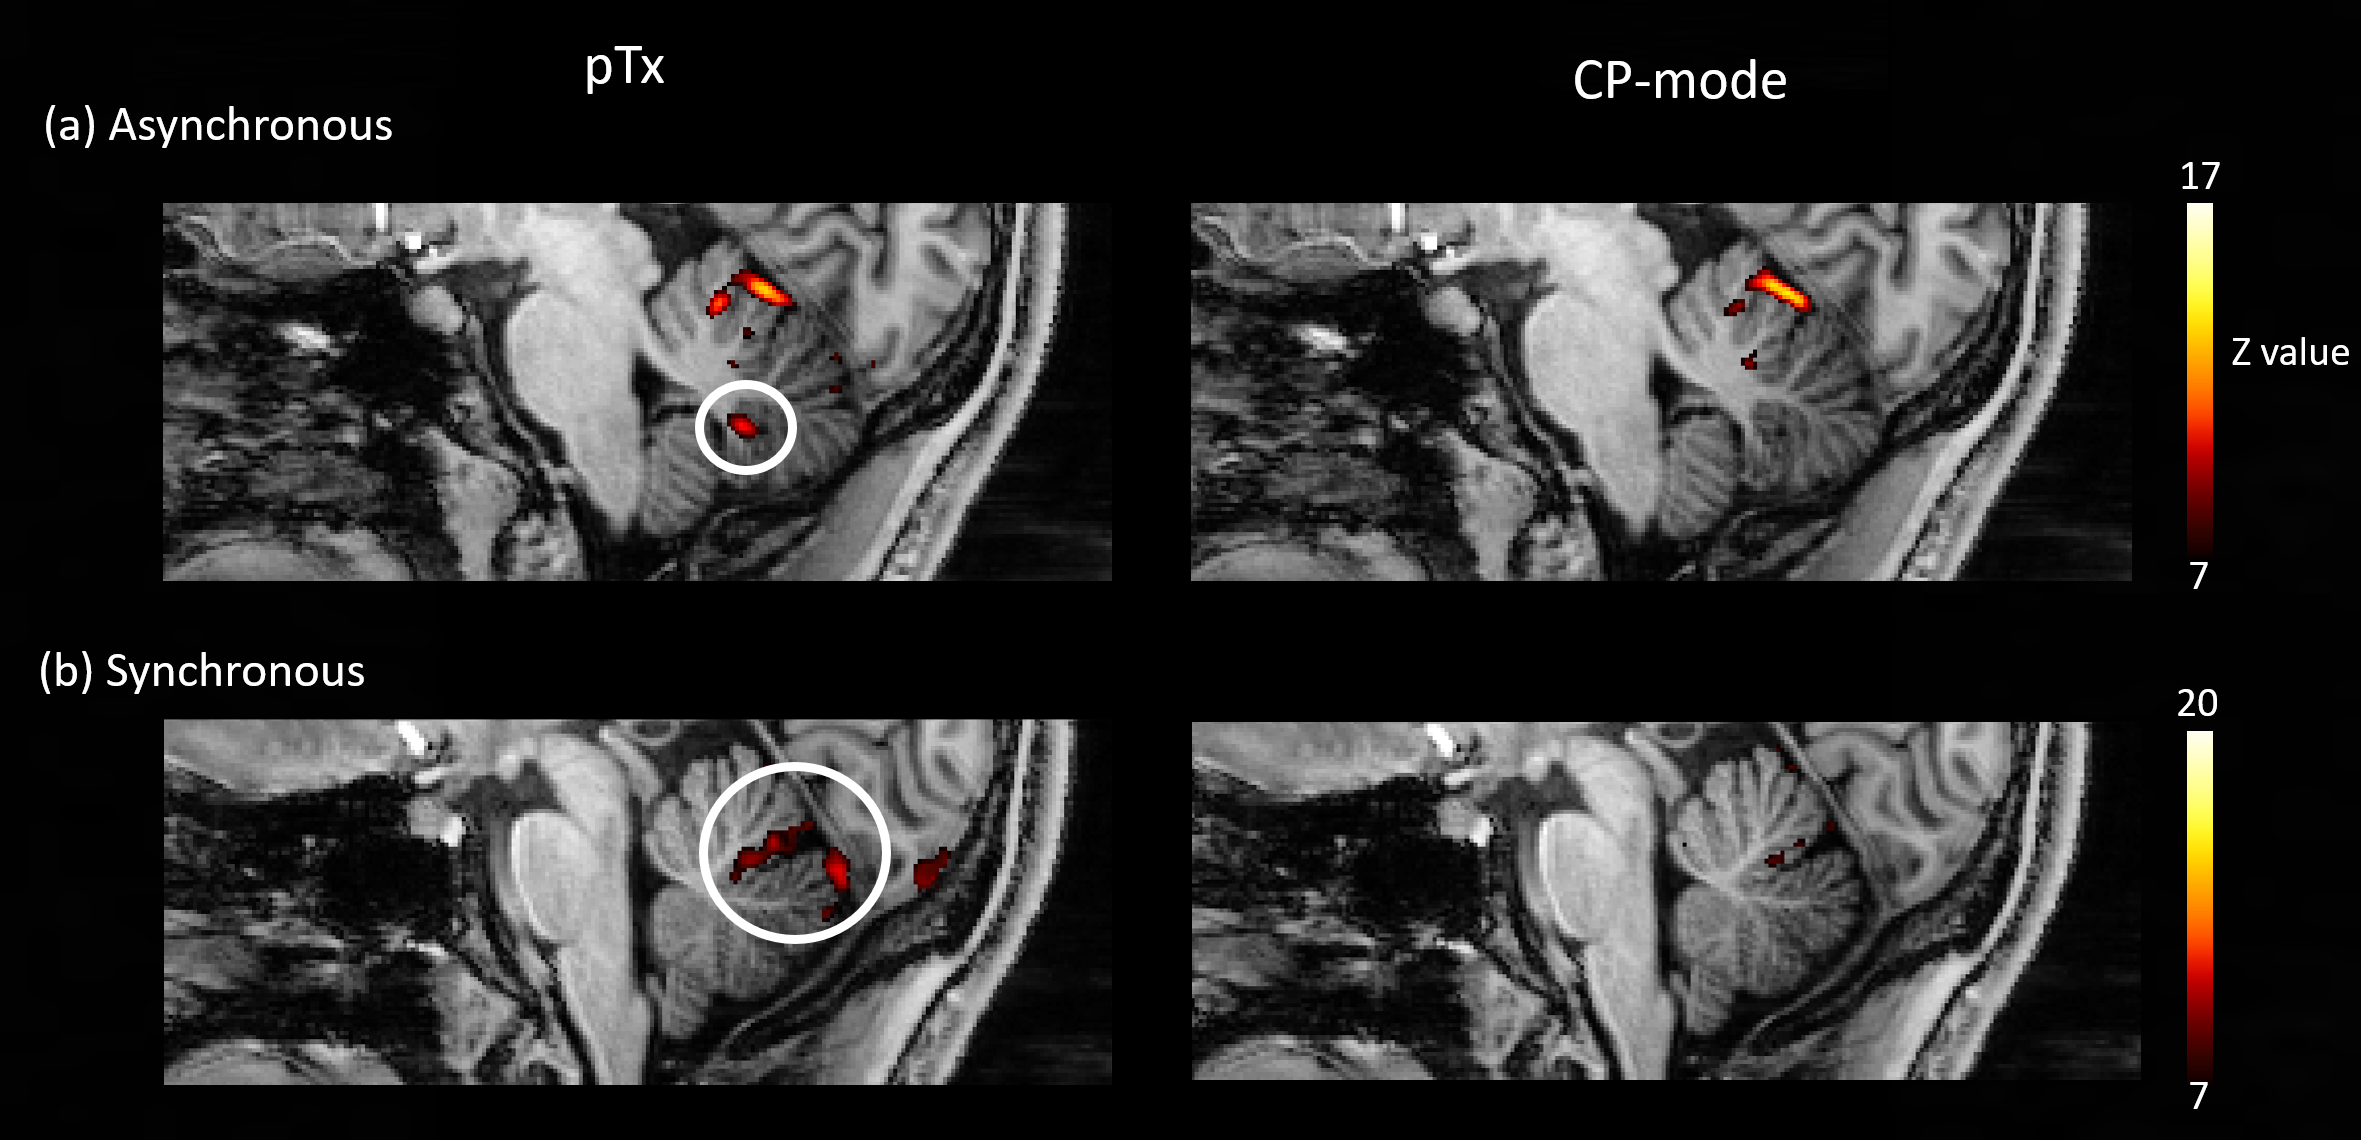
Figure 5: (a) Activations in the
cerebellum during the asynchronous task in either pTx or CP-mode. The
activation in the posterior cerebellum under pTx mode was circled in white. (b)
Activations in the cerebellum during the synchronous task in either pTx or
CP-mode. The activations under pTx mode were located at the primary fissure and
posterior cerebellum and were circled in white. The ranges of z-scores were selected differently for results
demonstration.
DOI: https://doi.org/10.58530/2022/2093