2089
Sodium Coil dedicated Universal Sensitivity Map for scan time reduction of 7T MR in-vivo Sodium Imaging1Radiology, BWH Center for Clinical Spectroscopy, Boston, MA, United States
Synopsis
Sodium studies have shown subtle pathophysiologic changes in tissue sodium concentrations (TSC) in the early stage of the various diseases. One of the major challenges with measuring TSC is its low SNR. Phased array coils are used to increase sodium SNR, however, they result in an inhomogeneous receive profile that makes accurate quantitation of TSC difficult. Uniformity correction is thus required and is often done by generating a sensitivity map. A previous approach introduced the concept of utilizing a universal sensitivity map to reduce total scan time. We present an improved universal sensitivity map solution.
Purpose
In this work, we present a universal sensitivity map for 7T sodium imaging which reduces scan time and makes clinical sodium imaging practical.Introduction
Sodium is the key component of cellular homeostasis. Studies have shown subtle pathophysiologic changes in tissue sodium concentrations (TSC) in the early stage of the various diseases1-3. One of the major challenges with measuring TSC is its low SNR. Phased array coils are used to increase sodium SNR, however, they result in an inhomogeneous receive profile that makes accurate quantitation of TSC difficult. Uniformity correction is thus required and is often done by generating a sensitivity map. This requires an additional scan which lengthens patient scan time. A previous approach4 introduced the concept of utilizing a universal sensitivity map to reduce total scan time. We present an improved universal sensitivity map utilizing a 3D printed phantom that covers the entire sodium coil inner volume. This is advantageous as it can be used for all patients regardless of head size.Material and Methods
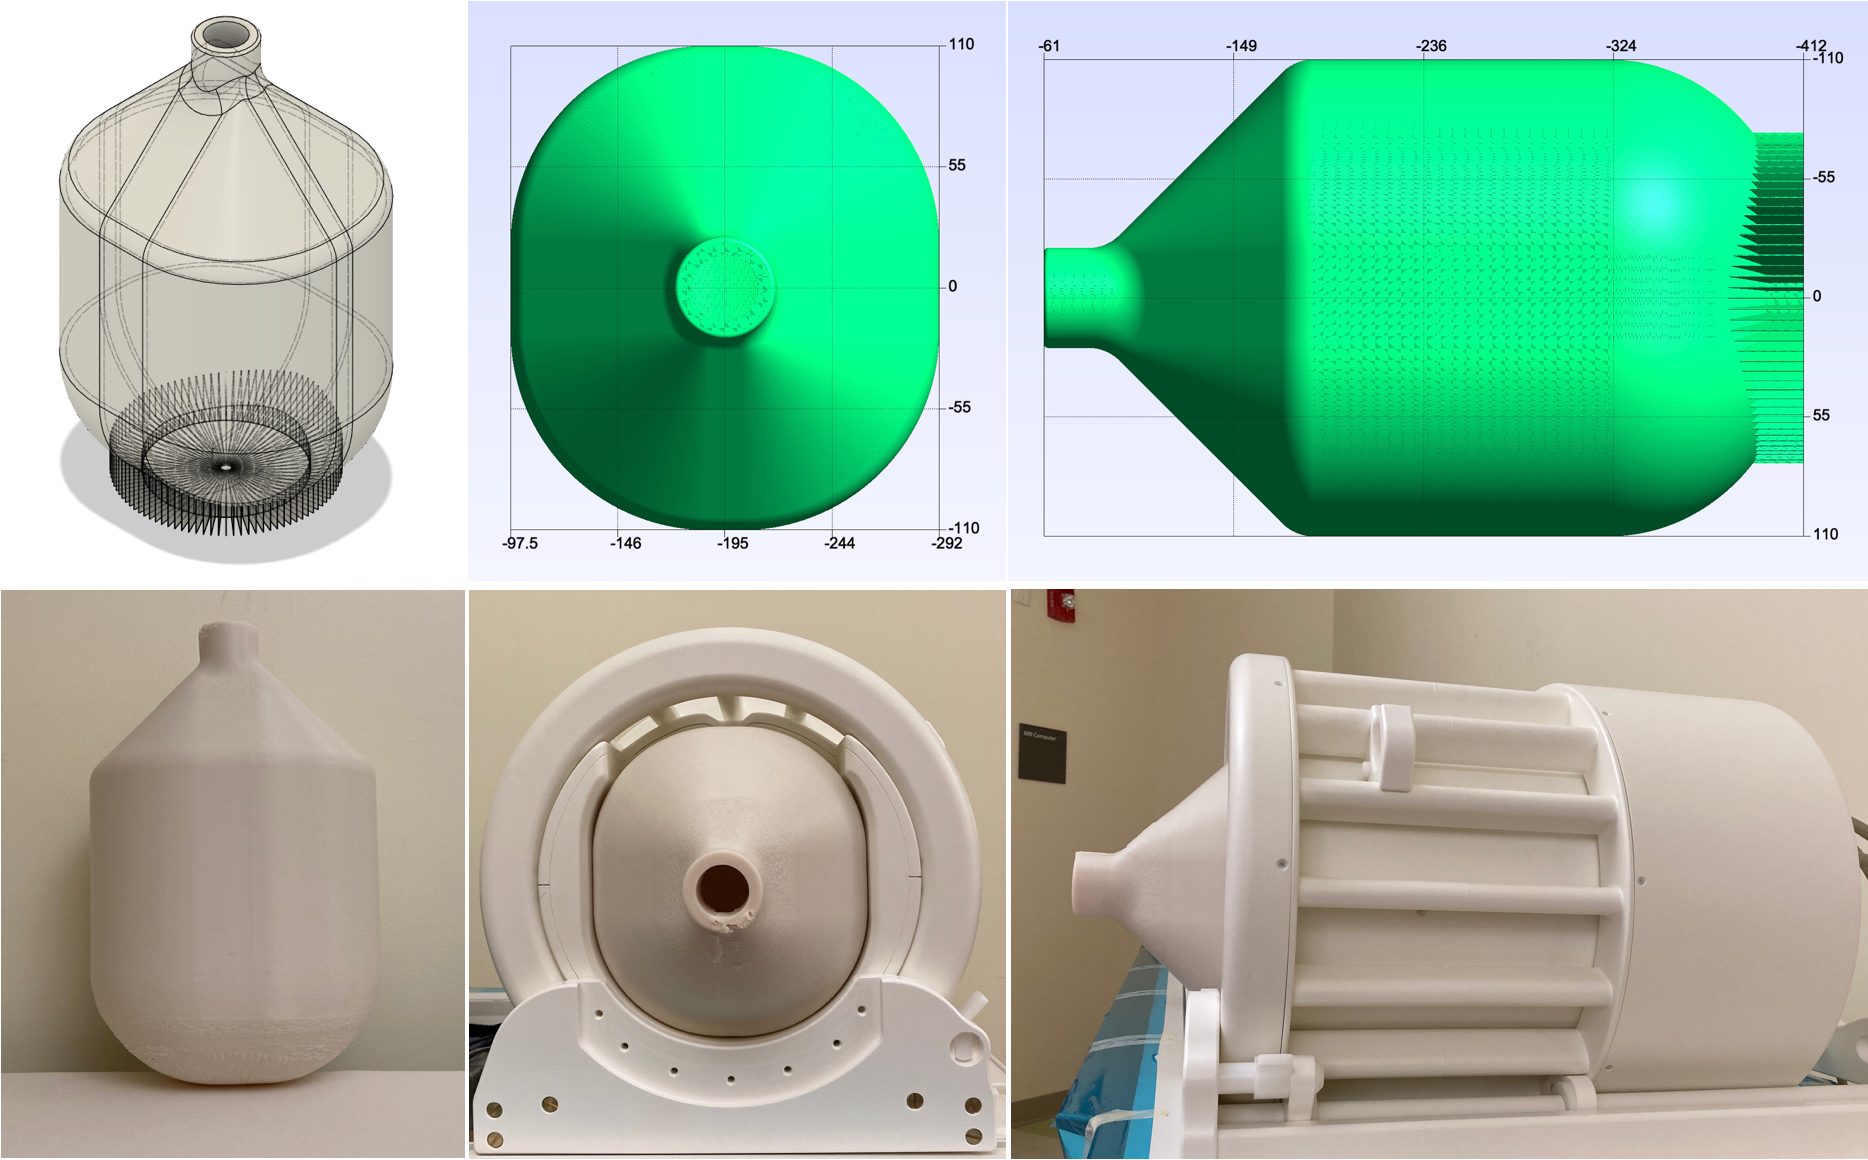
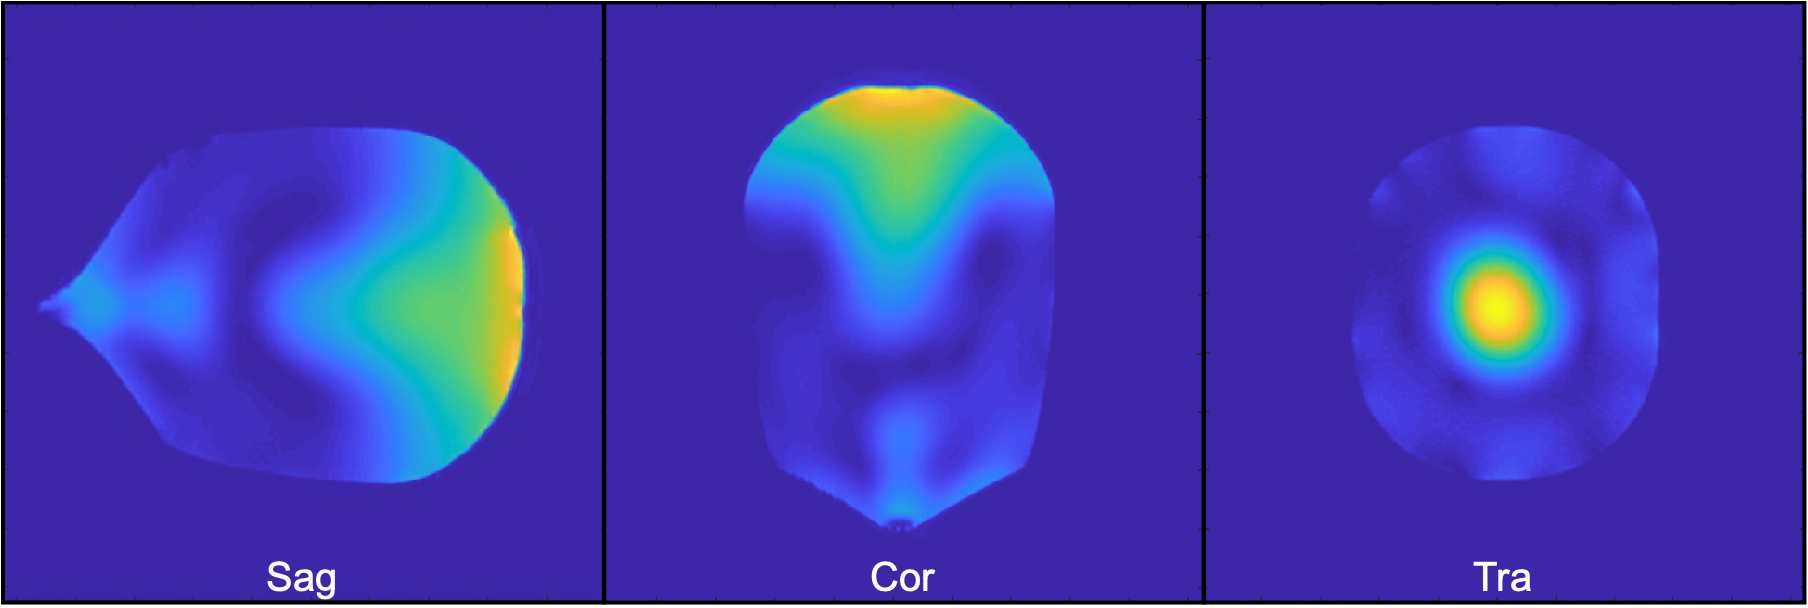
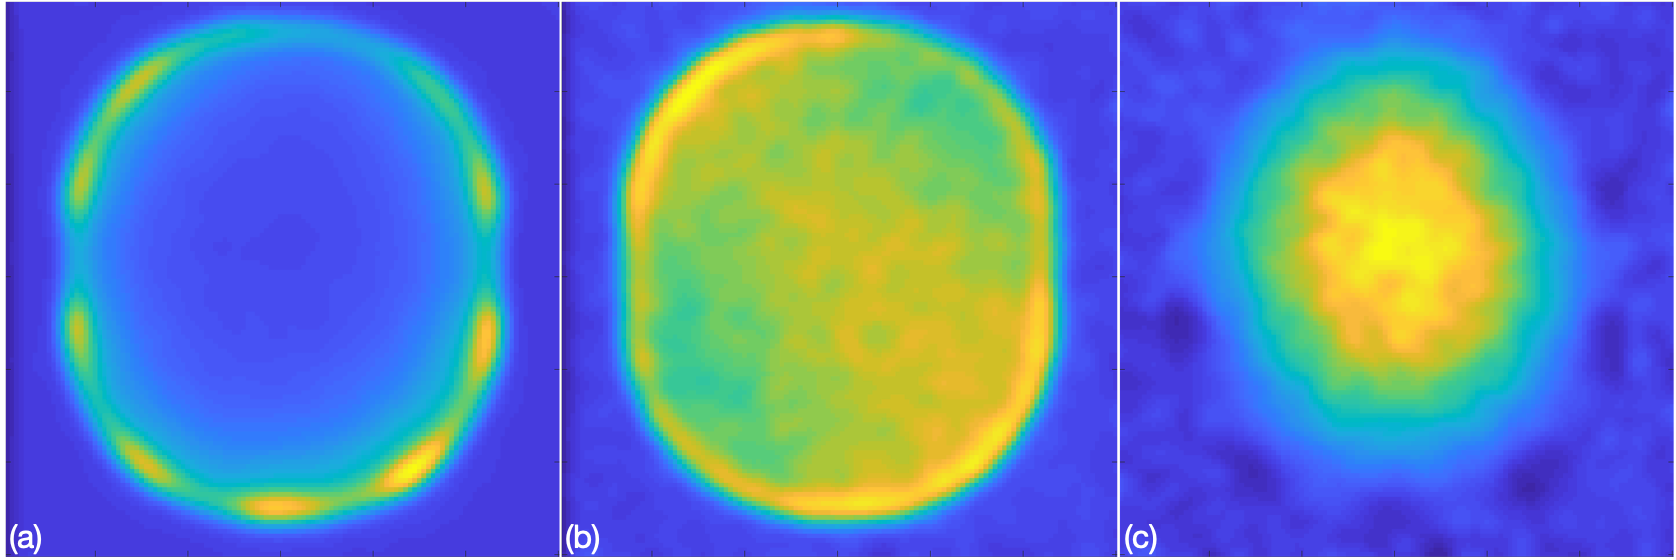
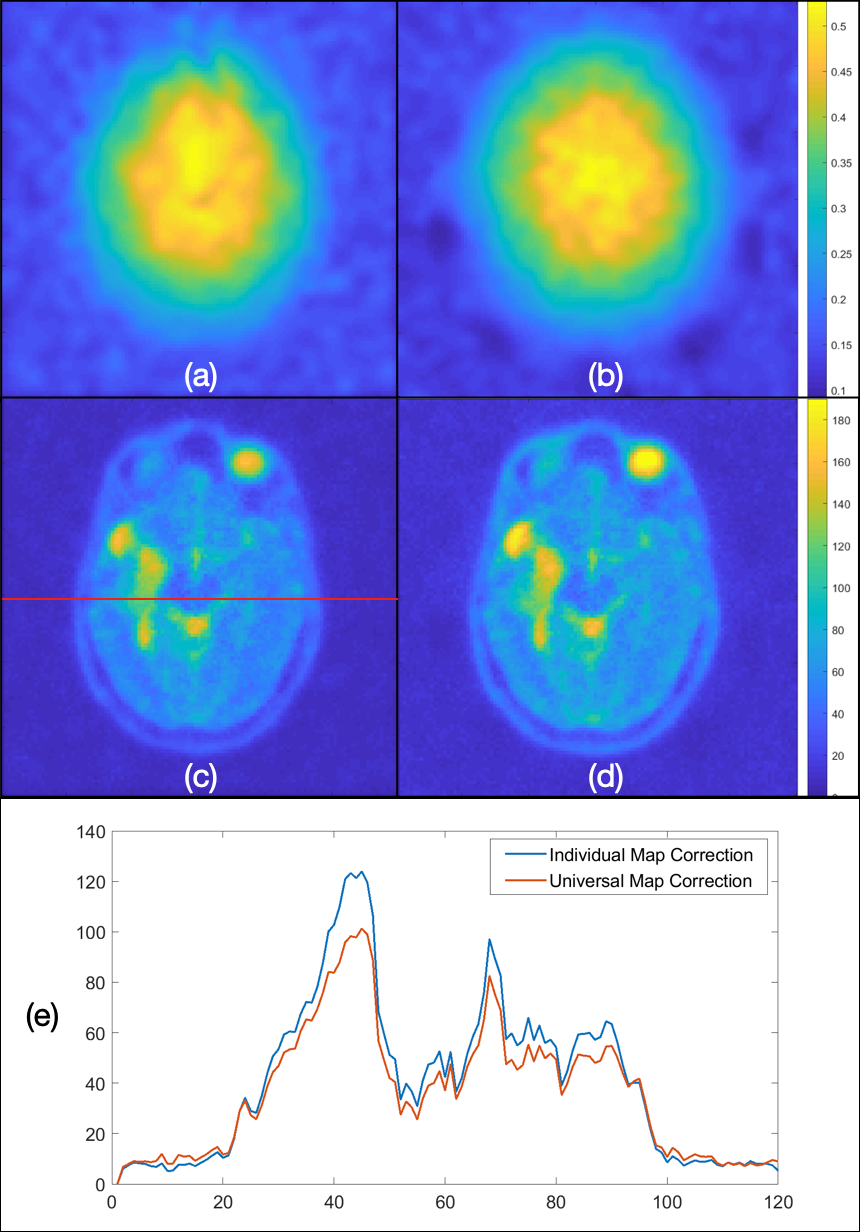
All images were acquired using a MAGNETOM Terra 7T MR system (Siemens Healthcare, Erlangen, Germany), a dual tuned (1H/23Na) birdcage head coil (RAPID Biomedical, Rimpar, Germany) with 32 additionally integrated receive-only array elements, and a Nova 32 channel receive coil for 7T (Nova Medical, Inc). Sodium images were acquired using an ultra-short echo time 3D sequence: TR/TE: 12.8 ms/0.27 ms, FA: 19, FOV: 240x240x240) with 3 mm iso-cubic voxel resolution. T2 SPACE sequence parameters: TI/TR/TE : 2.5 s / 9 ms / 0.3 ms, 0.7 mm isocubic voxel resolution). MR compatible phantom using acrylic styrene acrylonitrile was designed and constructed using a 9 L volume container with 4 mm thickness which covers the entire sodium coil inner volume (Fig.1). The phantom was filled with 80 mM NaCl solution and imaged (Fig. 2). From the low pass filtered (LPF) array (Fig. 3a) and birdcage coil image (Fig. 3b), we calculated the ‘1/Sensitivity’ map (Fig. 3c) to produce a 2mm iso-cubic voxel universal sensitivity maps. The individual sensitivity map was acquired from the patient array coil and birdcage coil images (Fig. 4a). The universal sensitivity map was calculated from the phantom images (Fig. 4b). ‘1/sensitivity’ maps were multiplied to the patient array coil image to obtain the uniformity corrected images (Fig. 4c,d).To compare and quantify the accuracy of the universal sensitivity map, we measured the correlation coefficient between the subjects’ sensitivity map and universal sensitivity map. All the centerline profiles (Redline position) of the iso-center slice of each subject were analyzed with the universal sensitivity map profile.
To obtain 2 mm isocubic voxel resolution uniformity corrected images, previous method4 required the same voxel resolution birdcage coil image with the array coil image to calculate the sensitivity map which required 20 minutes of scan time. Since uniformity correction process only requires LPF birdcage coil image, instead of using the 2 mm one, we used a linearly interpolated 4 mm iso-cubic voxel birdcage coil image to calculate the individual sensitivity map (Fig. 4a) which requires 2 min 30s only. Custom-built image analysis scripts using Matlab were used to perform analysis.
Results
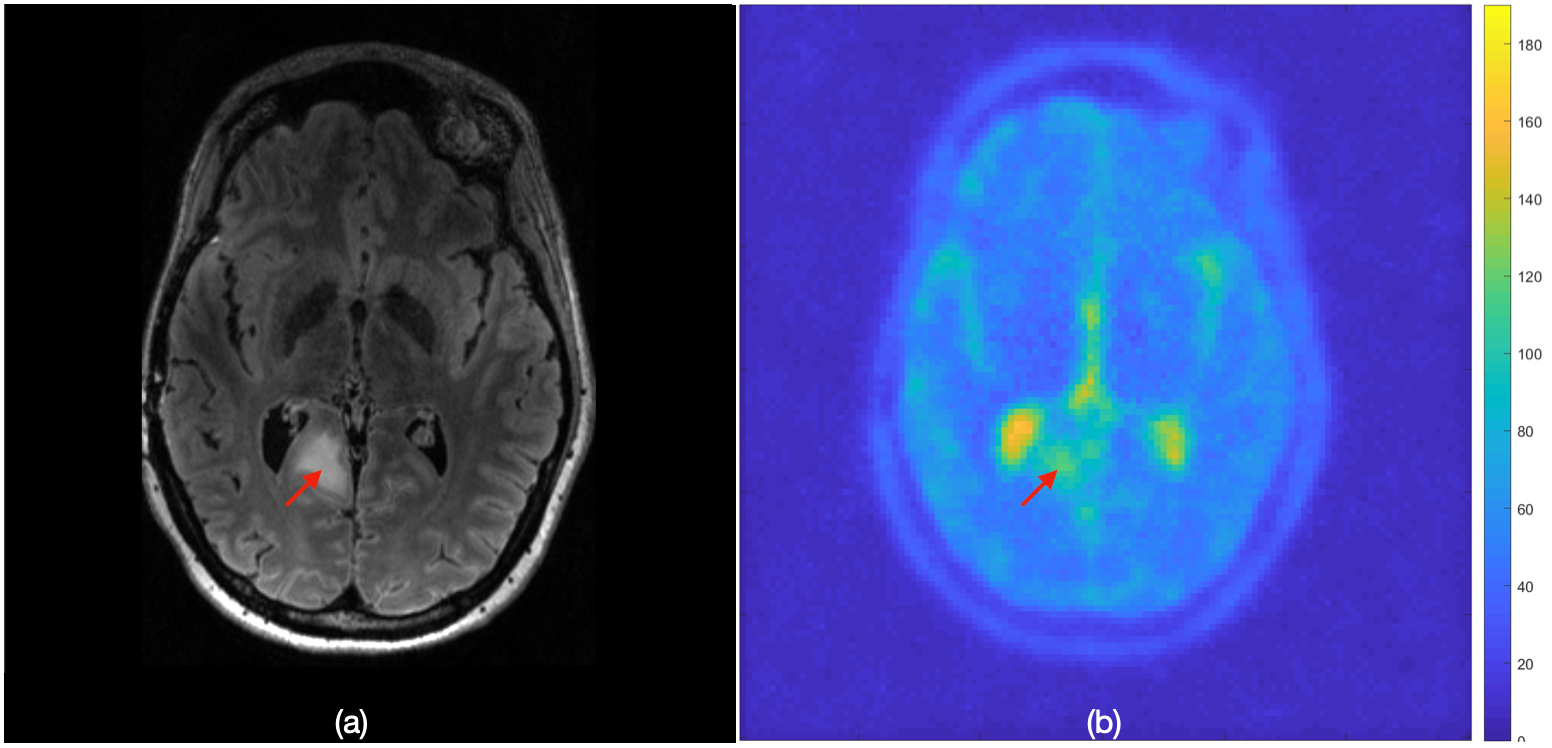
Theoretically, the sensitivity map comes from the array coil geometry. Since we used the same array coil for both the individual and universal sensitivity maps, they should share similar patterns. Our results confirm this finding (Fig. 4a,b). After the application of sensitivity maps, the images appear identical to one another. The cut profiles from the redline quantify these similarities (Fig. 4e).Using the pre-calculated Universal sensitivity map, we could obtain 2 mm iso-voxel resolution TSC map images in 9 min 30s. In anaplastic oligoastrocytoma patient tumor (Fig. 5 arrow), we could observe a 101.7 mM TSC value. In contralateral control normal tissue, it is about 66 mM (Fig. 5).
Data as acquired in both controls and patients with brain tumors and the corrected images using individual vs universal sensitivity maps were compared using correlation analysis to provide an r=0.993+ 0.003 demonstrating excellent correlation across both healthy and diseased brain.
Conclusions
We present 7T sodium coil dedicated universal map results using the 3D printed phantom in this work. Using the pre-calculated universal sensitivity map, we can omit birdcage coil scans. As a result, we can save total scan time by 50% and obtain a high-resolution 2 mm iso-cubic voxel TSC map within 10 min. There are certain situations in which scan time saving is more important than the image quality in a clinical setting. In those situations, a universal sensitivity map can be an alternative solution.Acknowledgements
“Training in Image Guidance, Precision Diagnosis and Therapy” NIH T32 Fellowship (T32 EB025823) in the Department of Radiology at Brigham and Women’s Hospital.References
1. Hussain et al. Sodium imaging intensity increases with time after human ischemic stroke. Ann Neurol 2009;66(1):55-62.
2. Schepkin VD. Sodium MRI of glioma in animal models at ultrahigh magnetic fields. NMR Biomed 2016;29(2):175-186.
3. Huhn et al. Potential of Sodium MRI as a Biomarker for Neurodegeneration and Neuroinflammation in Multiple Sclerosis. Front Neurol 2019;10:84.
4. Leshner et al. Comparison of optimized intensity correction methods for 23Na MRI of the human brain using a 32-channel phased array coil at 7 Tesla. Z Med Phys. 30(2020):104-115
Figures