2088
Development of CEST MRI for the characterization of Alzheimer’s Disease1Radiology, University of Texas Southwestern Medical Center, Dallas, TX, United States, 2Advanced Imaging Research Center, University of Texas Southwestern Medical Center, Dallas, TX, United States, 3Neurology, University of Texas Southwestern Medical Center, Dallas, TX, United States, 4Philips Healthcare, Gainseville, GA, United States, 5Philips Research, Hamburg, Germany
Synopsis
Alzheimer’s Disease (AD) is the leading cause of dementia, afflicting over 5 million Americans and 45 million people worldwide. We are developing CEST protocol for the characterization of abnormal protein accumulation and pathological molecular changes in AD. Our results indicate increased CEST in all frequency ranges, with the maximum around 2ppm. While preliminary, this data demonstrates CEST MRI is capable of clear differentiation between patients with AD and healthy individuals.
Introduction
Alzheimer’s Disease (AD) is the leading cause of dementia, afflicting over 5 million Americans and 45 million worldwide(1). AD is defined biologically by the presence of neuritic plaques composed of amyloid-β (Aβ) peptides and dystrophic neurites, neurofibrillary tangles (NFTs) of hyperphosphorylated tau, and neuronal loss as formalized under the AT(N) research framework.(2) Thus, biomarkers that can assess these molecular changes in AD, particularly tau and Ab, will play a paramount role in not only disease diagnosis but also the development and clinical monitoring of new targeted therapies.Aβ and tau burden can be assessed using cerebrospinal fluid (CSF) sampling or by positron emission tomography (PET) with ligand-specific radiotracers, although the shortcomings of these methods limit widespread clinical use. Currently, MRI is used to rule out potentially treatable causes of impaired cognitive function, such as hydrocephalus, evaluate brain atrophy, and the presence of cerebrovascular disease burden. However, atrophy represents a relatively late manifestation of AD, lagging behind molecular changes.(3)
Chemical Exchange Saturation Transfer (CEST) has emerged as a promising MRI technique to detect low concentration chemical species with exchangeable protons, which are not visible using standard MRI methods. This allows correlation of imaging-derived indices with metabolite and protein concentration and/or state. Studies have demonstrated the sensitivity of CEST to protein state, including conformation and folding structure, in vitro(4) as well as in vivo(5). A few recent works predominantly using Amide Proton Transfer (APT, 3.5ppm) MRI in animal models and individuals with dementia have shown promising results.(6-11). Our study aims to develop and apply CEST for the characterization of abnormal protein accumulation and other molecular changes in AD. We are interrogating the full Z-spectrum and aiming for a maximum brain coverage, to identify frequencies (and potential molecular targets) and spatial regional differences most correlative with cognitive function decline. Here we demonstrate our preliminary findings.
Methods
9 cognitively impaired patients (1 mild cognitive impairment [MCI] and 8 AD) and 3 cognitively normal (NC) age-matched individuals were recruited as part of this pilot study. Written informed consent was obtained from each participant under an IRB-approved protocol. MR imaging was performed using a whole body 3T (Ingenia, Philips Healthcare) with a 32-channel head coil. CEST images were acquired using a 2D multi-slice T1-weighted gradient echo (GRE) sequence with 3-point multi-echo Dixon with repetition time (TR)/echo time (TE1)/ΔTE = 5.1-5.4/1.57/1.0 ms. The CEST RF saturation train consisted of 40 Sinc-Gauss shaped 9000 flip units, with a duration 49.5 msec each (B1rms=1.17mT), for a total saturation length of 2 sec, enabled by alternating parallel transmission. The Z-spectrum was acquired in the range ±6 ppm with 23 points. Other imaging parameters: single shot GRE readout; slice thickness = 5 mm, 2x2 mm in-plane acquired resolution, 0.5x0.5mm reconstructed in-plane resolution, scan time ~ 12.0 min for the full Z-spectrum and reference image acquisition. Custom Matlab routines were used to calculate the full range (±6 ppm) Z-spectra on a voxel-by-voxel basis, as well as MTRasym at three offset frequencies: 1ppm, 2ppm and 3.5ppm.Results
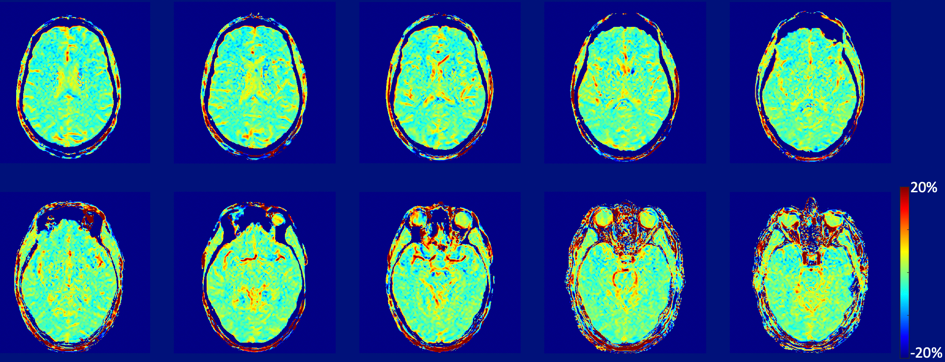
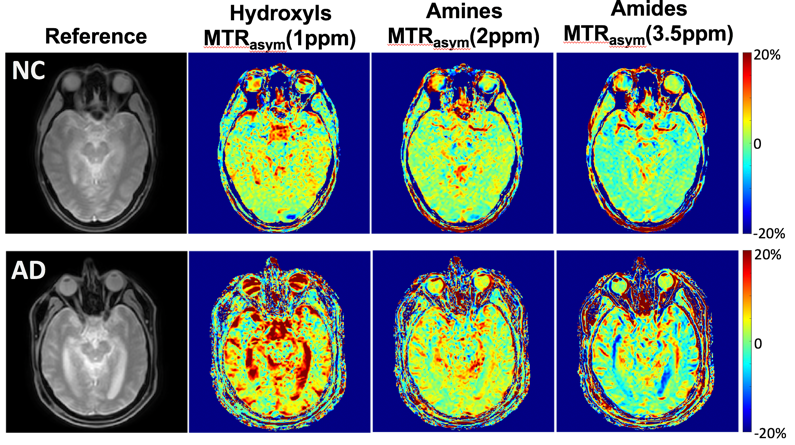
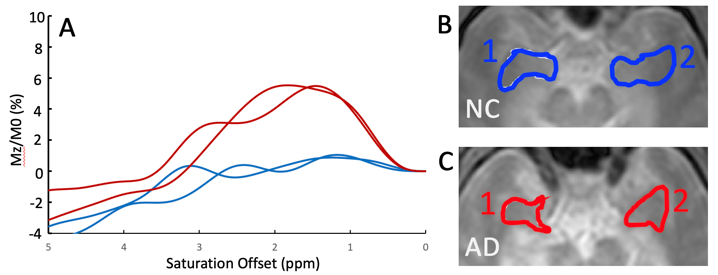
Figure 1 demonstrates an MTRasym(3.5ppm) maps of a NC brain. Figure 2 compares MTRasym maps at three ranges discussed above between a NC subject and a matched AD patient, while Figure 3 demonstrates ROI-averaged Z-spectra within the medial temporal lobes (amygdala, entorhinal cortex, and hippocampal head). Substantial increases in the CEST signal, as expressed by MTRasym is observed in AD subject compared to CN in Figure 3. In the ROI analysis, increase in CEST signal in the AD patient is greatest around 2ppm, but is noticeable at other frequencies including 1ppm and 3.5ppm.Discussion
Our early results indicate increased CEST signatures in all frequency ranges in several brain regions in people having AD compared to CN. While consistent with previous APT results, the largest difference is observed around 2ppm. The changes may be associated with pathologic protein aggregation, but other molecular changes associated with AD may also contribute. Indeed, at least one study, utilized gluCEST to monitor glutamate changes in mice model of AD(12). Additional studies are needed to elucidate the origins of the changes observed with CEST and to determine the exact molecular alterations responsible. Currently, the region-specific analysis through the whole brain is underway as well as multi-peak fitting for Z-spectrum analysis. While preliminary, these data demonstrate CEST MRI is capable of clear differentiation between patients with AD and CN individuals.Conclusion
Our findings demonstrate differentiation between CN and AD groups. The results point to the potential role of CEST imaging as a non-invasive imaging biomarker for disease-related changes in AD. Additional larger scale clinical trials are needed for validation.Acknowledgements
The work is supported in part by the Texas Alzheimer's Research & Care Consortium Junior Investigator Grant and NIH R01CA252281 Grant.References
1. C. R. Jack et al., Transition rates between amyloid and neurodegeneration biomarker states and to dementia: a population-based, longitudinal cohort study. Lancet Neurol 15, 56-64 (2016).
2. C. R. Jack, Jr. et al., NIA-AA Research Framework: Toward a biological definition of Alzheimer's disease.
3. G. B. Frisoni, N. C. Fox, C. R. Jack, P. Scheltens, P. M. Thompson, The clinical use of structural MRI in Alzheimer disease. Nat Rev Neurol 6, 67-77 (2010).
4. D. L. Longo et al., Chemical exchange saturation transfer (CEST): an efficient tool for detecting molecular information on proteins' behaviour. Analyst 139, 2687-2690 (2014).
5. Y. Zhu et al., Non-invasive imaging of disrupted protein homeostasis induced by proteasome inhibitor treatment using chemical exchange saturation transfer MRI. Scientific Reports 8, 15068 (2018).
6. J. A. Wells et al., In vivo imaging of tau pathology using multi-parametric quantitative MRI. Neuroimage 111, 369-378 (2015).
7. H. E. Holmes et al., Imaging the accumulation and suppression of tau pathology using multiparametric MRI. Neurobiol Aging 39, 184-194 (2016).
8. L. Chen et al., Protein aggregation linked to Alzheimer's disease revealed by saturation transfer MRI. NeuroImage 188, 380-390 (2019).
9. G. H. Jahng, W. Choi, J. J. Chung, S. T. Kim, H. Y. Rhee, Mapping Exchangeable Protons to Monitor Protein Alterations in the Brain of an Alzheimer's Disease Mouse Model by Using MRI.
10. D. Tolomeo et al., Chemical exchange saturation transfer MRI shows low cerebral 2-deoxy-D-glucose uptake in a model of Alzheimer’s Disease. Scientific Reports 8, 9576 (2018).
11. Z. Zhang et al., Protein-based amide proton transfer-weighted MR imaging of amnestic mild cognitive impairment. NeuroImage: Clinical 25, 102153 (2020).
12. H. Igarashi et al., Longitudinal GluCEST MRI Changes and Cerebral Blood Flow in 5xFAD Mice. Contrast Media & Molecular Imaging 2020, 8831936 (2020).
Figures