2087
Intracellular Acidification Monitored by Chemical Exchange Saturation Transfer MRI: Effect of Cariporide in Rat C6 Brain Tumor1Medical Biophysics, Western Univeristy-Robarts Reserch Institute, London, ON, Canada, 2Western Univeristy-Robarts Reserch Institute, London, ON, Canada
Synopsis
Our objective was to acidify rat C6 gliomas by inhibiting NHE1 with cariporide and to monitor the pH changes with AACID-CEST MRI. AACID-CEST MRI was successfully used to monitor changes in tumor pHi over time after cariporide injection. Our results showed a pH decrease in both the tumor and the contralateral tissue following cariporide injection. CEST-MRI measurement of tumor response pH could help to enhance the efficacy of this treatment paradigm in different human malignancies.
Introduction
Cellular pH is highly controlled in multicellular organisms. In malignant tissues, there is an inversion of the normal pH scheme, where the intracellular compartment becomes slightly more alkaline while the extracellular space becomes strongly acidic.1-5 Na+/H+ exchanger isoform 1 (NHE1) is an acid-extruding membrane transport protein that has been directly linked to pH regulation. Tumor acidification is a recognized therapeutic strategy and could be achieved by blocking the NHE1 transporter trapping protons inside cells and consequently decreasing intracellular pH (pHi). Cariporide inhibits NHE1 and could modify tumor intracellular pH. This drug has only been clinically tested in cardiovascular prevention but never in cancer.6-10 We have previously shown that cariporide can selectively acidify U87MG gliomas in mice.11 However further studies are needed to examine the effect of cariporide on different tumor models. Chemical exchange saturation transfer (CEST) MRI contrast is sensitive to tissue pHi.13-16 A CEST-MRI technique called amine and amide concentration-independent detection (AACID) was previously developed as an indicator of tissue pH. AACID utilizes the ratio of endogenous amine and amide protons to measure the pH.16,17 The AACID value is inversely related to the tissue pH and heavily weighted to the intracellular compartment. It has been reported that the C6 tumor resembles human glioma better than other glioma models.12 The goal of this study was to track changes in the tumor intracellular pH over time to determine whether cariporide can selectively acidify rat C6 glioblastoma following cariporide injection. We hypothesized that blockage of NHE1 by cariporide would selectively acidify this aggressive and invasive tumor model as observed in U87MG tumors.Methods
106 C6 glioma cells in a 2µL suspension were manually injected into the right frontal lobe of 8-week-old male Wistar rats. MR imaging was performed on a 9.4 T small-animal scanner with a Bruker console. A 6-channel receive-only phased array coil was used in combination with a 2-channel transmit coil for data acquisition.18 The rats were placed on a custom-built stage securing their heads using a bite and ear bars to limit respiratory motion. To evaluate the effect of cariporide on the tumor pHi, six rats received an intraperitoneal injection of cariporide (dose: 6 mg/kg in 2 ml) two weeks after tumor implantation. Three CEST images were acquired at baseline. Animals then received the drug inside the scanner and eight CEST images were acquired during the following 160 minutes. CEST images were acquired for the slice of interest using a fast-spin-echo pulse sequence with parameters: TR= 7s, TE= 25ms, preceded by a continuous wave RF saturation pulse with an amplitude of 1.5μT and 4s duration. CEST images were acquired at saturation frequencies from 1.2 to 6.6 ppm (total acquisition time= 20 min). AACID values were measured on a pixel-by-pixel basis. The CEST spectrum from each pixel in the image was analyzed using custom software in MATLAB to generate parametric maps.16 A paired t-test was performed to measure differences in AACID values between tumor and contralateral regions following the drug injection.Results
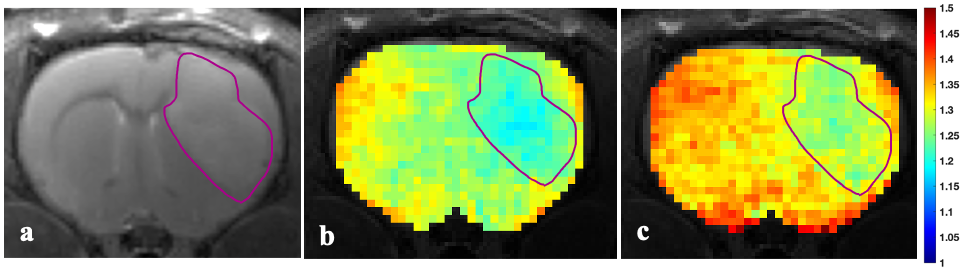
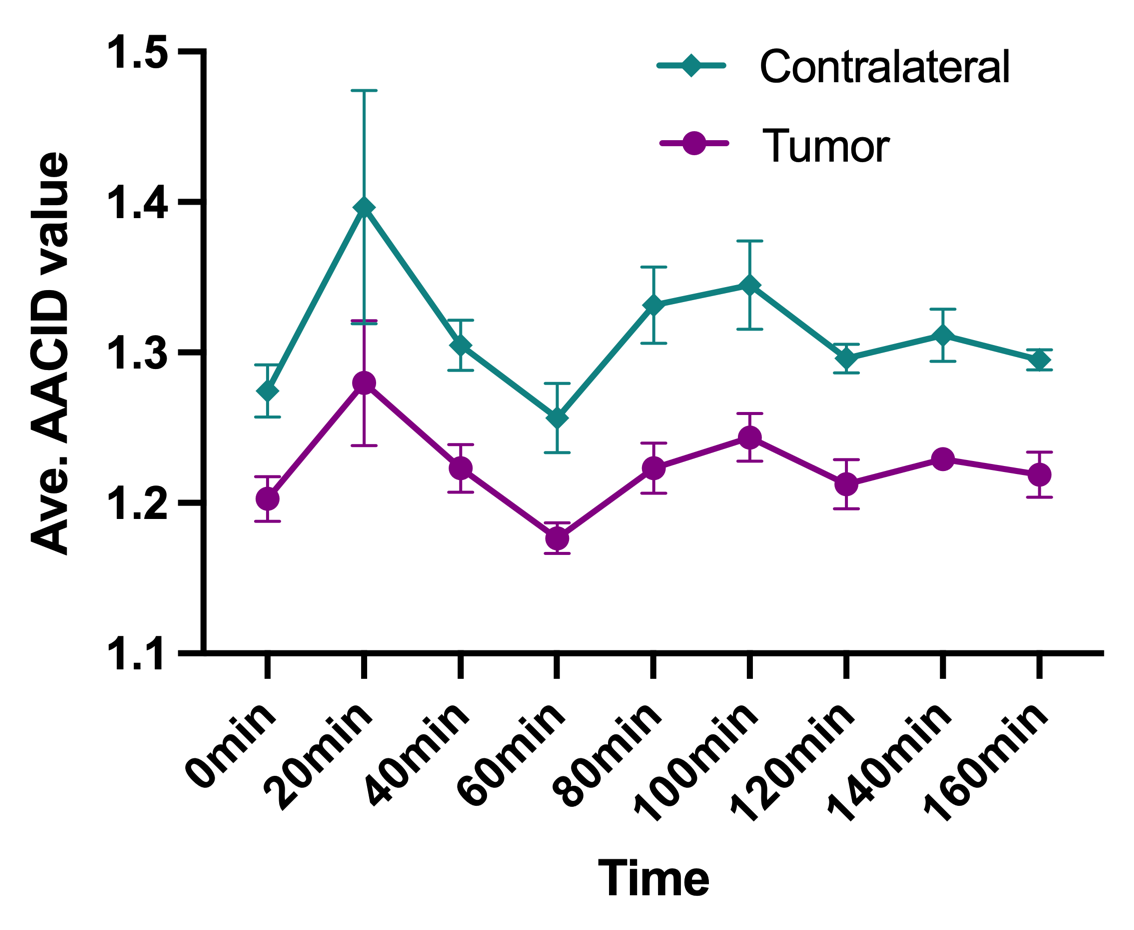
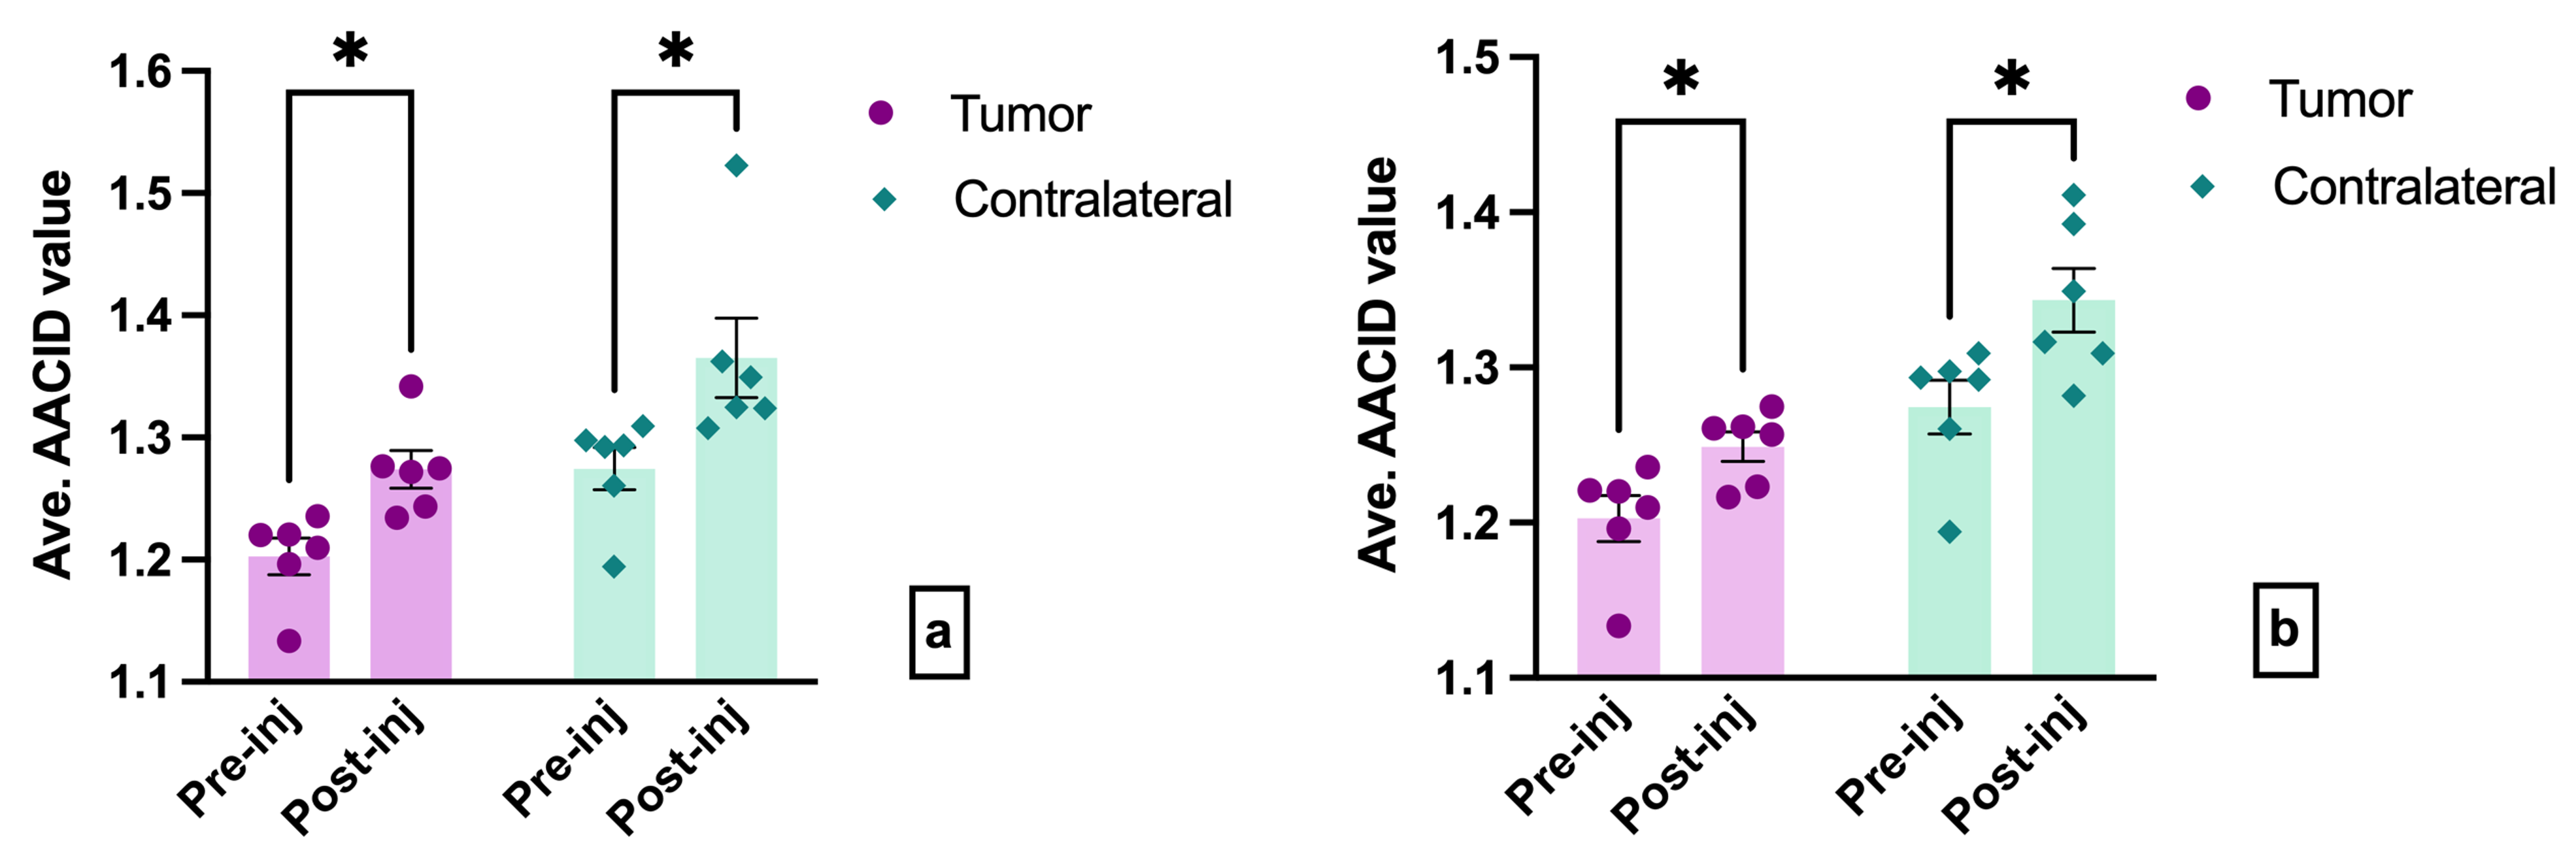
Figure 1 shows the AACID maps obtained for a representative experimental rat superimposed on an anatomical image, before and after injection of cariporide. The three pre-injection CEST spectra were summed to increase the signal-to-noise ratio (the first data point in Fig. 2). Figure 2 shows the average AACID value in the tumor and contralateral regions over time. Twenty minutes after drug injection (the second data point in Fig. 2), the average AACID value in the tumor increased and reached the first maximum. The average AACID value then declined to a minimum about an hour after the injection. A second increase in the average AACID value occurred at hundred minutes after which the average AACID value decreased again. The average AACID value in the contralateral tissue followed the same trend. At the first maximum, the average AACID value in tumor post-injection was 5.9% higher compared to pre-injection, corresponding to a 0.28 lower pHi (Fig. 3-a). However, at the second maximum, the AACID value in tumor post-injection was 3.8% higher compared to pre-injection, corresponding to a 0.18 lower pHi (Fig. 3-b).Discussion and Conclusion
Before drug injection, our results were in line with the expected difference in the pHi between tumor and contralateral tissue in the rat C6 glioma model specifically, a higher pHi within the tumor. Surprisingly, we did not observe selective tumor acidification following injection as had previously been observed in the mouse U87MG glioma model.11 Instead, acidification occurred in the tumor and in the contralateral tissue. The reason for this discrepancy may be related to differences in tumor vasculature compared to the U87MG model that may have limited the ability of cariporide to infiltrate the tumor.19 The C6 glioma model is more aggressive and proliferating than U87MG.12 Thus, the bulk effect of the tumor on day 14 could also have impacted contralateral tissue pH and the uptake of cariporide.20 This study further demonstrates the value of CEST-based pH-weighted imaging in monitoring the response of tumors to treatment and optimizing their acidification paradigms. Future work will examine the effect of cariporide on healthy brain tissues in the rat and evaluation of methods to increase the temporal stability of the AACID measurement.Acknowledgements
No acknowledgement found.References
1. Swietach P. What is pH regulation and why do cancer cells need it. Cancer and Metastasis Review 2019; 38(1):5-15.
2. Boedtkjer E, Bunch L, Pedersen SF. Physiology, pharmacology and pathophysiology of the pH regulatory transport proteins NHE1 and NBCn1: similarities, differences, and implications for cancer therapy. Curr Pharm Des. 2012; 18(10):1345-71.
3. Webb BA, Chimenti M, Jacobson MP, Barber DL. Dysregulated pH: a perfect storm for cancer progression. Nat Rev Cancer. 2011; 11(9):671-7.
4. Gerweck LE, Seetharaman K. Cellular pH gradient in tumour versus normal tissue: potential exploitation for the treatment of cancer. Cancer Res. 1996; 56(6):1194-8.
5. Srivastava J, Barber DL, Jacobson MP. Intracellular pH sensors: design principles and functional significance. Physiology (Bethesda). 2007; 22:30-9
6. Harguindey, S., Arranz, J.L., Polo Orozco, J.D. et al. Cariporide and other new and powerful NHE1 inhibitors as potentially selective anticancer drugs – an integral molecular/biochemical/metabolic/clinical approach after one hundred years of cancer research. J Transl Med 2013; 11(282):1-17.
7. Guan, X., Hasan, M.N., Begum, G. et al. Blockade of Na/H exchanger stimulates glioma tumor immunogenicity and enhances combinatorial TMZ and anti-PD-1 therapy. Cell Death and Disease 2018; 9(1010):1-16.
8. Stock C, Pedersen SF. Roles of pH and the Na+/H+ exchanger NHE1 in cancer: From cell biology and animal models to an emerging translational perspective? Semin Cancer Biol. 2017; 43:5-16.
9. J. Reshkin, Stephan; A. Cardone, Rosa; Harguindey, Salvador. Na+-H+ Exchanger, pH Regulation and Cancer. Recent Patents on Anti-Cancer Drug Discovery 2013; 8(1):85-99.
10. Loo SY, Chang MK, Chua CS, Kumar AP, Pervaiz S, Clement MV. NHE-1: a promising target for novel anti-cancer therapeutics. Curr Pharm Des. 2012; 18(10):1372-82.
11. Albatany M, Li A, Meakin S, Bartha R. In vivo detection of acute intracellular acidification in glioblastoma multiforme following a single dose of cariporide. Int J Clin Oncol. 2018; 23(5):812-819.
12. Giakoumettis D, Kritis A, Foroglou N. C6 cell line: the gold standard in glioma research. Hippokratia. 2018;22(3):105-112.
13. Ward KM, Balaban RS. Determination of pH using water protons and chemical exchange dependent saturation transfer (CEST). Magn Reson Med. 2000; 44(5):799-802.
14. Jinyuan Zhou, Peter C.M. van Zijl, Chemical exchange saturation transfer imaging and spectroscopy, Progress in Nuclear Magnetic Resonance Spectroscopy 2006; 48(2-3): 109-136.
15. Terreno E, Castelli DD Aime S. Encoding the frequency dependence in MRI contrast media: the emerging class of CEST agents. Contrast Media Mol Imaging. 2010; 5(2):78-98.
16. McVicar N, Li AX, Gonçalves DF, Bellyou M, Meakin SO, Prado MA, Bartha R. Quantitative tissue pH measurement during cerebral ischemia using amine and amide concentration-independent detection (AACID) with MRI. J Cereb Blood Flow Metab. 2014; 34(4):690-8.
17. McVicar N, Li AX, Meakin SO, Bartha R. Imaging chemical exchange saturation transfer (CEST) effects following tumor-selective acidification using lonidamine. NMR Biomed. 2015; 28(5):566-75.
18. Gilbert et. al., Journal of Neuroscience Methods, 2019, 312: 65-72.
19. Stocchetti N, Maas AI. Traumatic intracranial hypertension. N Engl J Med. 2014; 370:2121-2130.
20. Doblas S, He T, Saunders D, Pearson J, Hoyle J, Smith N, Lerner M, Towner RA. Glioma morphology and tumor-induced vascular alterations revealed in seven rodent glioma models by in vivo magnetic resonance imaging and angiography. J Magn Reson Imaging. 2010; 32(2):267-75.
Figures