2085
Quantitative 3D Mapping of Cr and PCr Concentrations at 3T using Snapshot AREX CEST MRI1Athinoula A. Martinos Center for Biomedical Imaging, Department of Radiology, Massachusetts General Hospital and Harvard Medical School, Charlestown, MA, United States, 2Cardiovascular Research Center, Cardiology Division, Massachusetts General Hospital, Charlestown, MA, United States, 3Magnetic Resonance Center, Max Planck Institute for Biological Cybernetics, Tübingen, Germany, 4Department of Biomedical Magnetic Resonance, University of Tübingen, Tübingen, Germany, 5Department of Neuroradiology, Friedrich-Alexander Universität Erlangen-Nürnberg (FAU), University Hospital Erlangen, Erlangen, Germany, 6Health Science Technology, Harvard-MIT, Cambridge, MA, United States
Synopsis
The dynamics of creatine and phosphocreatine distributions provide an important means for assessing metabolic function. While CEST-weighted MRI allows for the imaging of metabolite alterations, it is affected by semisolid-MT, spillover, and T1 contributions, and is typically analyzed on a two-dimensional image, given the inherently long acquisition times. Here, we performed 3D quantitative mapping of Cr and PCr concentrations in the human calf muscle at 3T, using a rapid snapshot-CEST protocol followed by apparent exchange-dependent relaxation (AREX) analysis. Significant (p<0.001) changes in the concentrations of both creatine and phosphocreatine were measured during exercise, in agreement with the literature.
Introduction
Alterations in creatine (Cr) metabolism may serve as an early biomarker of metabolic disease1, neurodegenerative disorders, cardiovascular disease, and muscle pathologies. The ability to image the conversion of phosphocreatine (PCr) to Cr in-vivo has been extensively studied in recent years, as it holds the key for non-invasive and early molecular-level evaluation of disease state. While 1H and 31P MR spectroscopy were widely used for that purpose, they suffer from low resolution and slow acquisition times. Chemical exchange saturation transfer (CEST) imaging of the exchangeable guanidinium protons at ~1.9 ppm, and ~2.6 ppm have been demonstrated as an alternative approach for observing the signals associated with Cr and PCr, respectively2,3.Nevertheless, CEST-weighted imaging is prone to confounding contributions stemming from direct water saturation, semisolid MT contributions, and water relaxation, which may bias the interpretation of the imaged phenomena, particularly during exercise/longitudinal studies of pathology, where several molecular components may be altered. Hence, a fully quantitative CEST approach that provides a concentration map of the metabolite of interest is clearly favorable. Three-dimensional imaging is also a highly sought-after ability for Cr imaging in the muscle as it allows for efficient motion correction and the detection of non-uniform metabolite distribution along the muscle, as manifested in a variety of pathologies4.
Progress was recently made in addressing the above challenges, including the quantitative 2D imaging of PCr using neural networks at 3T5, quantitative 2D Cr mapping at 7T using the apparent exchange-dependent relaxation (AREX) approach6, and the 3D CEST-weighted imaging of Cr at 7T4.
The purpose of this work was to create a single imaging pipeline that combines “the best of all worlds” and allows for quantitative imaging of both Cr and PCr concentrations in three-dimensions and at a clinical 3T field strength.
Methods
Data AcquisitionImaging was performed on a 3T clinical scanner (Siemens Prisma) using a dedicated leg coil. Two volunteers were imaged after written informed consent and IRB approval. Three-dimensional (3D) CEST data was acquired using a modified Snapshot-CEST methodology,7 with a train of spin-lock saturation pulses and a fast centric-reordered 3D-EPI readout. The resolution was set to 2.5 mm isotropic, and the field of view (FOV) to 122.5 x 130 x 150 mm3, TE=11 ms, FA=15, TR=14s. A train of 18 saturation pulses (DC=75%, 300 ms on) was applied and baseline Z-spectra were acquired with saturation pulse powers of 0.6 µT (to amplify the slow exchanging PCr contribution), 1.75 µT (to amplify the fast exchanging Cr contribution), and 1.1 µT (for B1 correction). The saturation frequency offsets spanned the ranges of ±4 ppm or ± 2.5 ppm for PCr and Cr scans, respectively, with 0.2 ppm increments. WASABI and saturation recovery scans were applied using the same readout, for obtaining B0, B1, and T1 maps.
Next, an in-magnet planar flexion exercise was performed in which the volunteer performed press-release of a 16 lb weight at 1Hz rate for 90s, followed by a 3.5-min hold, and 3.5-min recovery. Post-exercise imaging commenced immediately after exercise as the volunteer entered the recovery phase, using a partial Z-spectrum acquisition with 0.2 ppm increments around the ± frequency offset of interest (1.9 or 2.6 ppm). The exercise and imaging were repeated twice for imaging PCr and Cr.
Metabolite Concentration Quantification
The acquired Z-spectra were B0 and B19 corrected using the WASABI images. AREX maps were calculated using the spillover-free inverse-metric of the Z-spectra, corrected for T1 effects using the T1 maps obtained via exponential fitting. AREX values were converted to Cr concentrations using the calibration parameter available in ref6. Phosphocreatine concentration maps were similarly obtained, after calculating the appropriate conversion constant from a separately imaged PCr phantom (Fig. 1). A 3D ROI of 5171 voxels was used for quantifying the metabolites concentration and a two-tailed t-test was used for assessing statistical significance.
Results
Twenty (out of 49 slices) representative PCr concentration maps, obtained at baseline from a human volunteer calf muscle, are shown in Fig. 2. Similarly acquired Cr concentration maps from different views and orientations are available in Fig. 3. Notice the mild variations in PCr/Cr distributions across different spatial locations. The pre- and post-exercise maps of Cr and PCr concentrations for 4 representative slices are shown in Fig. 4. Note the clear decrease in PCr concentration (from 24.63±26.84 mM to 11.44±22.25 mM) and the simultaneous increase in Cr concentration (from 28.65±20.15 mM to 45.05±24.67 mM), as expected. Despite the large standard deviations observed, likely stemming from the large ROI that encompassed various muscle groups, the change in both metabolites was statistically significant (p<0.001, two-tailed t-test, Fig. 5). The resulting quantitative concentrations of PCr and Cr, before and after exercise were in good agreement with previous reports4,5,6.Conclusion
The combination of the 3D Snapshot CEST acquisition with the AREX-based metabolite concentration mapping provides a useful means for quantitative imaging of both PCr and Cr dynamics in-vivo.Acknowledgements
National Institutes of Health Grant/Award Numbers: R01CA203873, P41-RR14075. This project has received funding from the European Union’s Horizon 2020 research and innovation programme under the Marie Skłodowska-Curie grant agreement No. 836752 (OncoViroMRI). This paper reflects only the author’s view, and the European Research Executive Agency is not responsible for any use that may be made of the information it contains.References
1) Kazak, L. and Cohen, P., 2020. Creatine metabolism: energy homeostasis, immunity and cancer biology. Nature Reviews Endocrinology, 16(8), pp.421-436.
2) Haris, M., Singh, A., Cai, K., Kogan, F., McGarvey, J., DeBrosse, C., Zsido, G.A., Witschey, W.R., Koomalsingh, K., Pilla, J.J. and Chirinos, J.A., 2014. A technique for in vivo mapping of myocardial creatine kinase metabolism. Nature medicine, 20(2), pp.209-214.
3) Chung, J.J., Jin, T., Lee, J.H. and Kim, S.G., 2019. Chemical exchange saturation transfer imaging of phosphocreatine in the muscle. Magnetic Resonance in Medicine, 81(6), pp.3476-3487.
4) Kumar, D., Nanga, R.P.R., Thakuri, D., Wilson, N., Cember, A., Martin, M.L., Zhu, D., Shinohara, R.T., Qin, Q., Hariharan, H. and Reddy, R., 2021. Recovery kinetics of creatine in mild plantar flexion exercise using 3D creatine CEST imaging at 7 Tesla. Magnetic Resonance in Medicine, 85(2), pp.802-817.
5) Chen, L., Schär, M., Chan, K.W., Huang, J., Wei, Z., Lu, H., Qin, Q., Weiss, R.G., van Zijl, P.C. and Xu, J., 2020. In vivo imaging of phosphocreatine with artificial neural networks. Nature Communications, 11(1), pp.1-10.
6) Rerich, E., Zaiss, M., Korzowski, A., Ladd, M.E. and Bachert, P., 2015. Relaxation‐compensated CEST‐MRI at 7 T for mapping of creatine content and pH–preliminary application in human muscle tissue in vivo. NMR in Biomedicine, 28(11), pp.1402-1412.
7) Herz, K., Mueller, S., Perlman, O., Stirnberg, R., Stoecker, T., Scheffler, K., Farrar, C. and Zaiss, M., 2020, August. Towards clinical CEST-MRF: whole brain snapshot CEST MR Fingerprinting at 3T using spin-lock saturation and a centric 3D-EPI readout. In 2020 ISMRM & SMRT Virtual Conference & Exhibition (p. 216).
8) Schuenke, P., Windschuh, J., Roeloffs, V., Ladd, M.E., Bachert, P. and Zaiss, M., 2017. Simultaneous mapping of water shift and B1 (WASABI)—application to field‐inhomogeneity correction of CEST MRI data. Magnetic resonance in medicine, 77(2), pp.571-580.
9) Windschuh, J., Zaiss, M., Meissner, J.E., Paech, D., Radbruch, A., Ladd, M.E. and Bachert, P., 2015. Correction of B1‐inhomogeneities for relaxation‐compensated CEST imaging at 7 T. NMR in biomedicine, 28(5), pp.529-537.
Figures
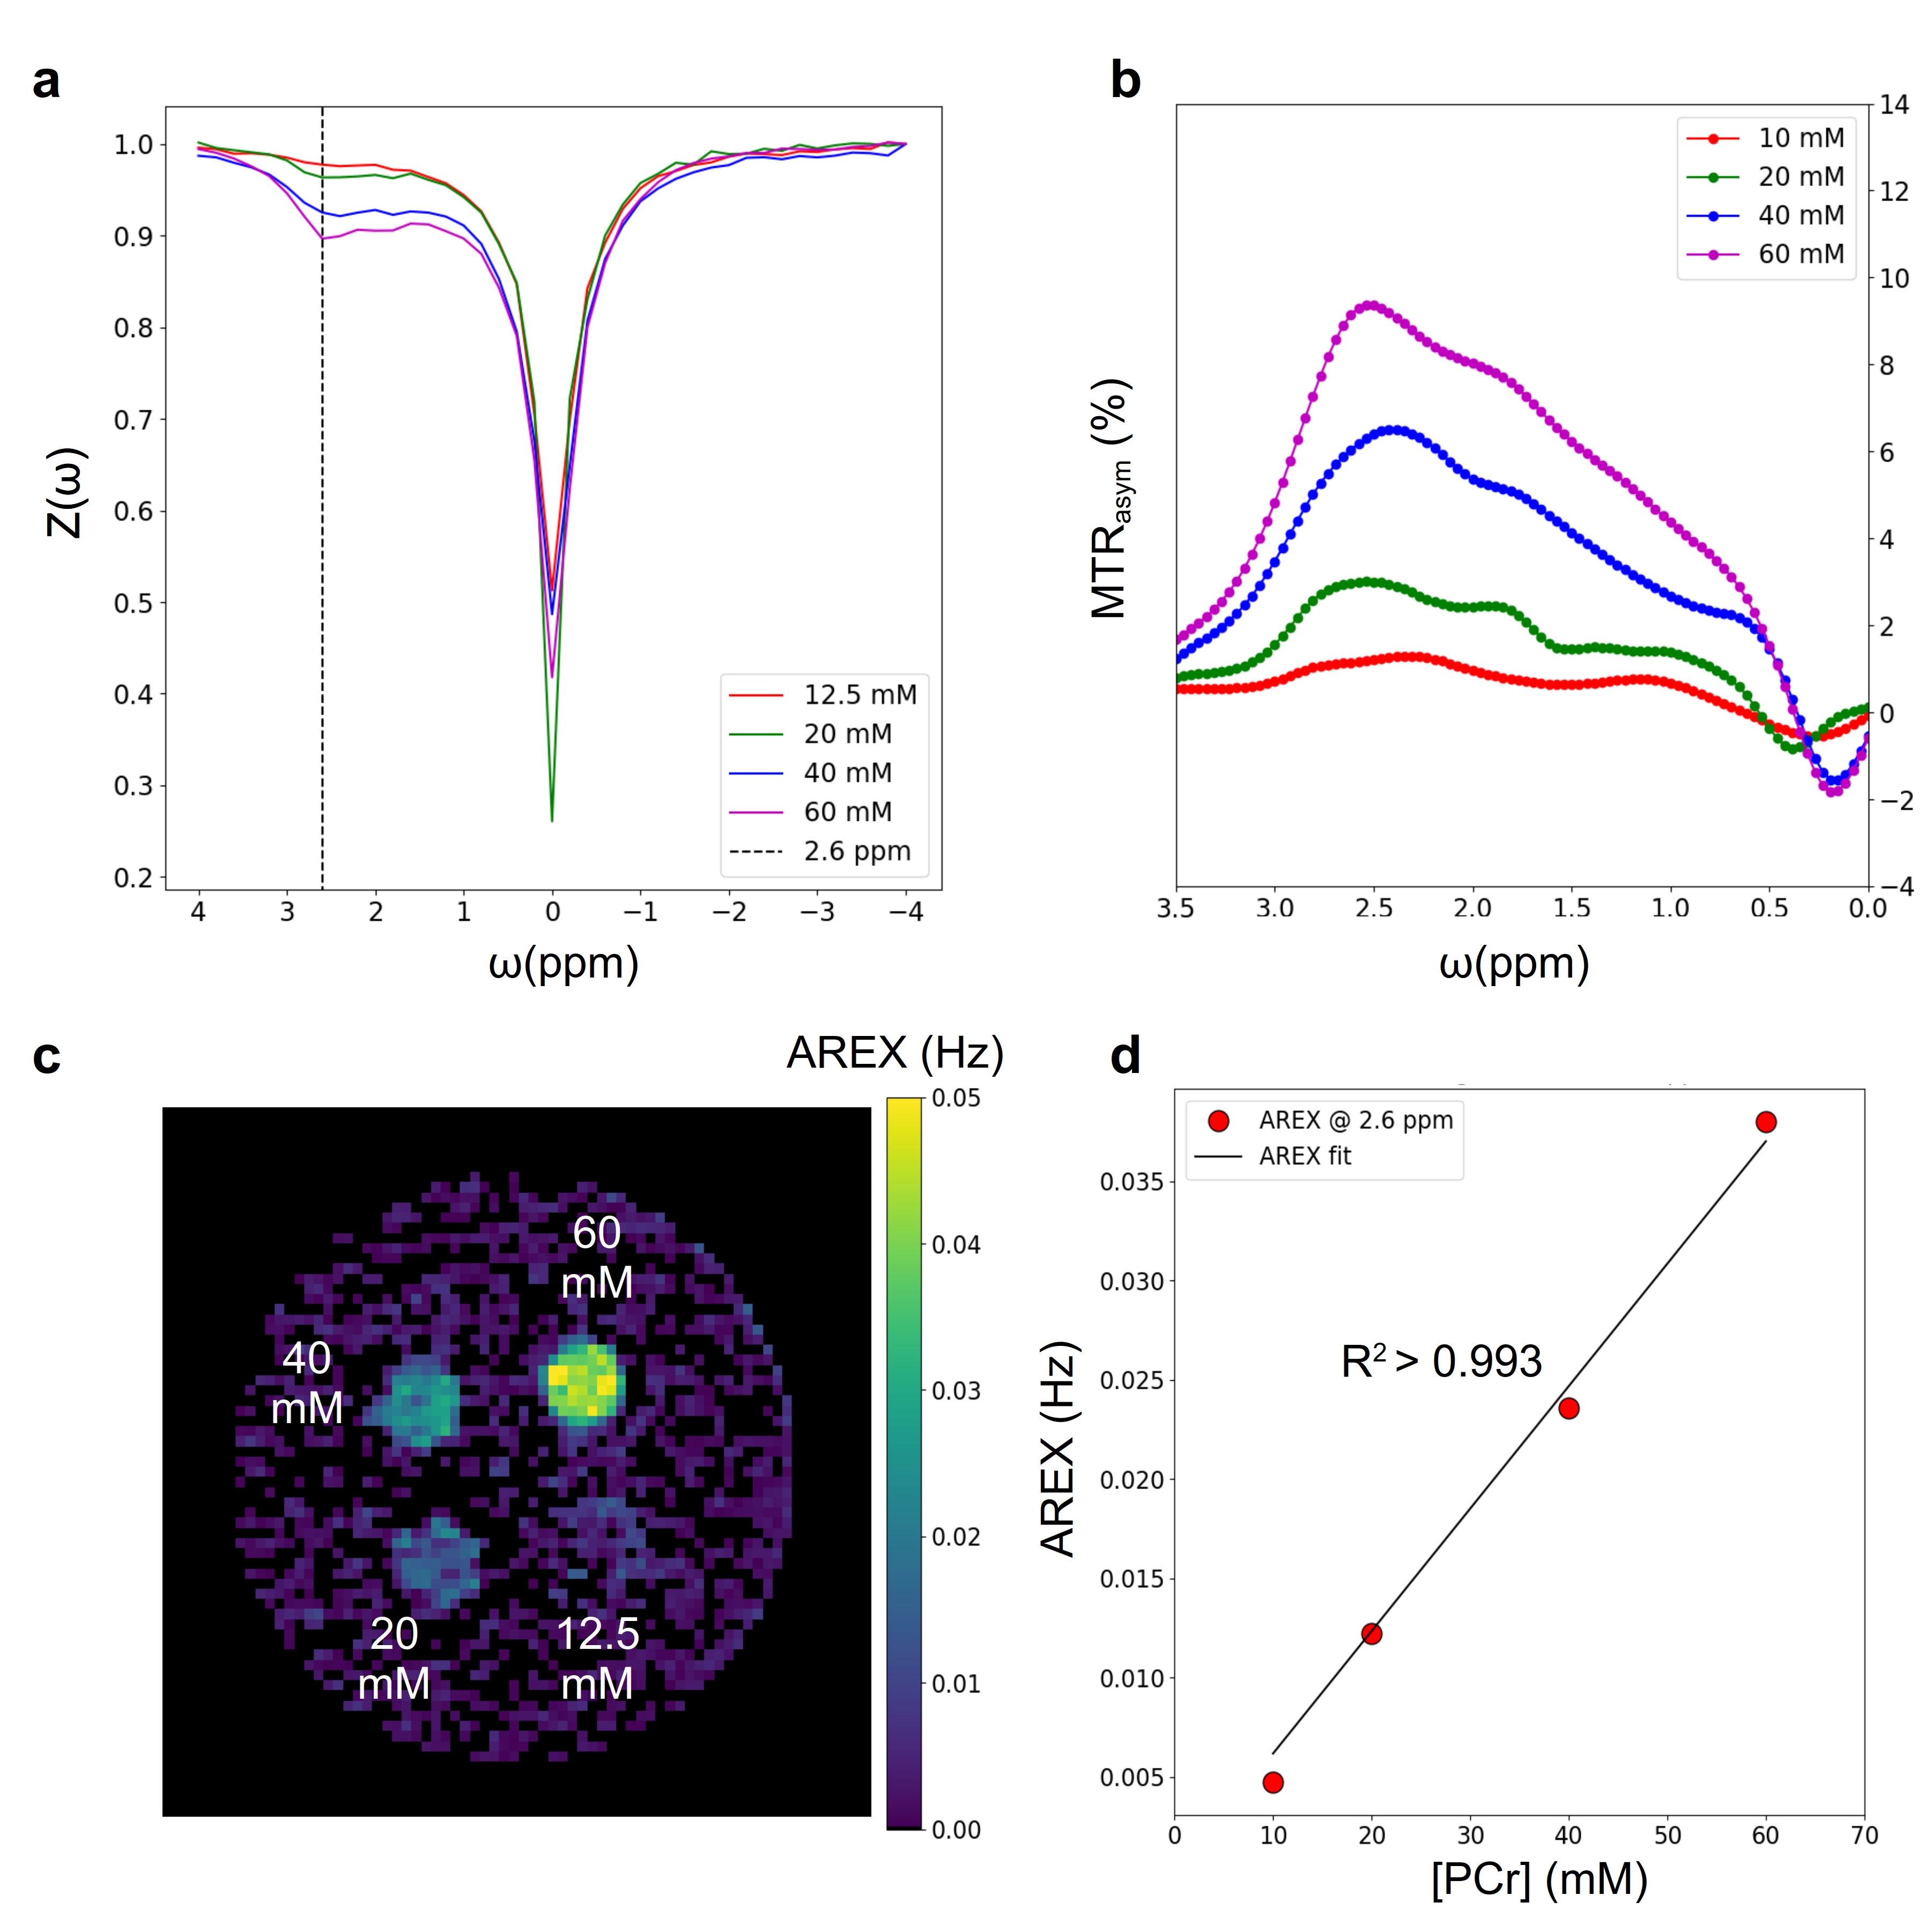
Fig. 1. In-vitro study and AREX calibration. a-b. Z-spectra and MTRasym respectively, of a phantom containing 4 vials of PCr with different concentrations (c). d. The calculated average AREX values for each vial were used for estimating a constant for converting AREX contrast into PCr concentration.
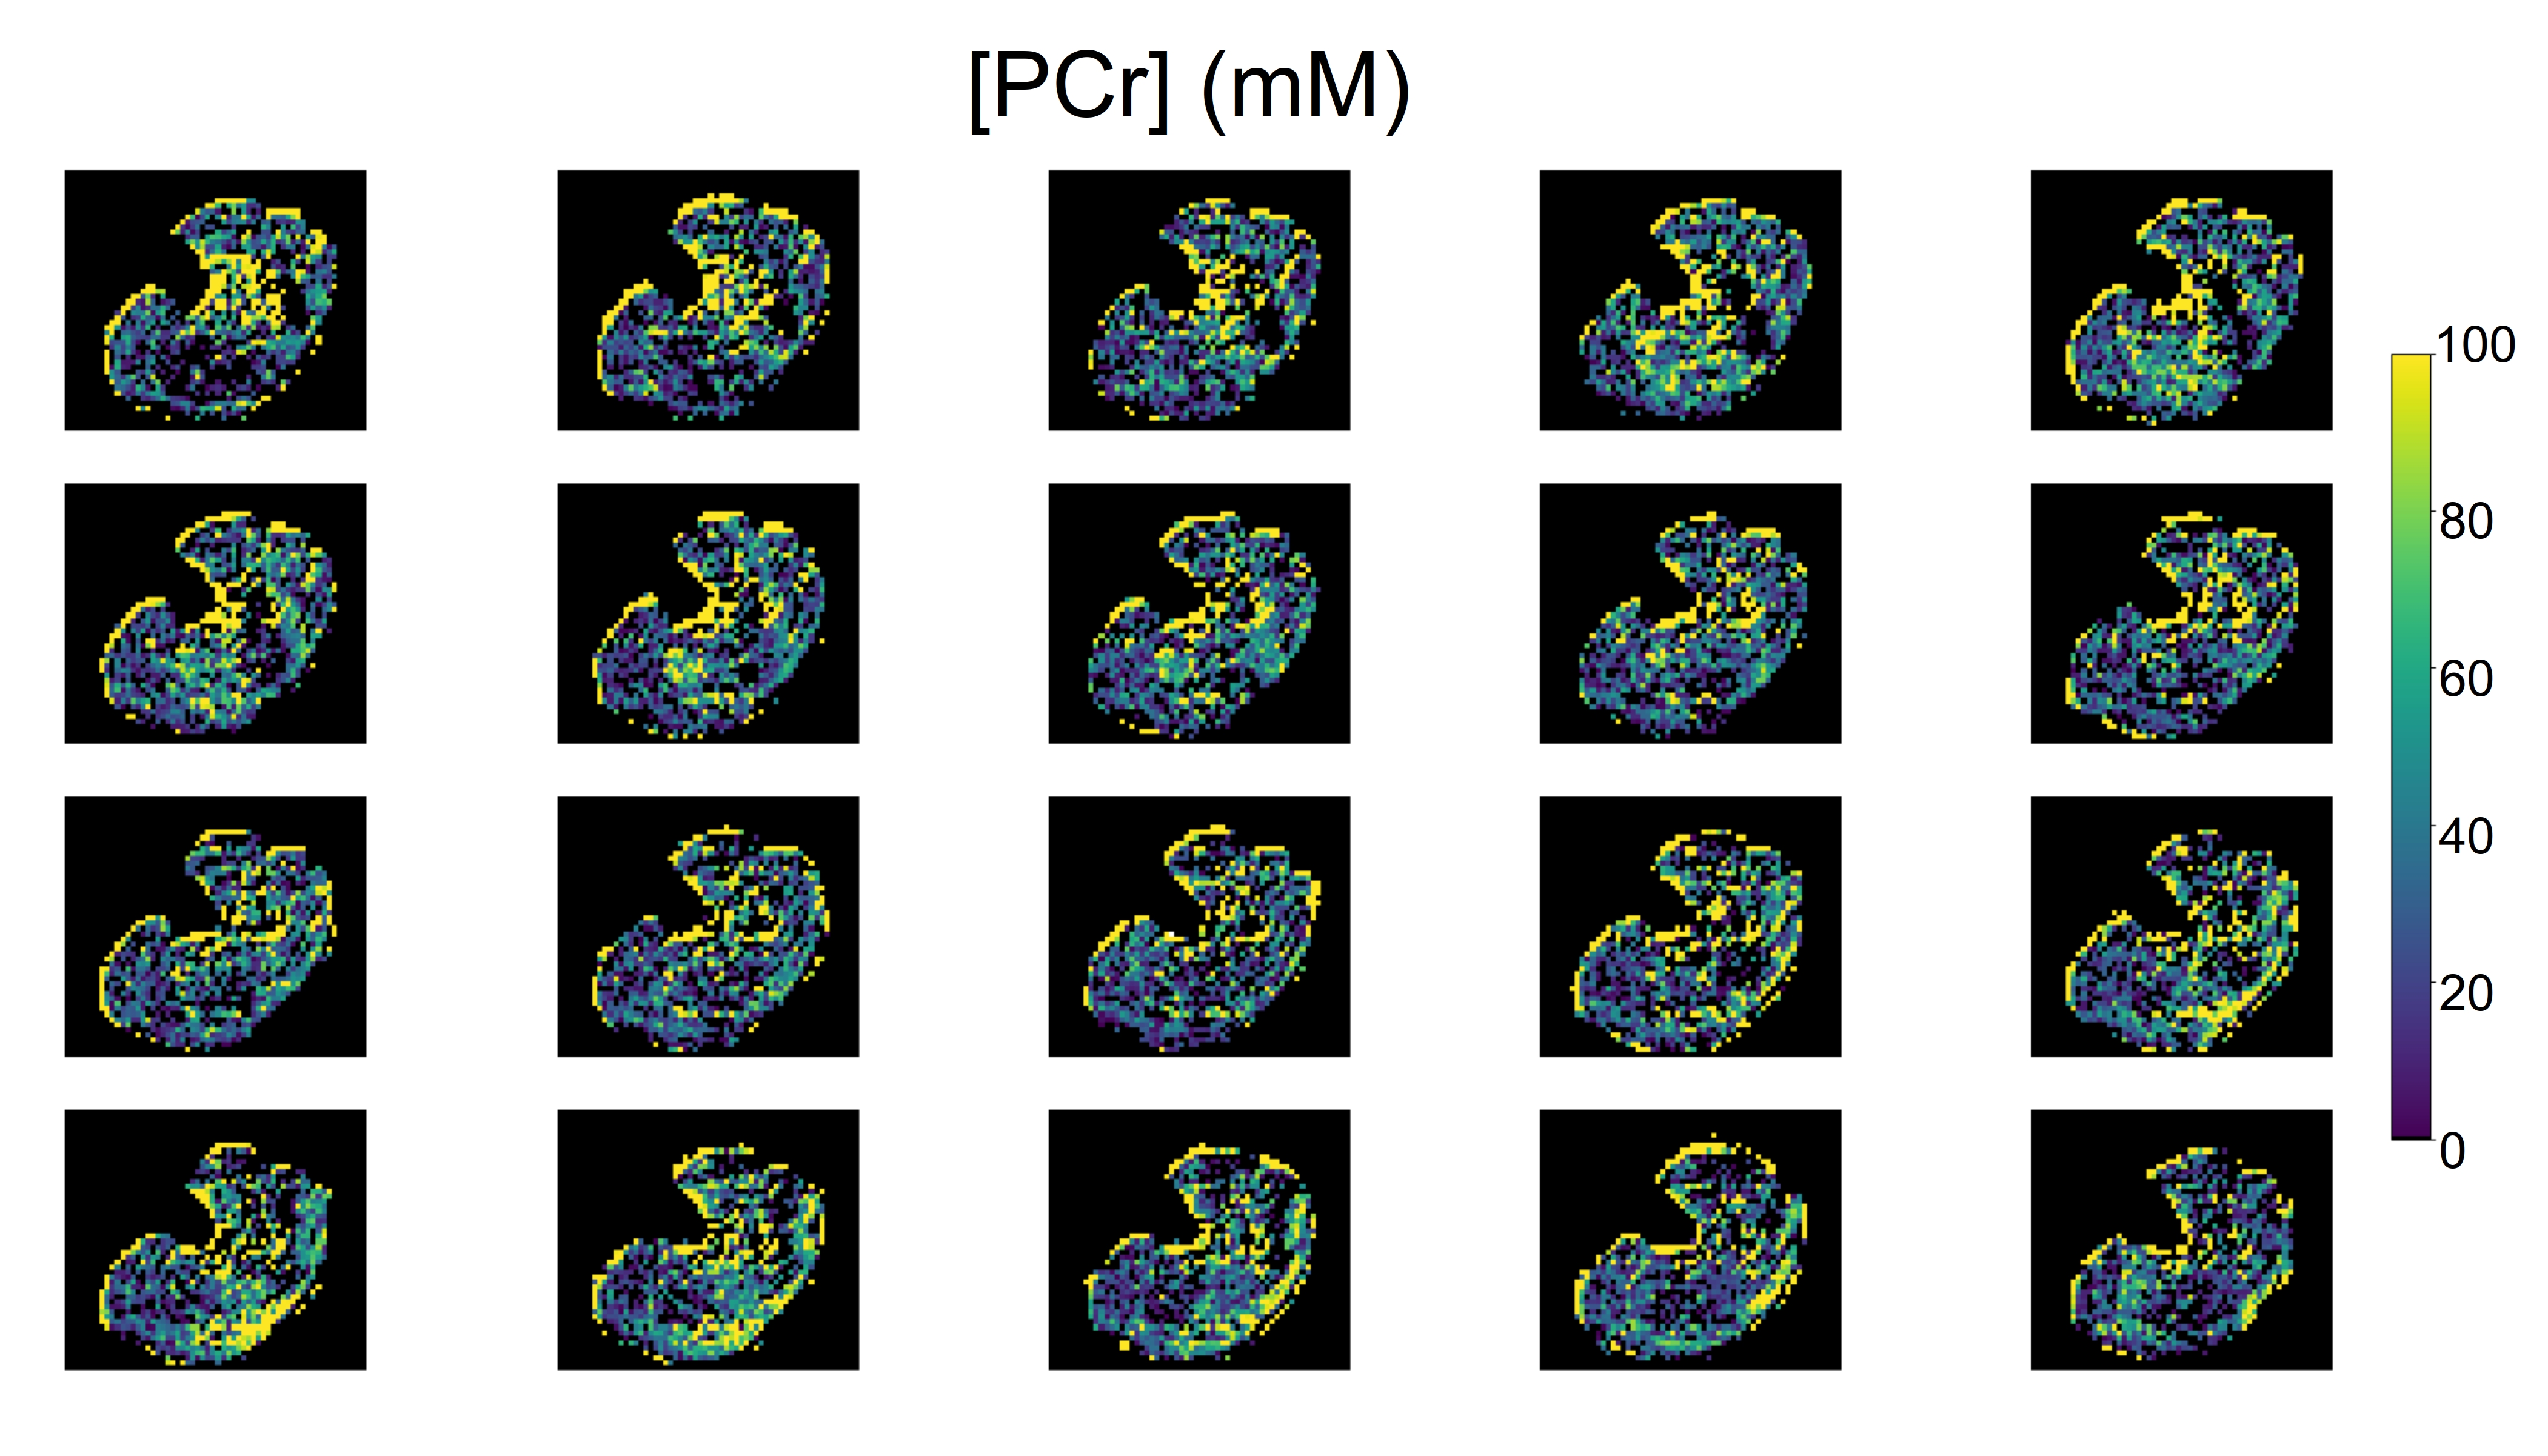
Fig. 2. Multi-slice axial PCr concentration mapping of the human calf muscle using a 3D Snapshot CEST AREX imaging protocol.
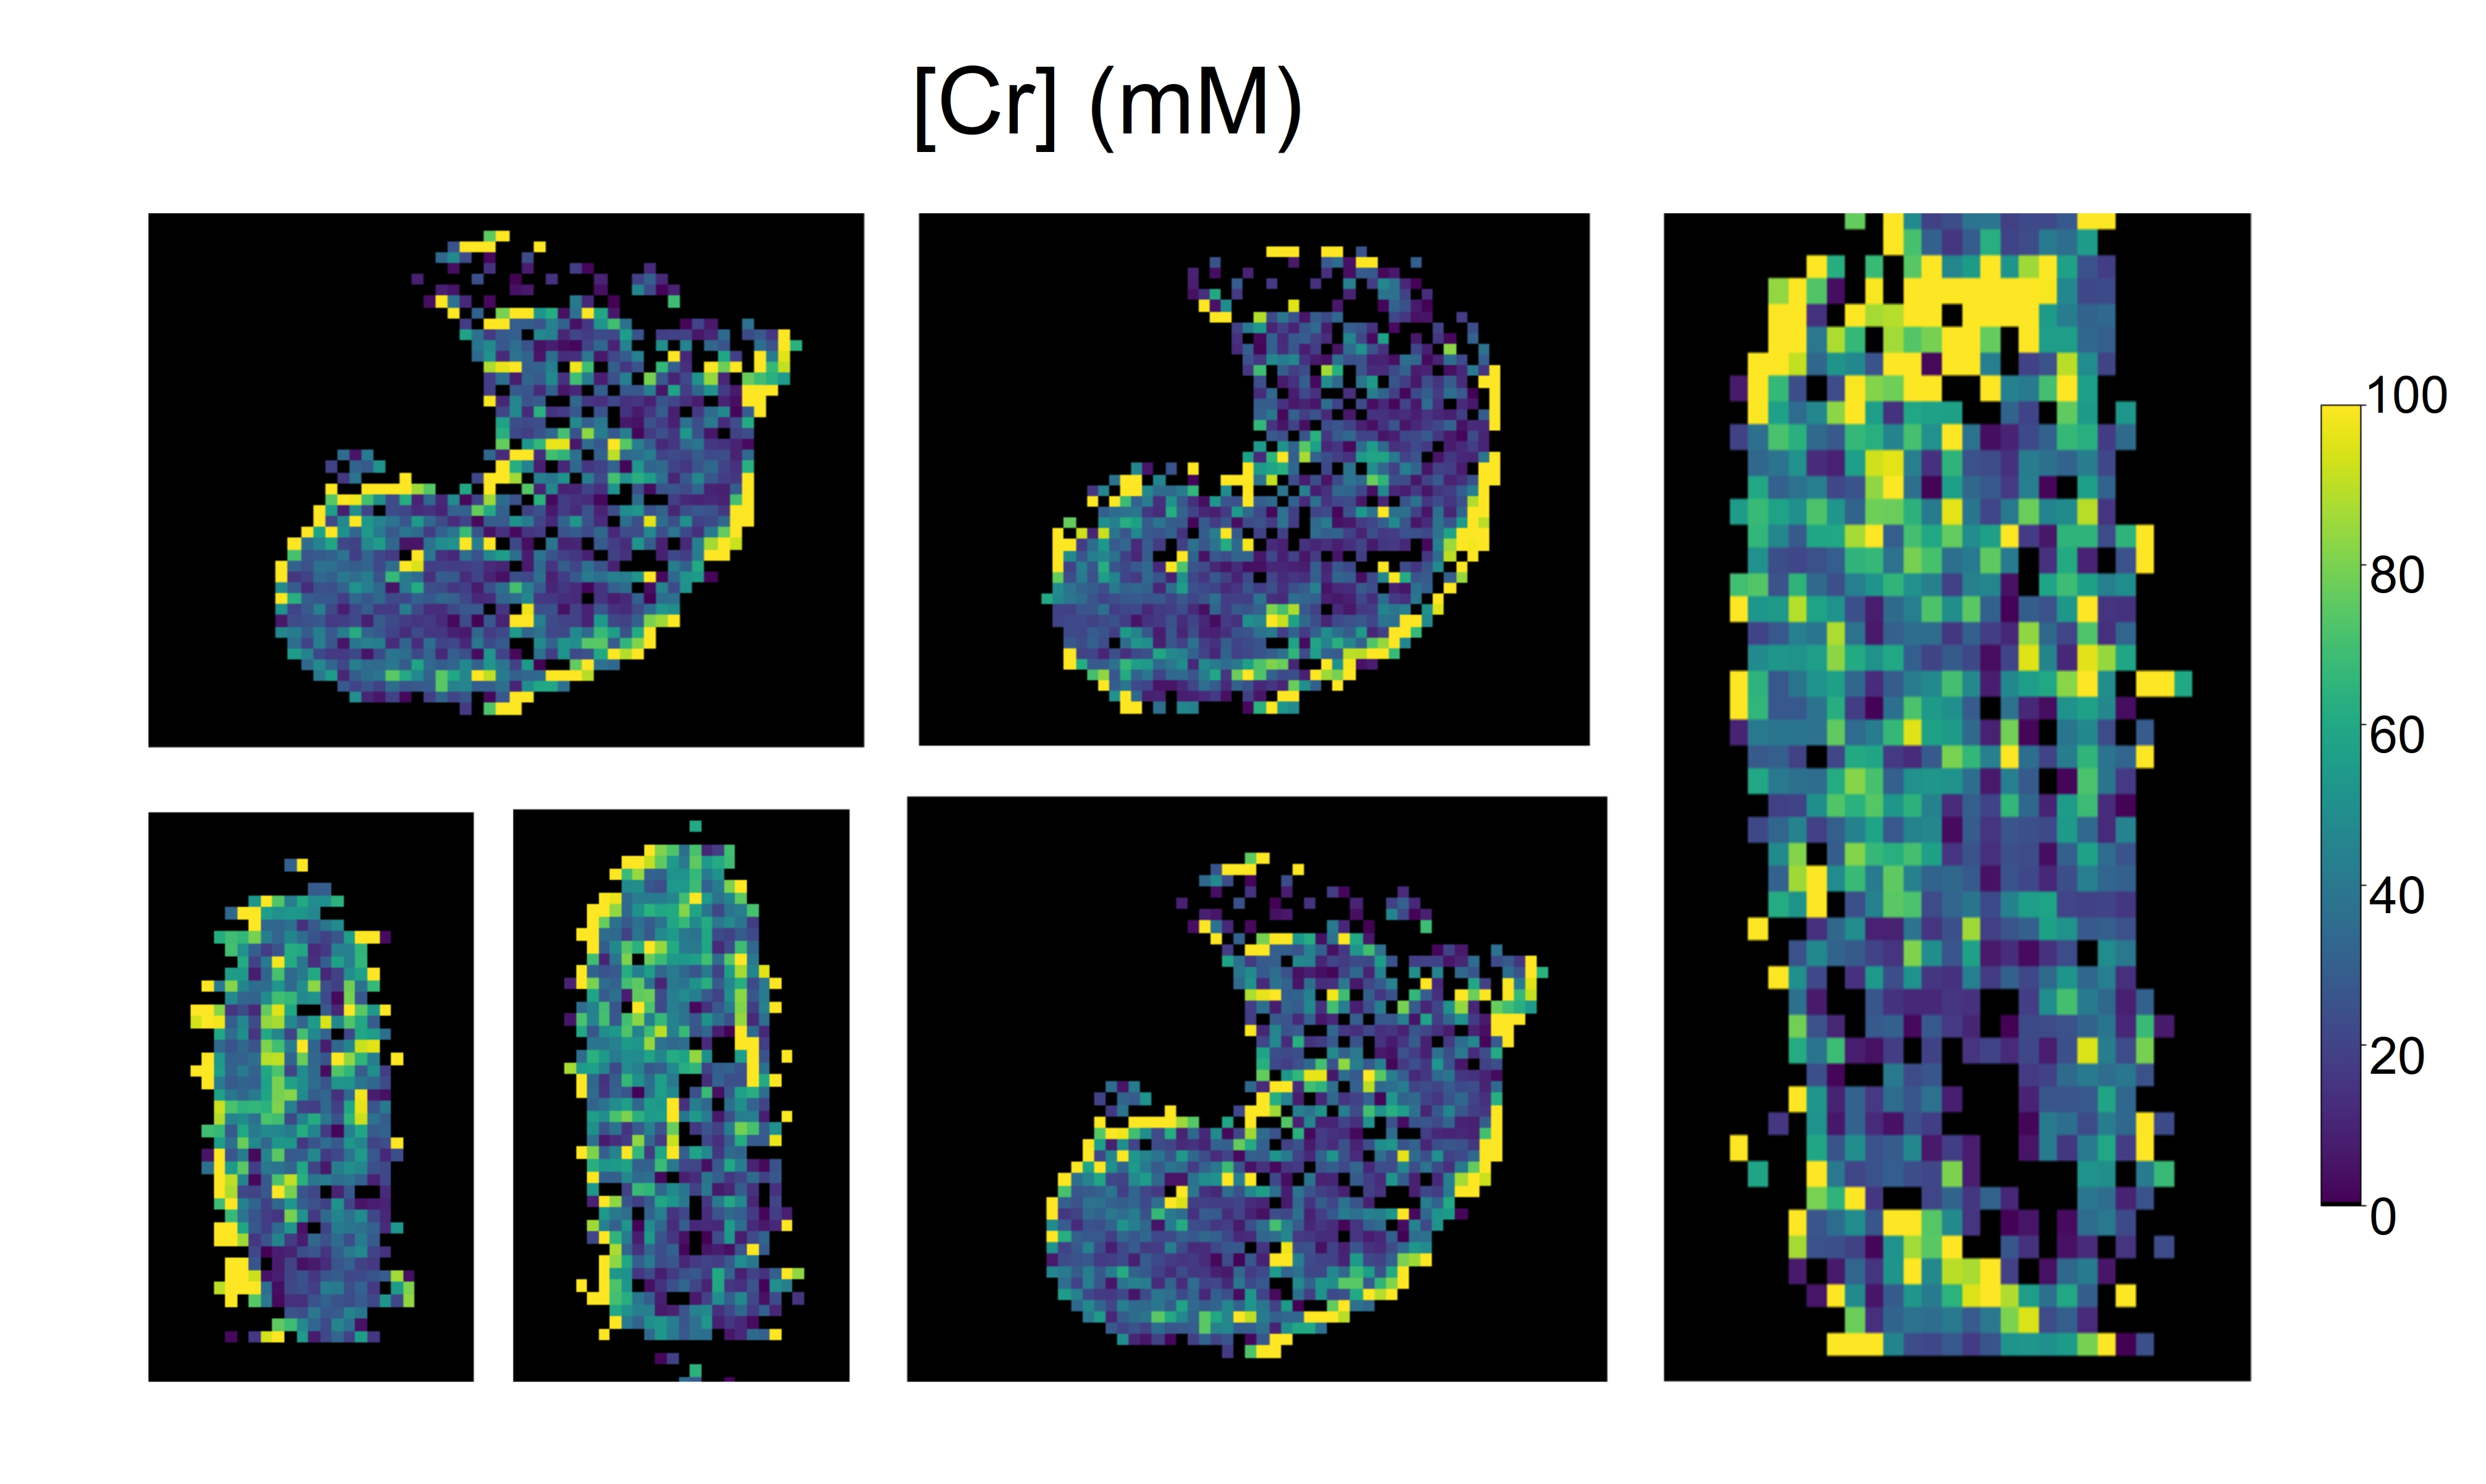
Fig. 3. Various orientation views for Cr concentration maps, obtained using a 3D Snapshot CEST AREX imaging protocol at 3T.
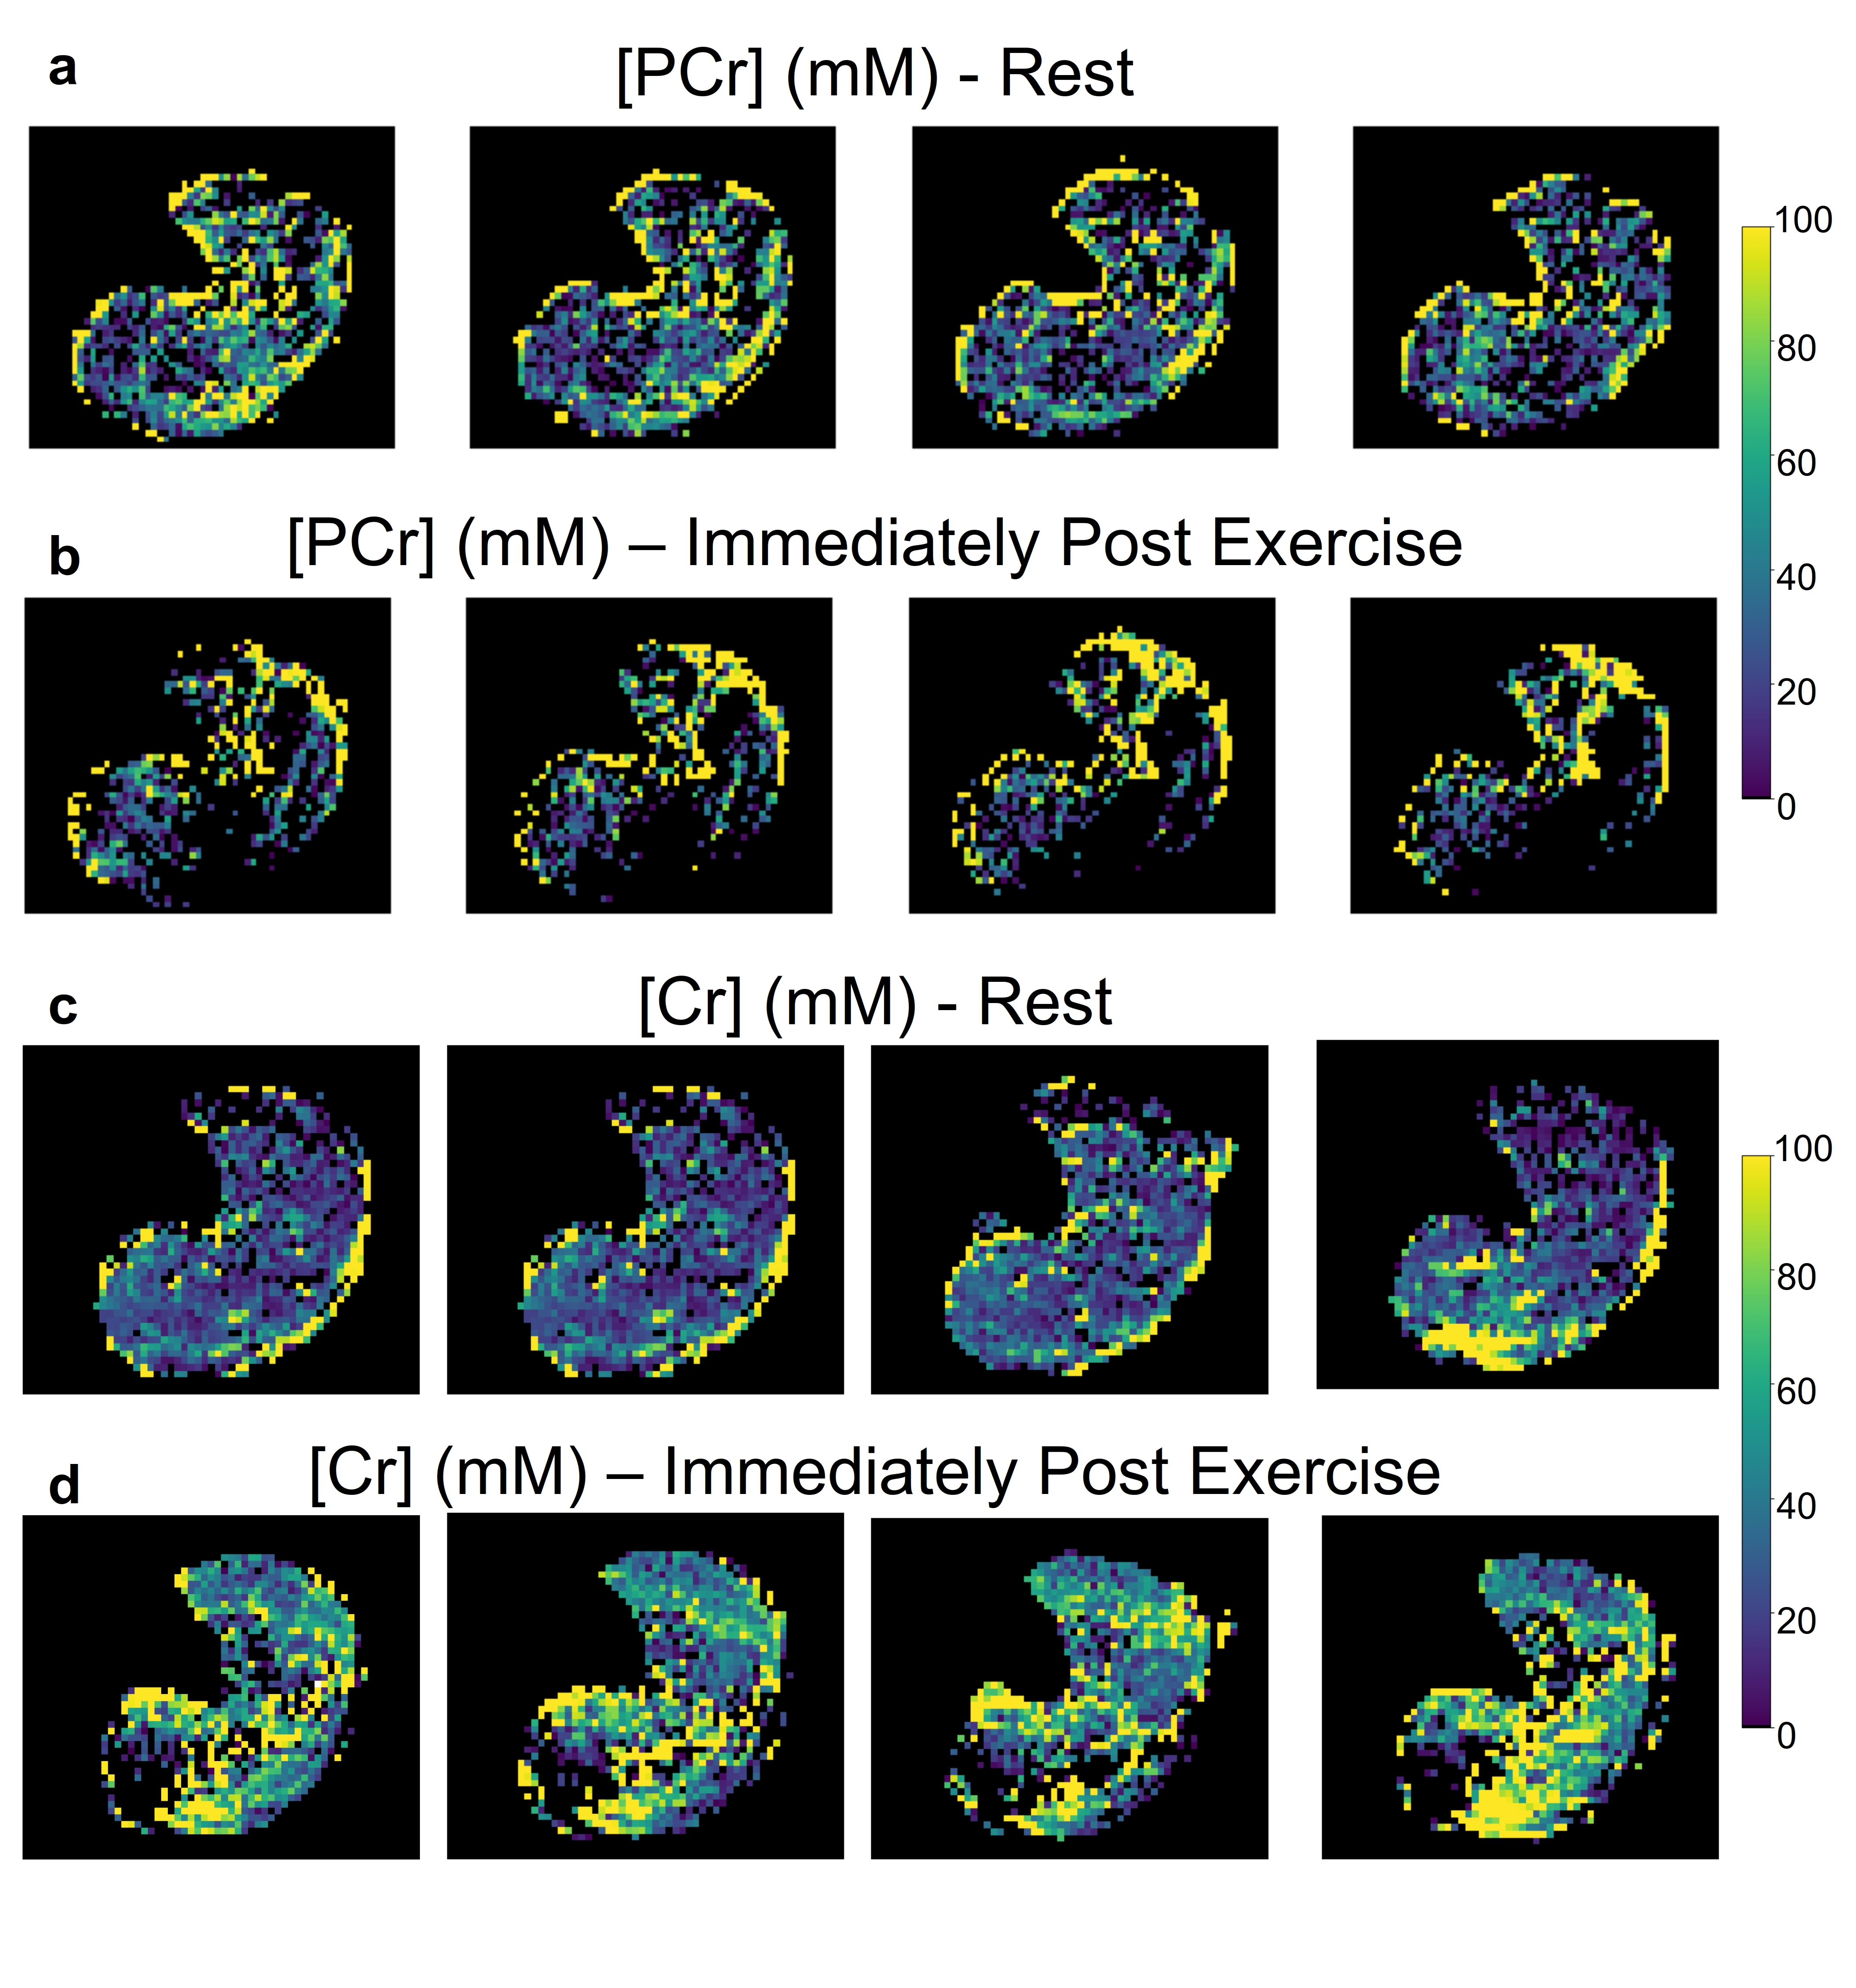
Fig. 4. PCr (a-b) and Cr (c-d) concentration maps, before (a, c) and after (b, d) exercise, obtained using 3D Snapshot AREX-CEST imaging. Note the PCr concentration decrease and Cr concentration increase following exercise, as expected.
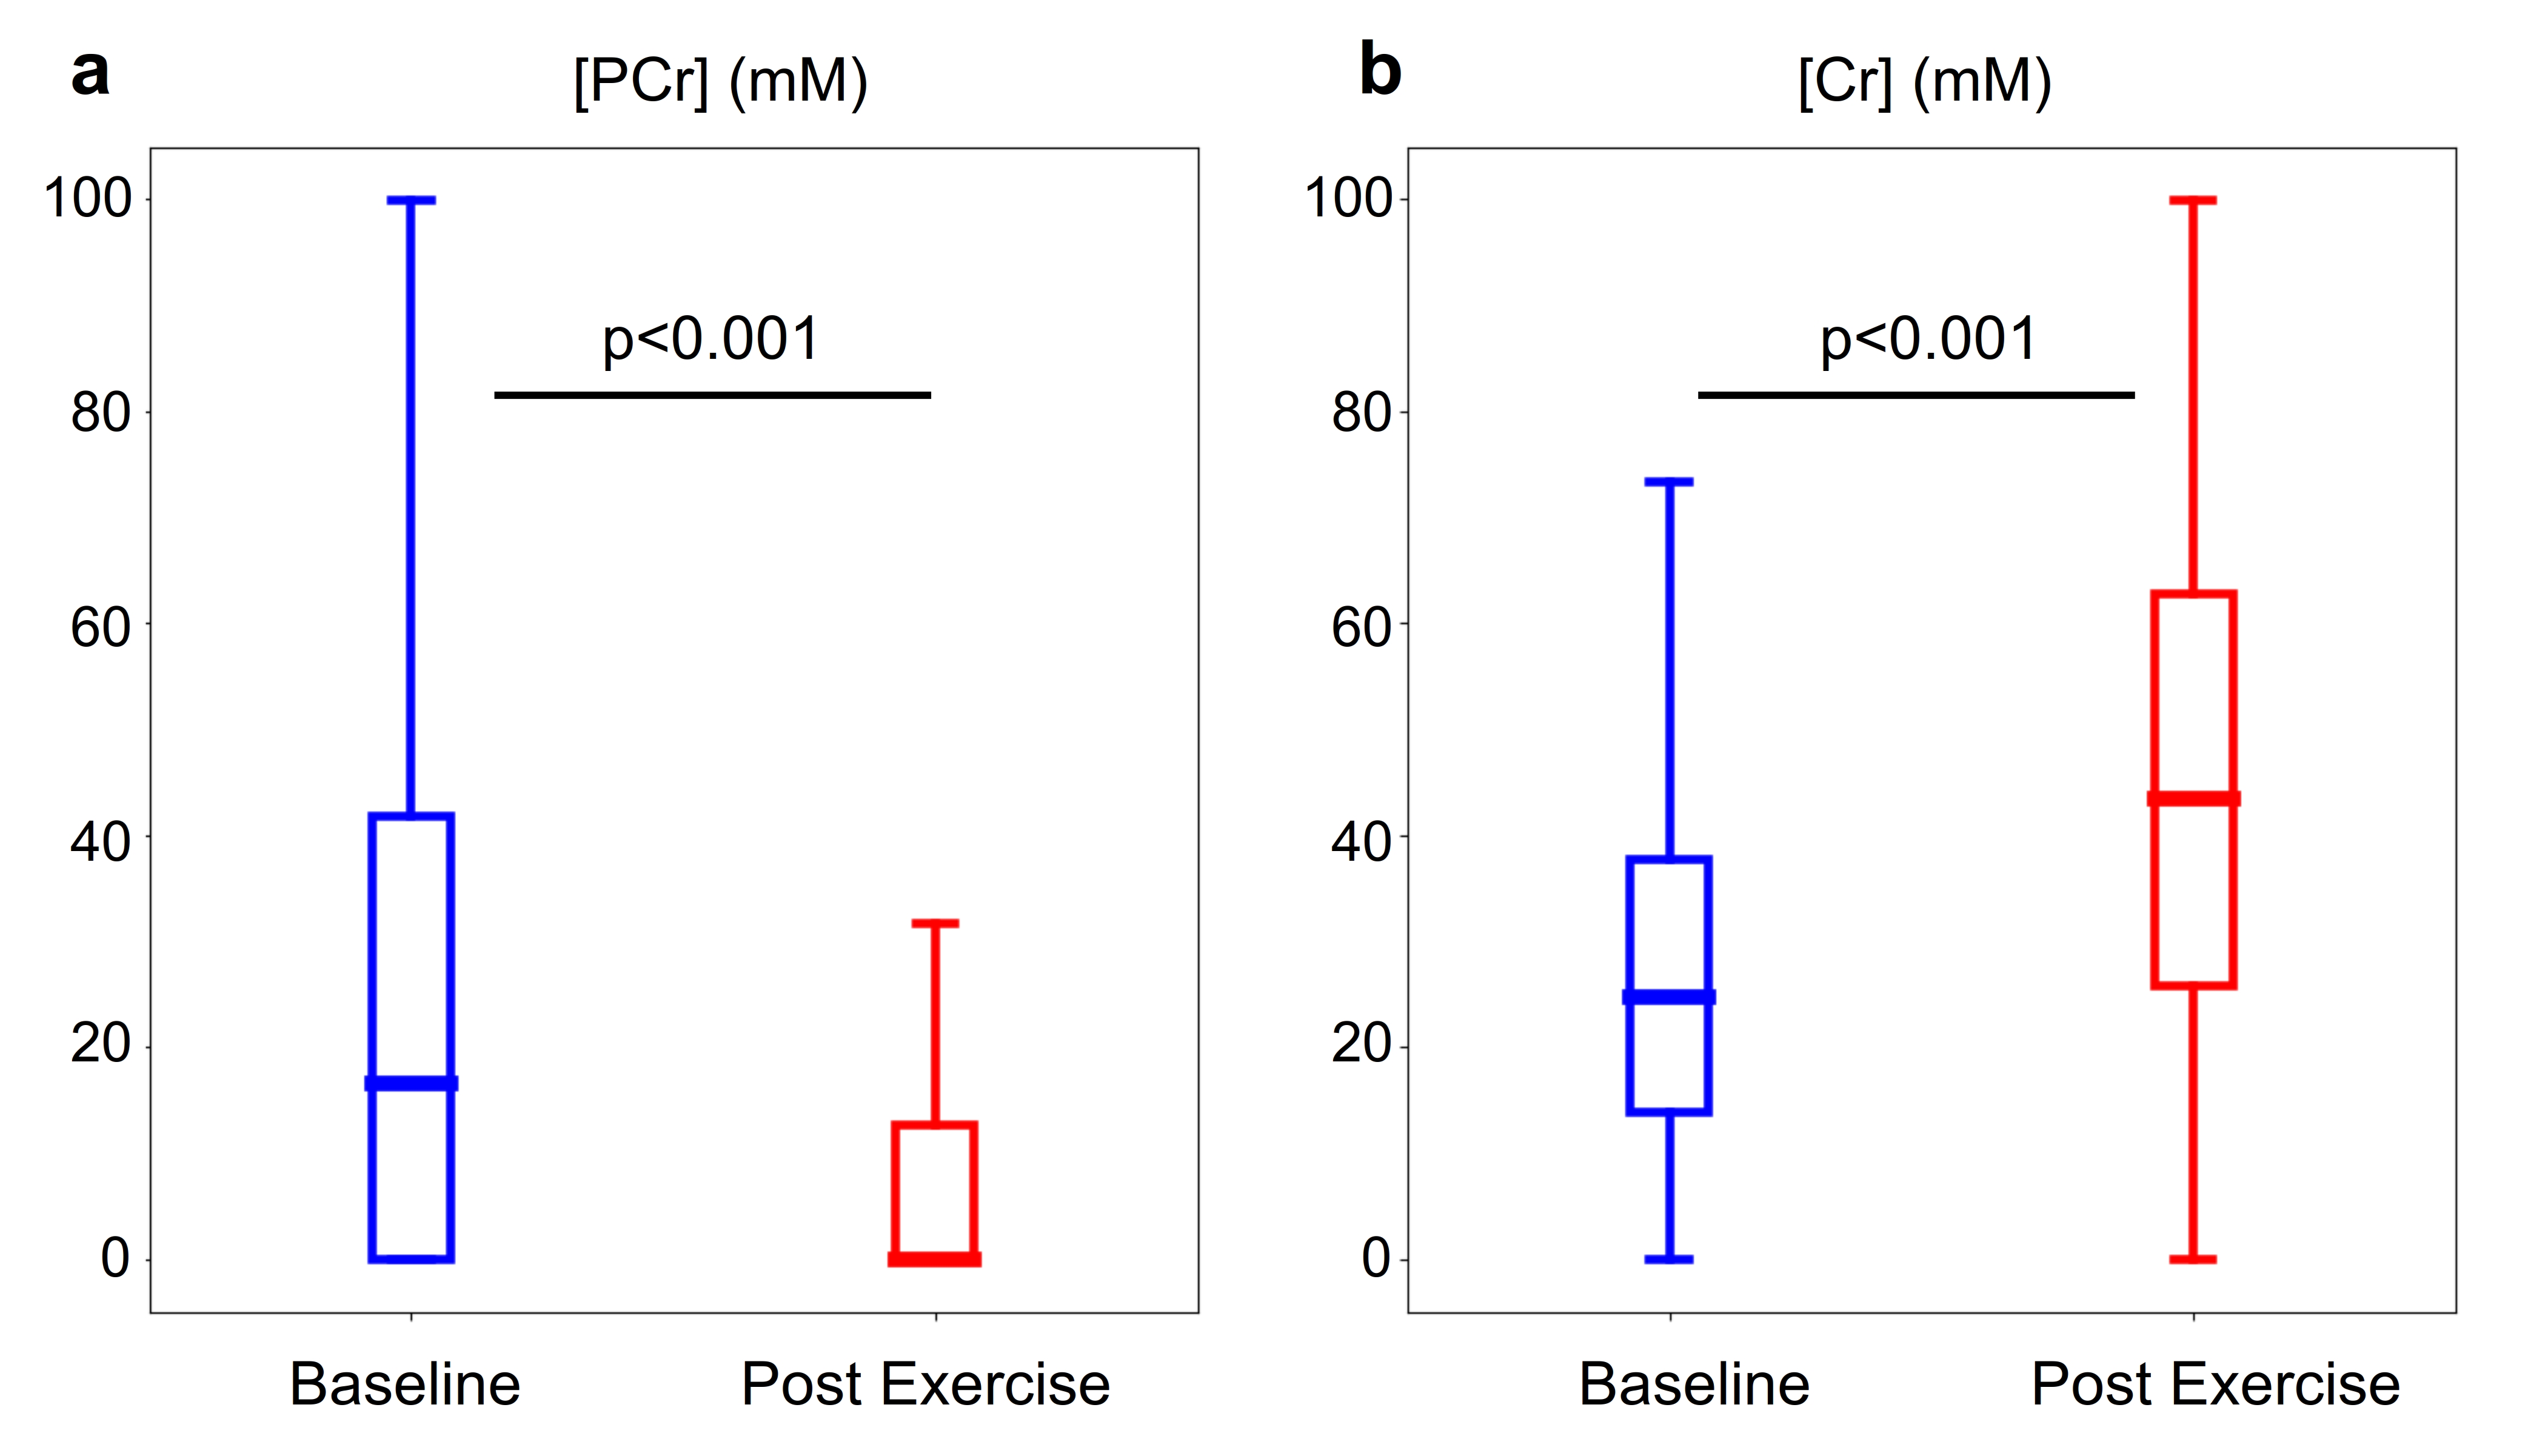
Fig. 5. Quantitative evaluation of the PCr (a) and Cr (b) concentrations before and after exercise, evaluated using a 3D ROI. In all box plots the central horizontal lines represent median values, box limits represent upper (third) and lower (first) quartiles, and whiskers represent 1.5 × the interquartile range above and below the upper and lower quartiles, respectively.