2083
CEST effects change with age1Neuroradiology, University Hospital Erlangen, Friedrich-Alexander-Universität Erlangen-Nürnberg (FAU), Erlangen, Germany, 2Max Planck Institute for Biological Cybernetics, Tübingen, Germany, 3Radiology, University Hospital Erlangen, Friedrich-Alexander-Universität Erlangen-Nürnberg (FAU), Erlangen, Germany, 4Neurology, University Hospital Erlangen, Friedrich-Alexander-Universität Erlangen-Nürnberg (FAU), Erlangen, Germany
Synopsis
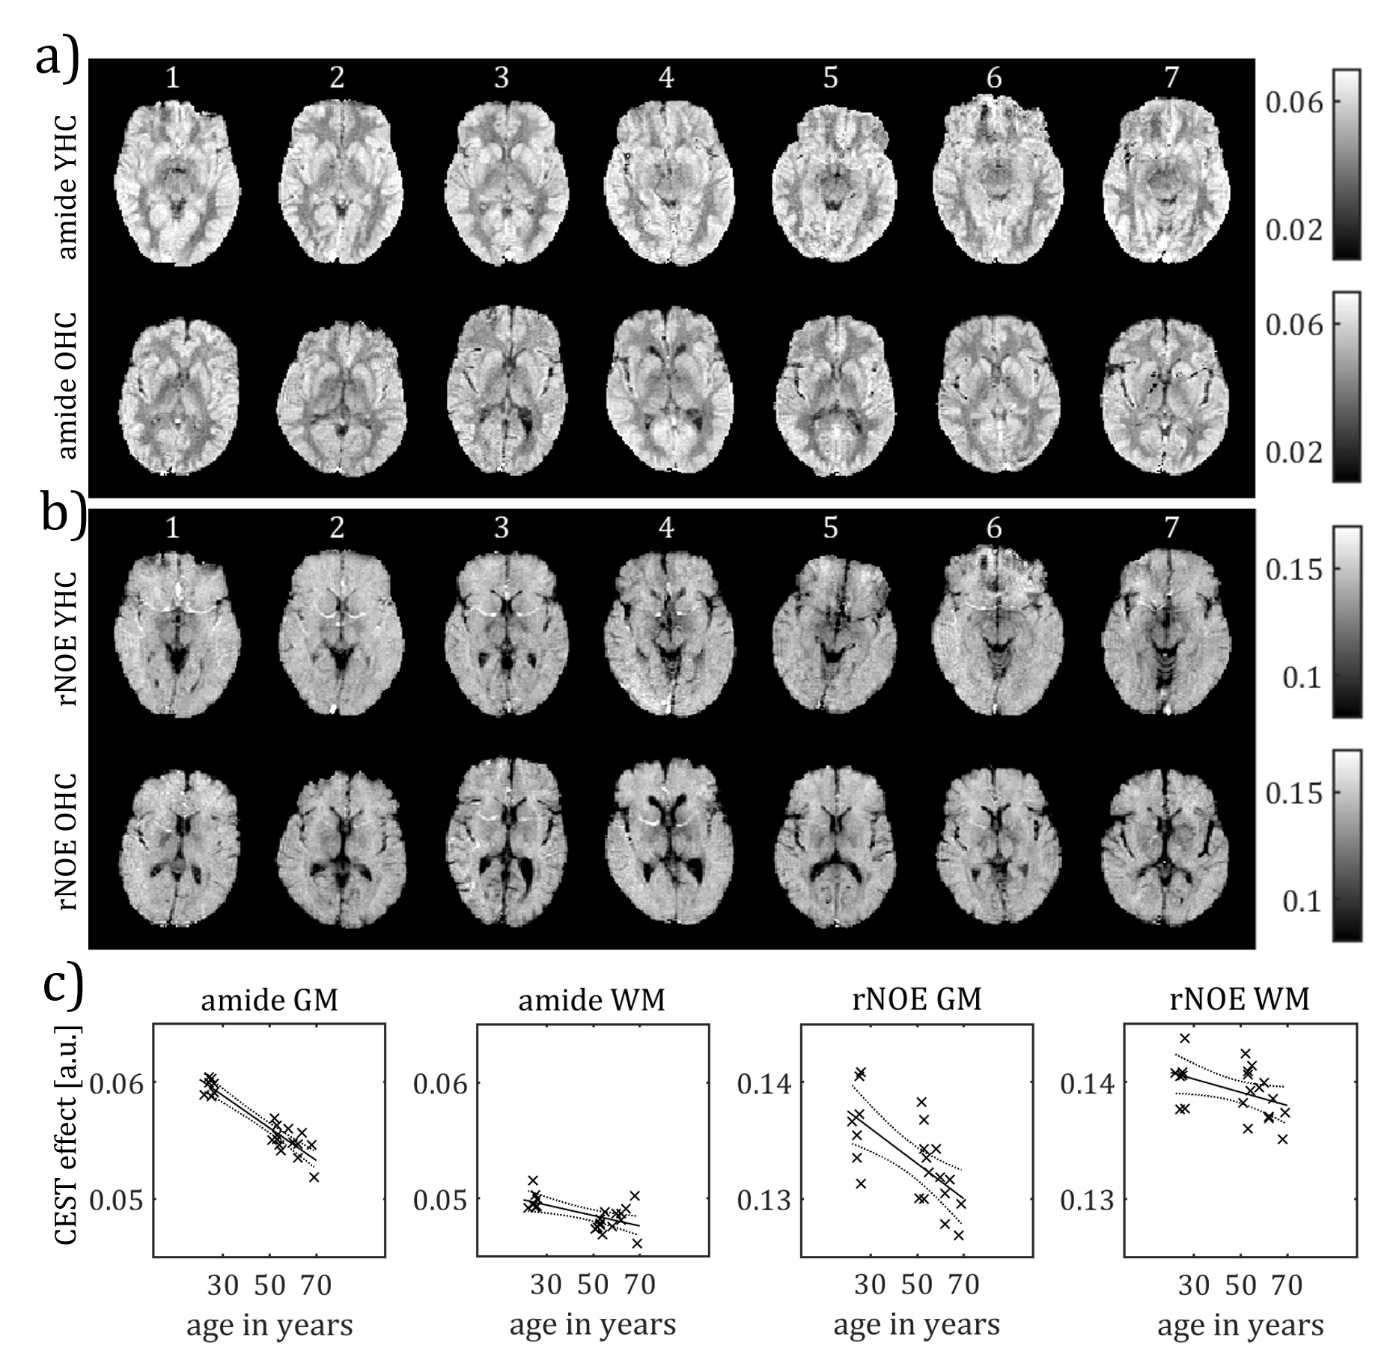
The amide and rNOE CEST amplitudes are negatively correlated with age. Most prominently, the mean gray matter amide CEST amplitude decreases on average by 0.22 % per year of age in the cohort of our study.
Introduction
Understanding healthy aging is a mandatory objective of basic research before analysing the influences of aging diseases. The mortality and the prevalence for many diseases increases with age. The telomere necessary for capping and stabilization of the deoxyribonucleic acid shorten each time a cell divides – which finally leads to a length at which the cell division process is stopped (1). Healthy aging process and the diseases need to be distinguished. In MRI, a wide variety of aging effects is familiar as the enlargement of the ventricles, the increased rate of white matter hyperintensities and the change of the relaxation times T1, T2, and T2* as well as the change of the magnetisation transfer contrast (2). Chemical exchange saturation transfer (CEST) MR imaging is a molecular imaging method with potential in clinic and basic research for focal pathologies such as tumours and stroke (3, 4). To expand the CEST research to non-focal pathologies as Alzheimer´s, diffuse traumatic brain injuries and others, especially high reproducibility is necessary and possible confounders need to be alleviated at the best. One potential nuisance parameter is the age of the subjects. We investigated the age effects of amide and rNOE CEST amplitudes as received by Lorentzian line fitting after using an optimised postprocessing pipeline (5).Methods
Healthy subjects of two age cohorts underwent MR scans with a CEST MRI protocol on a 7 T whole body MR scanner (Magnetom Terra, Siemens Healthcare GmbH, Erlangen, Germany). The 7 younger subjects (YHC) were between 22 and 26 years (M = 24.6, SD = 1.4), the 14 older subjects (OHC) were between 51 and 69 years (M = 58.1, SD = 6.1). All subjects gave their written informed consent before the measurements. The local ethic committee approved the study. A slab-selective snapshot CEST with -homogeneous parallel transmit protocol was used (6) employing an 8Tx/32Rx head coil (Nova Medical, Wilmington, MA, USA) at two B1 levels of 0.72μT and 1.00μT (7). The post-processing consisted of motion correction, smoothing, -correction, normalization, denoising, -correction and Lorentzian fitting as described in (5). Here, we focus on the amplitudes of amide and rNOE CEST. For anatomical information, a pTx MPRAGE sequence was measured (8). The SPM standard segmentation algorithm using tissue probability maps as priors was utilized to obtain a segmentation of the brain into gray and white matter, cerebrospinal fluid and non-brain tissue based on the MPRAGE sequence (9). The segments were then transformed rigidly to be co-registered to the CEST images. The amide CEST and rNOE amplitudes were averaged within brain gray and white matter segments. A linear regression was performed to analyze the influence of the subject age on the amplitudes of amide CEST and rNOE using Matlab (Mathworks, Natick, MA, USA). The coefficient of variation (CoV) was calculated as the standard deviation divided by the respective mean.Results
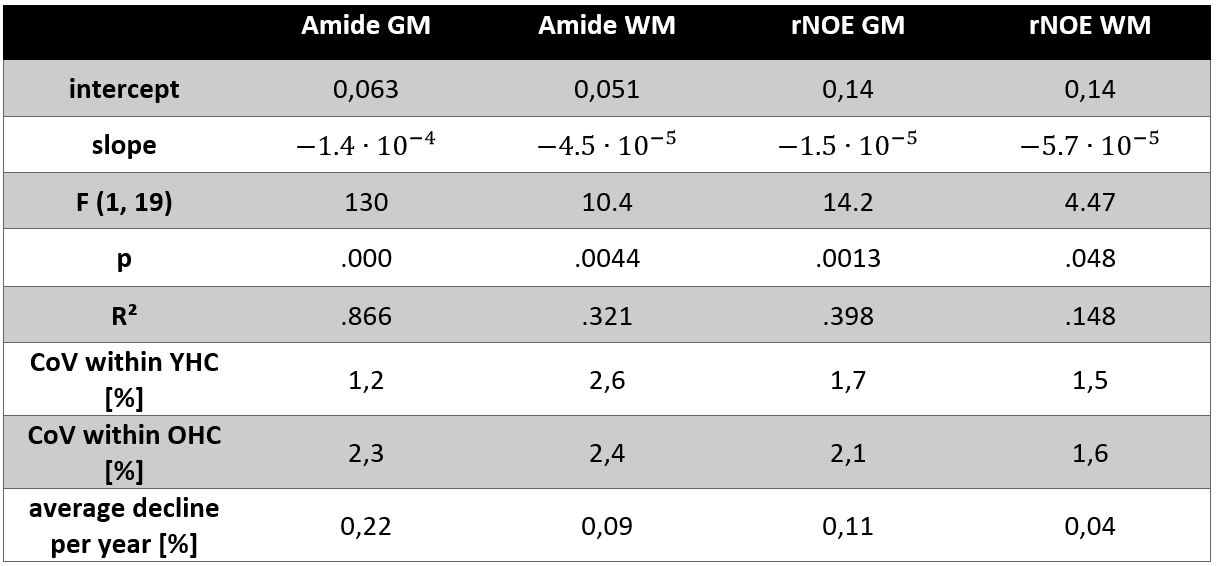
Amide and rNOE CEST amplitudes showed significant negative correlations with age (figure 1, table 1). The most prominent decrease in CEST amplitude was found regarding the amide CEST amplitude in gray matter (F(1,19) = 130, p < 0.0001) with an R² of 0.866. Participants’ predicted gray matter amide CEST amplitude is equal to 0.063 – 1.4· 10-4 a when age a is measured in years. The mean gray matter amide CEST amplitude was predicted to decrease by 0.22 % for each year of age. The difference in gray matter amide CEST amplitude is visibly detectable in figure 1a where the YHC gray matter appears more bright than the OHC gray matter. Regarding the amide CEST amplitude in white matter, a significant regression equation was found (F (1,19) = 10.4, p < 0.01 with R² of 0.321. The participants’ predicted CEST amplitude decreased by 0.09% per year. The rNOE CEST amplitude showed a significant negative correlation with age (F (1,19) = 14.2, p < 0.01) following the equation 0.14 – 1.5·10-5 a. The mean gray matter rNOE CEST amplitude decreased by 0.11% per year.Discussion
We found significant negative correlations between age of the subjects and the amide and rNOE CEST amplitudes. Most prominent correlation was seen in gray matter for amide CEST, followed by the rNOE CEST amplitude. The reason of the decrease cannot be disentangled within this descriptive study. Possible sources are the decrease of CEST – active proteins and aliphatic protons, pH changes, changes of the relaxation times T1 and T2 and others. Interestingly, in the literature, more T1 and T2 change was observed in the white matter than in the gray matter (2). In contrast, in our study, we see more change of the CEST effects in the gray matter. Therefore, the change of the relaxation times might not be the most central influence. Hence, a change in molecular composition comes into focus. First attempts have been made to calculate kinds of metabolic brain age out of age dependent MR measures (2). As we see with this preliminary study, the CEST amplitudes are promising candidates for those directions of research.Conclusion
CEST effects alter with subject age, which has implications for the design of studies, but also opens a new path for voxel-wise biological age estimations via CEST MRI.Acknowledgements
No acknowledgement found.References
1. Hayflick L. The limited in vitro lifetime of human diploid cell strains. Experimental Cell Research 1965; 37: 614-636.
2. MacDonald ME and Pike GB. MRI of healthy brain aging: A review. NMR Biomed 2021; 34: e4564.
3. Regnery S, Adeberg S, Dreher C, Oberhollenzer J, Meissner JE, Goerke S, Windschuh J, Deike-Hofmann K, Bickelhaupt S, Zaiss M, Radbruch A, Bendszus M, Wick W, Unterberg A, Rieken S, Debus J, Bachert P, Ladd M, Schlemmer HP and Paech D. Chemical exchange saturation transfer MRI serves as predictor of early progression in glioblastoma patients. Oncotarget 2018; 9: 28772-28783. 4. Zhou J, Heo HY, Knutsson L, van Zijl PCM and Jiang S. APT-weighted MRI: Techniques, current neuro applications, and challenging issues. J Magn Reson Imaging 2019; 50: 347-364.
5. Mennecke A, Khakzar K, Herz K, Fabian M, German A, Liebert A, Blümcke I, Kasper B, Schmidt M, Dörfler A, Nagel AN, Laun FB and Zaiss M. 7 tricks for 7T CEST - improving reproducibility and sensitivity of multi-pool evaluation; Proc. Intl. Soc. Mag. Reson. Med. 2021: online
6. Liebert A, Zaiss M, Gumbrecht R, Tkotz K, Linz P, Schmitt B, Laun FB, Doerfler A, Uder M and Nagel AM. Multiple interleaved mode saturation (MIMOSA) for B(1) (+) inhomogeneity mitigation in chemical exchange saturation transfer. Magn Reson Med 2019; 82: 693-705.
7. Zaiss M, Ehses P and Scheffler K. Snapshot-CEST: Optimizing spiral-centric-reordered gradient echo acquisition for fast and robust 3D CEST MRI at 9.4 T. NMR Biomed 2018; 31: e3879.
8. Herrler J, Liebig P, Gumbrecht R, Ritter D, Schmitter S, Maier A, Schmidt M, Uder M, Doerfler A and Nagel AM. Fast online-customized (FOCUS) parallel transmission pulses: A combination of universal pulses and individual optimization. Magn Reson Med 2021; 85: 3140-3153.
9. Ashburner J and Friston KJ. Unified segmentation. Neuroimage 2005; 26: 839-51.
Figures