2076
Repeatability of APTw imaging at 7T1Department of Radiology, University of Medical Centre Utrecht, Utrecht, Netherlands, 2Magnetic Detection and Imaging Group, Technical Medical Centre, University of Twente, Enschede, Netherlands, 3Department of paediatric neuro-oncology, Princess Maxima Centre, Utrecht, Netherlands
Synopsis
APTw imaging is a potential imaging biomarker to assess treatment effects in brain tumours, especially at high field MRI (7T) due to improved signal-to-noise-ratio enabling the assessment of APTw values in heterogenous tumours. Embedding of APTw imaging in clinical decision making requires insight in the repeatability of APTw imaging. Therefore, we evaluated the repeatability of APTw imaging at 7T by using a phantom and in vivo in the human brain subjects. Repeatable and specific APTw maps were obtained at 7T, which facilitate the potential of detecting metabolic changes in brain tumours due to treatment.
Introduction
Amide proton transfer weighted (APTw) imaging is based upon chemical exchange saturation transfer (CEST) and enables in vivo assessment of tissue-bound mobile proteins and peptides1,2. Promising applications of APTw imaging in neuro-oncology include differentiation between high and low grade glioma and between true progression and pseudoprogression3. Furthermore, APTw imaging is reported as a potential imaging biomarker for the assessment of treatment effects in brain tumours4,5. At 7T MRI, the improved signal-to-noise-ratio and spectral resolution and prolonged T1-relaxation time enables APTw imaging at higher resolution which in turn makes it possible to measure heterogeneity of APTw values in brain tumours relevant for the evaluation of treatment effects1,6,7. For application of APTw imaging in clinical decision making regarding treatment effects in brain tumours insight in the repeatability is required. Therefore, the aim of this study is to assess the repeatability of APTw imaging at 7T in a phantom and in vivo in the human brain.Methods
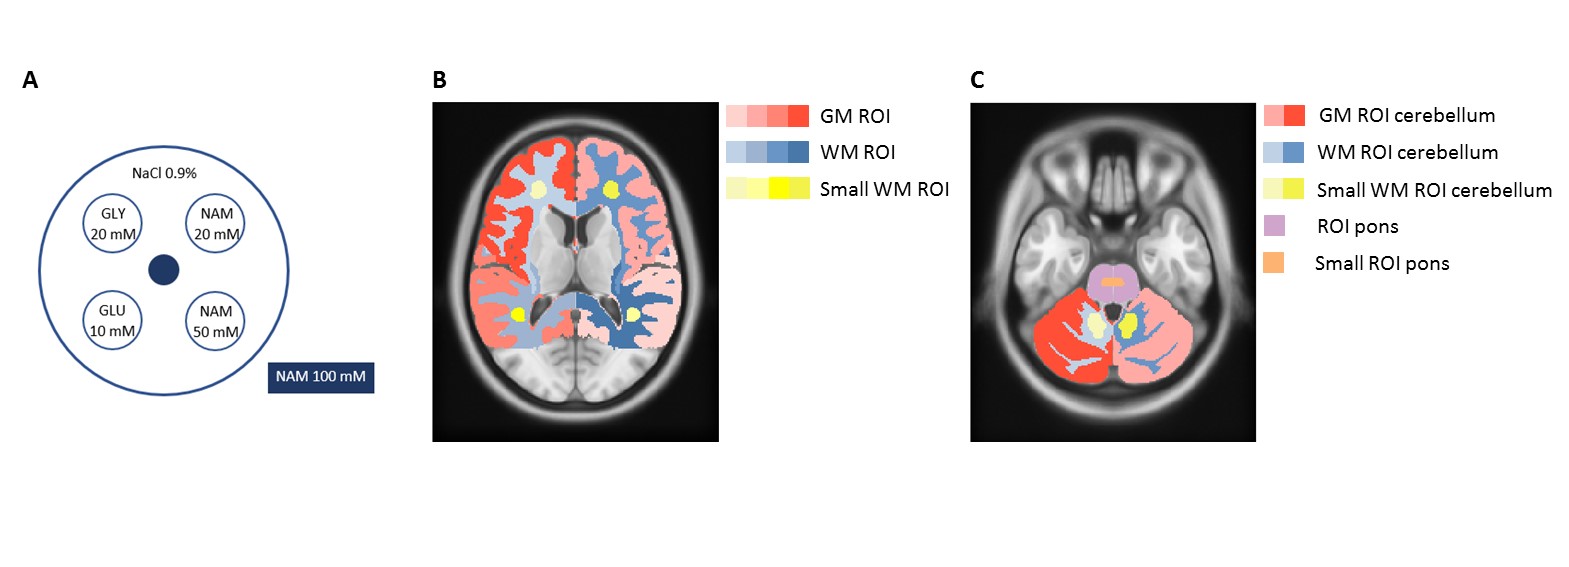
A 7T MRI scanner (Achieva, Philips Healthcare, Best, The Netherlands) was used in combination with a 32-channel receive and 8-channel transmit head coil (Nova Medical, Wilmington (MA), United States). The APTw images were acquired with a 3D gradient echo sequence with 35 frequency offsets [Δω=0,±0.20,±0.27,±0.50,±1.17,±1.84,±2.60,±2.80,±3.00,±3.20,±3.34,±3.65,±3.80,±4.20,±6.71,±20.00,±40.00 and S0, Δω=±600.00 ppm] and the following imaging parameters: saturation time= 1.4 (56 block pulses (alternating between two 4-channel quadrature B1 shim settings) of 25 ms); TFE shot-interval of 8s (overall TR); B1,rms+= 2.1 µT; SENSE factor AP of 2.4, matrix= 128x128x12; FOV= 256x256x24 mm3; voxel size= 2.0x2.0x2.0 mm3; TR/TE= 3.75/1.8 ms; flip angle= 5°. Image protocol based on a protocol optimized to measure multiple metabolites8.A cylindrical phantom filled with 0.9% saline solution and five submerged falcon tubes (Figure 1-A), at pH ~7.0 (range 6.8-7.2; measured with indicator strips), contained solutions of nicotinamide (NAM; 20, 50 and 100 mM), glutamate (Glu; 10 mM) and glycine (Gly; 20 mM). APTw images in supratentorial and infratentorial brain region were acquired in five healthy subjects (2m/3f; age: 25.8±1.7 years). T1w-images were used to position the two CEST slabs along the AC-PC line for the supratentorial slab, and a line between the superior pontine notch and the inferior edge of the quadrigeminal plate for the infratentorial slab. The phantom and subjects were scanned twice, with an interval of one week.
Processing
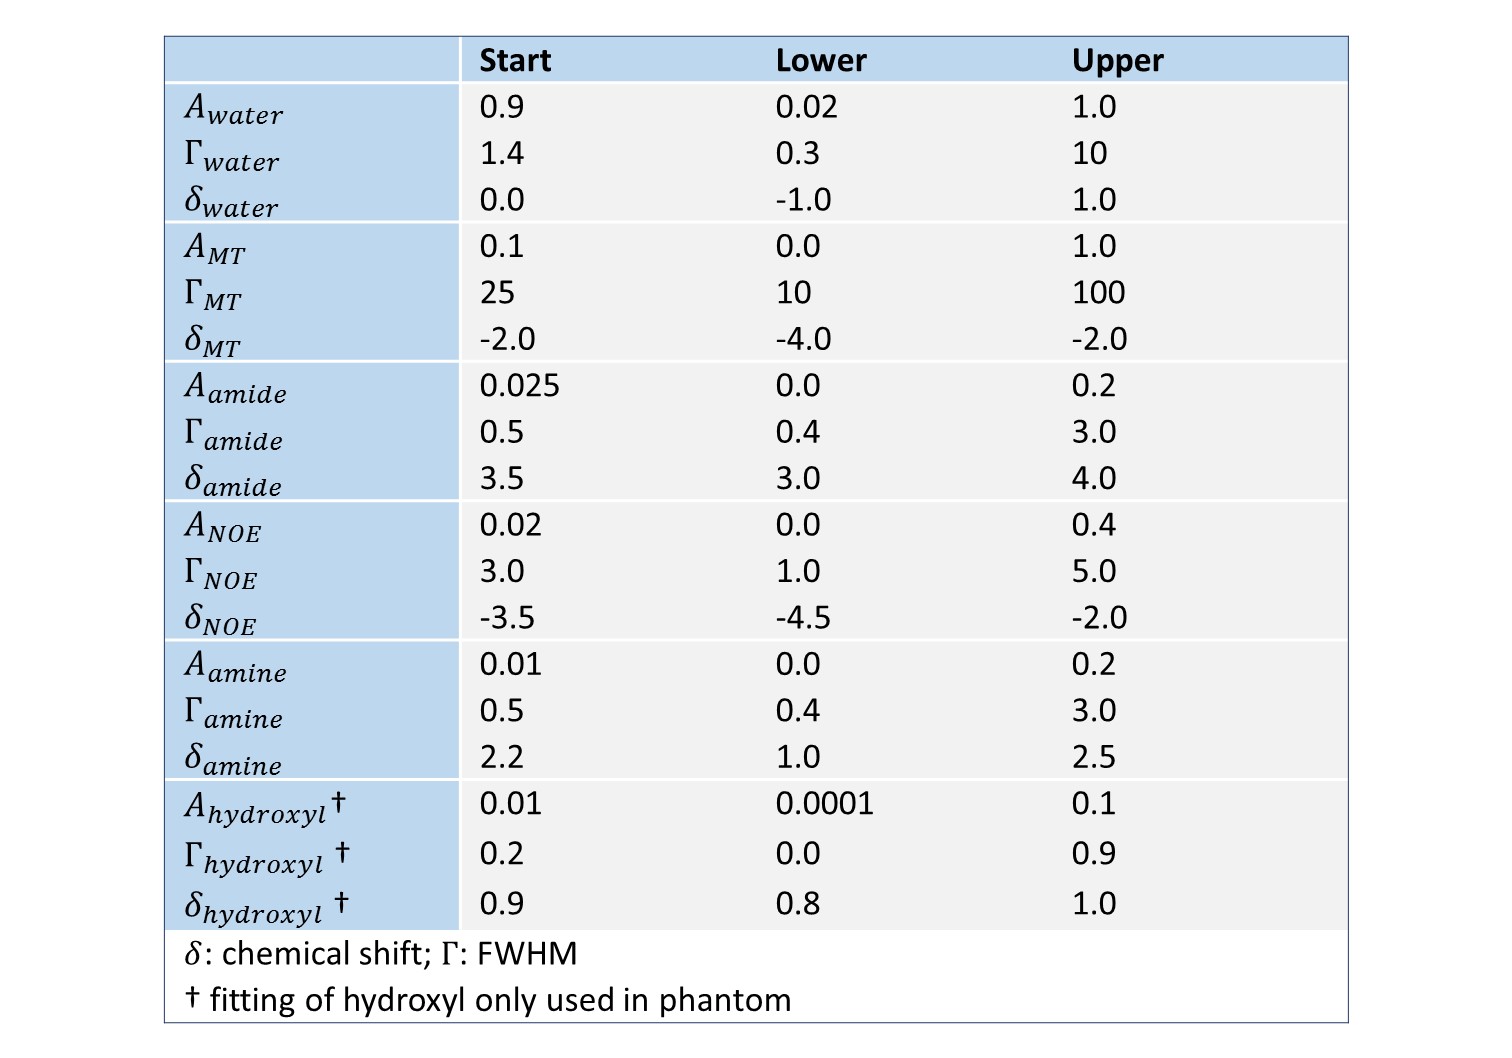
Z-spectra were normalized with respect to the unsaturated z-spectral point (S0). B0-correction was performed pixel-wise by defining the position of the minimum of the z-spectrum, shifting, and resampling the z-spectrum accordingly. The z-spectra were fitted pixel-wise with a five (in vivo) or six-pool (phantom) Lorentzian model (direct water saturation (DS), magnetization transfer (MT), nuclear overhauser effect (NOE), amines, amides (APT), and hydroxyl) using a Levenberg-Marquardt algorithm (see Table 1 for the fitting parameters). All image processing was performed with MATLAB (R2019b, The MathWorks, Natick: MA).
Data analysis
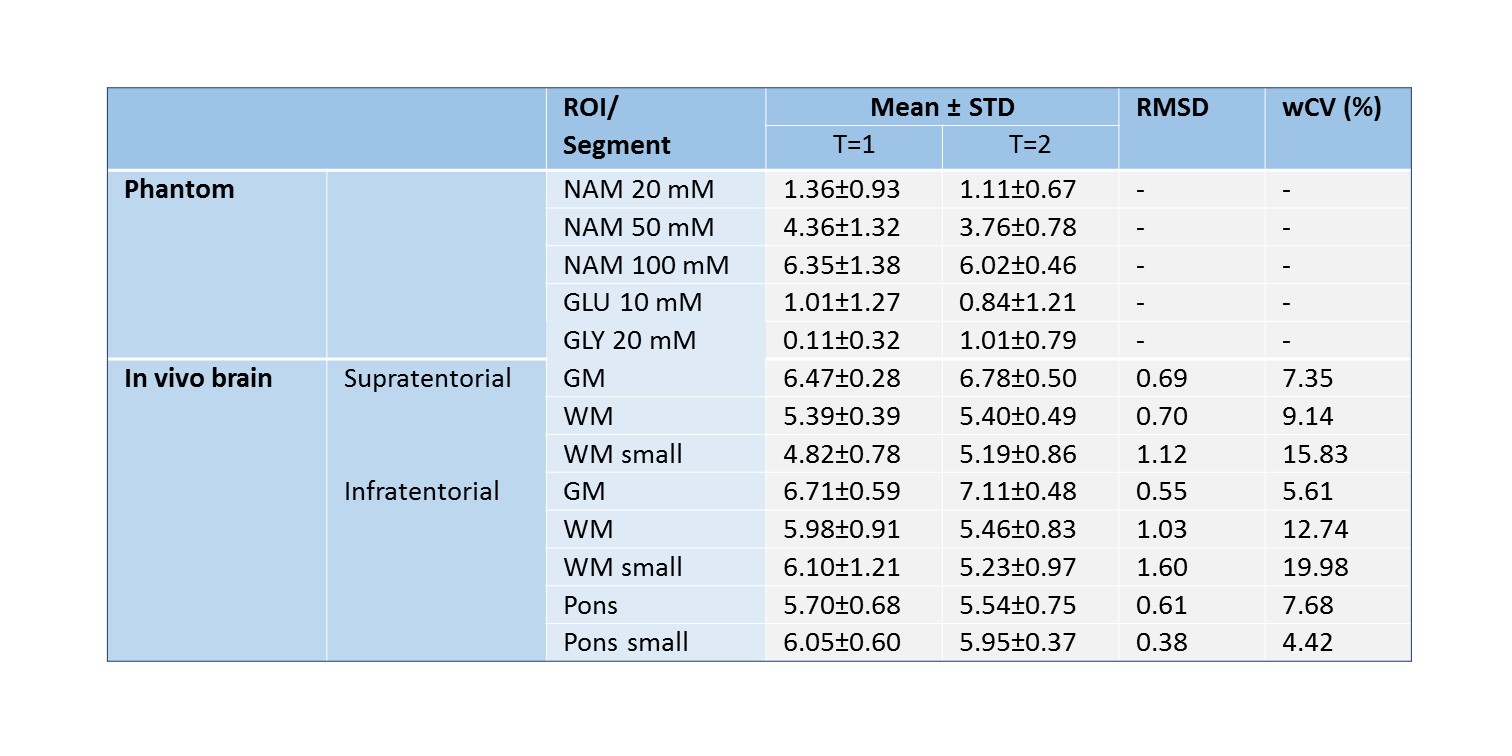
The fitted APTw values were used to generate APTw maps. For the phantom, circular regions of interest (ROIs) were drawn manually for each solute and APTw map was averaged per ROI. The repeatability of the phantom was assessed based on het averaged APTw map of the five solutes by defining the root-mean-squared-deviation (RSMD) and within-coefficient-of-variation (wCV). For the healthy subjects, ROIs were defined by applying atlas-based segmentation using the MNI-152 atlas8,9 and Elastix10, see Figure 1. The repeatability was assessed in supratentorial and infratentorial brain regions separately by measuring RMSD and wCV per tissue type (i.e. grey matter (GM) ROI, (small) white matter (WM) ROI, and (small) pons ROI (only infratentorial)).
Results
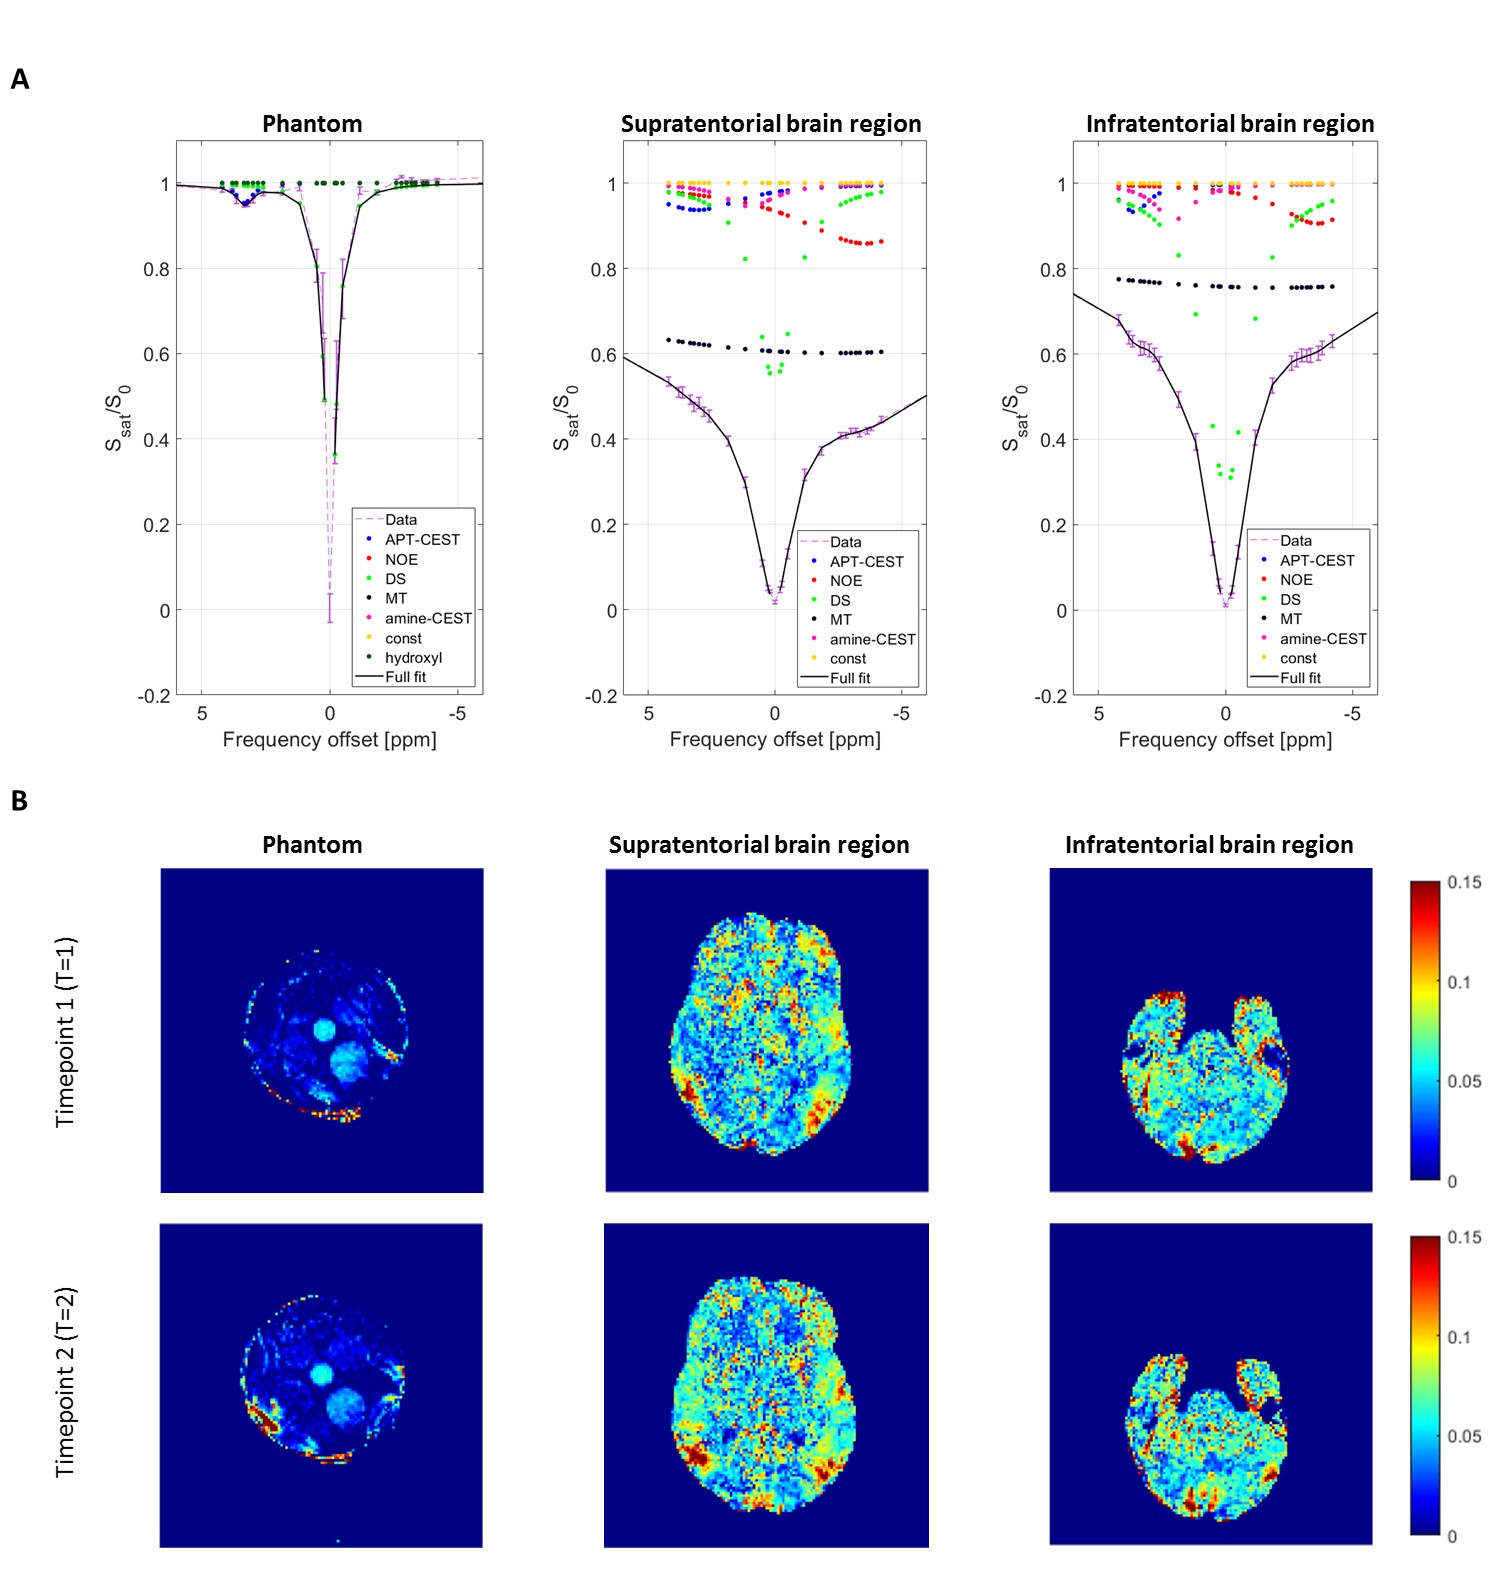
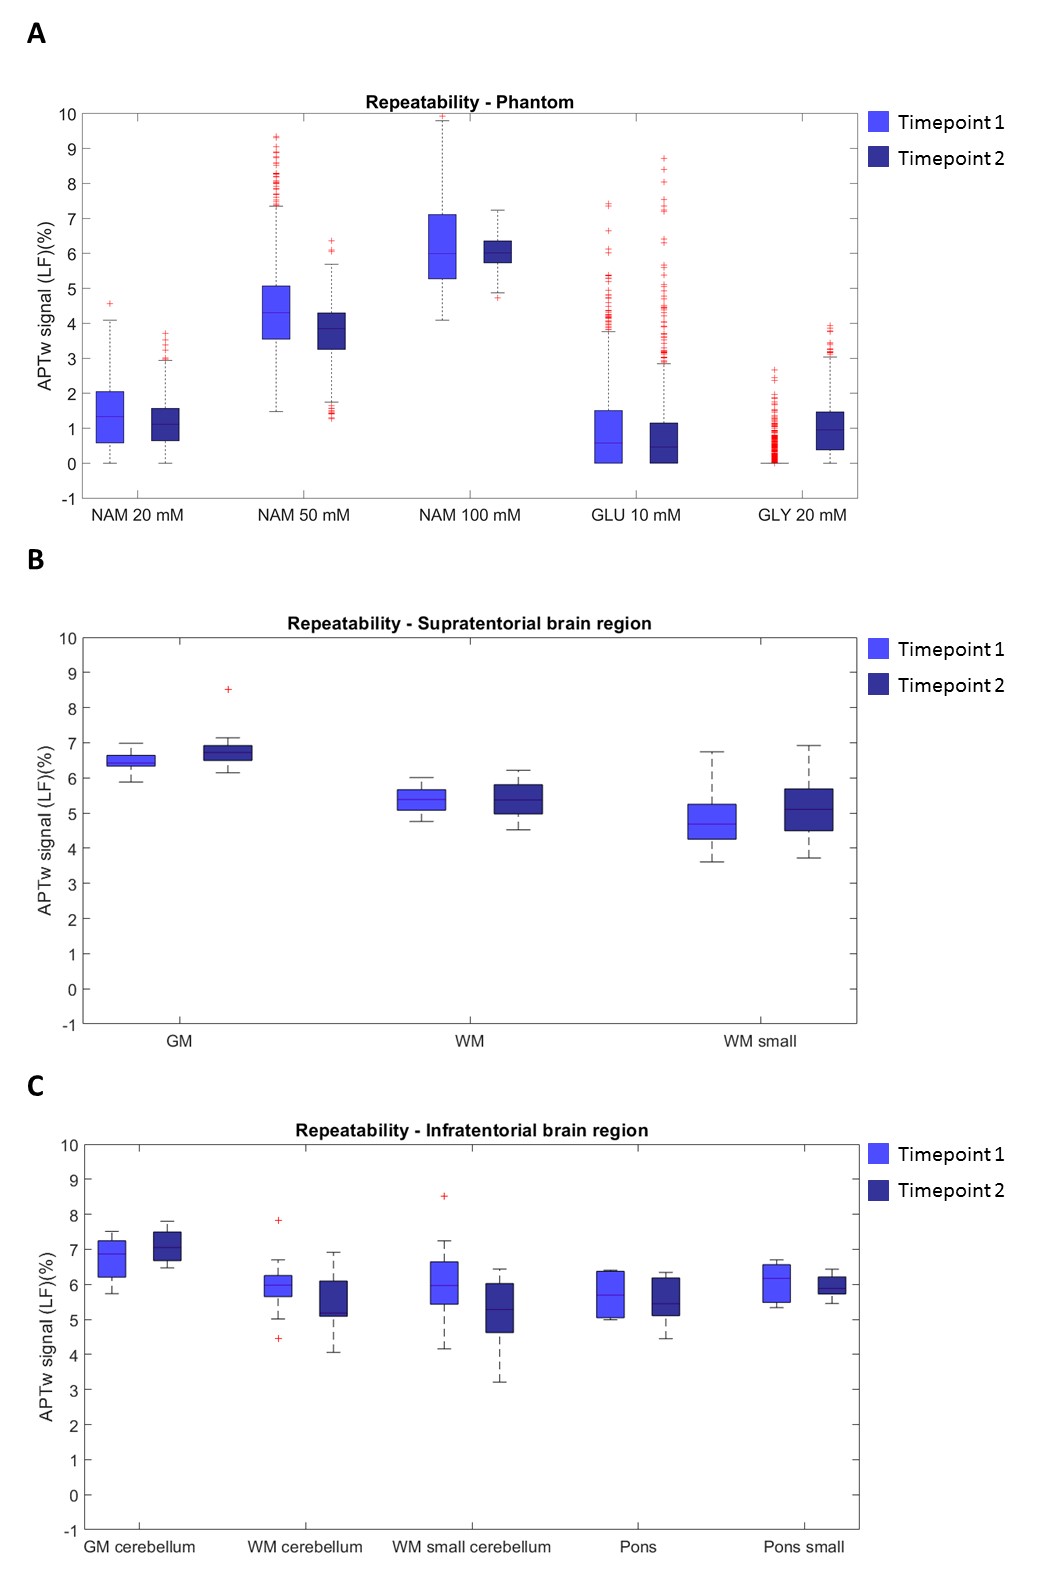
Representative averaged z-spectra of a ROI with corresponding Lorentzian fits are shown in Figure 2-A for the phantom, supratentorial and infratentorial brain region. Figure 2-B shows the APTw maps for the two individual acquisitions, and for both datasets (i.e. phantom and brain). The boxplots (Figure 3) illustrate similar APTw levels for both timepoints for all ROIs, supported by the wCV for the supratentorial and infratentorial brain tissue types (Table 2). The phantom data showed that increasing amide concentration resulted in an increase of the APTw values. The repeatability metrics of the phantom shows a RMSD of 0.52 and wCV of 14.28%. For the healthy subjects, the wCV ranged between 4.42% (small ROIs of the pons) and 19.98% (small ROIs of infratentorial WM).Discussion
APTw imaging at 7T can be considered repeatable and specific for amides which is of high value in clinical decision making. A preclinical study of orthotopic glioblastoma4 and a clinical study in breast cancer patients12 showed a decrease in APTw values of ~25% , in response to cancer treatment. Even within our small ROIs the wCV is lower, which would enable monitoring of treatment effects in heterogeneous tumours.This study uses no B1-correction which may affect the accuracy of APTw values, but is considered not to influence the repeatability as our B1-maps showed no significant change over time within one person. However, B1-correction is necessary when evaluating APTw values between the patients, between different hardware configurations or in a long term follow-up.
In conclusion, we showed that APTw imaging at 7T is specific and repeatable thus potentially enabling detection of metabolic changes in brain tumours due to treatment.
Acknowledgements
We acknowledge funding from WKZ Research Fund.References
[1] van Zijl PCM, Yadav NN. Chemical
exchange saturation transfer (CEST): What is in a name and what isn’t? Magnetic
Resonance in Medicine 2011;65:927–48. https://doi.org/10.1002/mrm.22761.
[2] Wu B, Warnock G, Zaiss
M, Lin C, Chen M, Zhou Z, et al. An overview of CEST MRI for non-MR physicists.
EJNMMI Physics 2016;3. https://doi.org/10.1186/s40658-016-0155-2.
[3] Zhou J, Heo HY,
Knutsson L, van Zijl PCM, Jiang S. APT-weighted MRI: Techniques, current neuro
applications, and challenging issues. Journal of Magnetic Resonance Imaging
2019;50:347–64. https://doi.org/10.1002/JMRI.26645.
[4] Sagiyama K, Mashimo T,
Togao O, Vemireddy V, Hatanpaa KJ, Maher EA, et al. In vivo chemical exchange
saturation transfer imaging allows early detection of a therapeutic response in
glioblastoma. Proceedings of the National Academy of Sciences 2014;111:4542–7.
https://doi.org/10.1073/PNAS.1323855111.
[5] Meissner JE, Korzowski A, Regnery S, Goerke S, Breitling J,
Floca RO, et al. Early response assessment of glioma patients to
definitive chemoradiotherapy using chemical exchange saturation transfer
imaging at 7 T. Journal of Magnetic Resonance Imaging 2019;50:1268–77.
https://doi.org/10.1002/jmri.26702.
[6] Barisano G, Sepehrband F, Ma S, Jann K, Cabeen R, Wang D, et
al. Clinical 7 T MRI: Are we there yet? A review about
magnetic resonance imaging at ultra-high field. The British Journal of
Radiology 2019;92. https://doi.org/10.1259/BJR.20180492.
[7] Morrison M, Lupo J. 7-T
Magnetic Resonance Imaging in the Management of Brain Tumors. Magnetic
Resonance Imaging Clinics of North America 2021;29:83–102.
https://doi.org/10.1016/J.MRIC.2020.09.007.
[8] Khlebnikov V, Bhogal A, Mougin O, Boer V, Wijnen J, Gowland
P, et al. Multicolor metabolic quantitative CEST (mmqCEST)
imaging: possibility and limitations (ISMRM 2019), Montréal
[9] Fonov V, Evans A,
McKinstry R, Almli C, Collins D. Unbiased nonlinear average age-appropriate
brain templates from birth to adulthood. NeuroImage 2009;47:S102.
https://doi.org/10.1016/S1053-8119(09)70884-5.
[10] Fonov V, Evans AC,
Botteron K, Almli CR, McKinstry RC, Collins DL. Unbiased average
age-appropriate atlases for pediatric studies. NeuroImage 2011;54:313–27.
https://doi.org/10.1016/J.NEUROIMAGE.2010.07.033.
[11] Klein S, Staring M,
Murphy K, Viergever M, Pluim J. elastix: a toolbox for intensity-based medical
image registration. IEEE Transactions on Medical Imaging 2010;29:196–205.
https://doi.org/10.1109/TMI.2009.2035616.
[12] Krikken E, Khlebnikov V,
Zaiss M, Jibodh RA, van Diest PJ, Luijten PR, et al. Amide chemical exchange
saturation transfer at 7T: A possible biomarker for detecting early response to
neoadjuvant chemotherapy in breast cancer patients. Breast Cancer Research
2018;20. https://doi.org/10.1186/s13058-018-0982-2.
Figures