2075
comprehenCEST: a clinically feasible CEST protocol to cover all existing CEST preparations
Lukas Kamm1, Kai Herz2, Maria Sedykh1, Moritz Fabian1, and Moritz Zaiss1,2
1Neuroradiology, Friedrich-Alexander-University Erlangen-Nürnberg, University Hospital, Erlangen, Germany, 2Magnetic Resonance Center, Max-Planck-Institute for Biological Cybernetics, Tübingen, Germany
1Neuroradiology, Friedrich-Alexander-University Erlangen-Nürnberg, University Hospital, Erlangen, Germany, 2Magnetic Resonance Center, Max-Planck-Institute for Biological Cybernetics, Tübingen, Germany
Synopsis
In a clinical setting, it often has to be decided, which CEST sequences to pick of a collection, due to measurement time limitations. Therefore, eventually not all of the desired contrasts can be measured. In this work, we comprehensively combine seven CEST protocols in a single measurement, use a fast single-shot 3D gradient echo readout and remove redundant regions of the experimental parameter space. Hereby, we can half the total measurement time from 35 to 17 minutes. With further parameter reduction, a total measurement time of 10 minutes is conceivable. This allows to design powerful hypothesis generating clinical pilot studies.
Introduction
Throughout the last decade, several CEST MRI sequences have been developed, of which each focuses on generating a single specific molecular or metabolite contrast. The sequences differ in the experimental parameters of the CEST preparation block, like the B1 amplitude, linked to the exchange-rate-dependent labelling efficiency, the saturation pulse shape and duration, pulse train length and duty cycle, relaxation delay and the sampled frequency offsets.Measuring all sequences by default in a clinical environment would exceed the available measurement time per subject, e.g., due to comfort, motion, and cost. Hence, the study design requires to select few or just one CEST contrast, depending on the suspected diagnose. To resolve this issue, and to avoid potential loss of useful molecular information, we aim herein to concatenate all CEST contrasts in a single, clinically feasible protocol. To achieve this, we first combine the parameter spaces of all sequences and make an ideal parameter selection to reduce redundancies upon contrast conservation. Furthermore, we use a fast, 3D snapshot-CEST readout to probe the Z-magnetization after each preparation.
Methods
Subjects were measured at a Siemens PRISMA scanner (3T, 64-Rx, 1Tx) after written informed consent. All of a collection of seven different CEST sequences are measured in-vivo with the preparation and relaxation parameters as published, covering a range of B1cwpe levels from 0.5 to 4 µT, with low-B1 selective for amide and rNOE pools6, amide proton transfer weighted imaging (APTw) at different power levels5, Glutamate-weighted CEST, which may contribute to the pathophysiology of neurological disorders2; amine-exchange-based pH value, which can for example be linked with aerobic glycolysis caused by brain tumors3; a spin-locked measurement of hydroxyl groups4.Frequency offsets are symmetrized and can be extended. After the preparation block (including fat saturation and crusher gradients in all three directions) the prepared state is acquired by a 3D spiral-centric-reordered gradient echo readout with a single excitation pulse (snapshot-CEST1). An external B0-correction is performed using the WASABI method, to omit frequency offsets around the water resonance. The reduction of sample points and thus acquisition times is performed by three subsequent steps: (i) The performance of the single sequences is assessed regarding the Contrast-Noise-Ratio CNR of a specific contrast at {x ppm} (e.g., MTRasym at {2 ppm}). (ii) The essential contrast-generating features of each sequence are identified in the experimental parameter space. (iii) areas causing the highest CNR for spectroscopic in-vivo frequency offsets x of interest (e.g., 3.5 ppm amides, etc.) of the experimental parameter space are picked and concatenated.
Results
Figure 2 shows a simulation of the selected CEST protocols; Z-spectra (Fig 2a) and CEST effects (Fig 2b) show different responses to the different protocols. The original scan time of seven individual sequences is about 35 minutes. Solely by removing offsets not generating a specific molecule/metabolite contrast (extended frequency intervals accounting for B0 inhomogeneities included) and sparse offset sampling, we can reduce the scan time roughly by a factor of two. This results in 7 obtained contrasts with a combined sequence time of 17 minutes, without the loss of contrast (Figure 3). Reduced maps were generated by retrospective removal of offsets from the original dataset. Current work focuses on further reduction of the total scan time by elimination of more frequency offsets and other redundant parameter combinations.Discussion & Conclusion
To identify the best CEST protocol for a pathology, we have to measure all the best candidates in the same patients, instead of only one protocol. By combining sparse sampling and a snapshot readout, a comprehensive protocol covering most of the reported labelings within 10 minutes is conceivable. This allows to design powerful hypothesis generating clinical pilot studies, and a subsequent data-driven selection of the most insightful CEST labelling. While CEST fingerprinting approaches also address more comprehensive coverage of the CEST parameter space, MRF relies on theoretical modelling, which remains challenging. comprehenCEST on the contrary can make use of all existing knowledge and literature about certain labelings, and still cover all detectable effects, even effects that cannot be modelled by Bloch equations, yet.Acknowledgements
No acknowledgement found.References
- Zaiss, M, Ehses, P, Scheffler, K. Snapshot-CEST: Optimizing spiral-centric-reordered gradient echo acquisition for fast and robust 3D CEST MRI at 9.4 T. NMR in Biomedicine. 2018; 31:e3879. https://doi.org/10.1002/nbm.3879
- Nanga, RPR, DeBrosse, C, Kumar, D, et al. Reproducibility of 2D GluCEST in healthy human volunteers at 7 T. Magn Reson Med. 2018; 80: 2033– 2039. https://doi.org/10.1002/mrm.27362
- Harris RJ, Yao J, Chakhoyan A, Raymond C, Leu K, Liau LM, Nghiemphu PL, Lai A, Salamon N, Pope WB, Cloughesy TF, Ellingson BM. Simultaneous pH-sensitive and oxygen-sensitive MRI of human gliomas at 3 T using multi-echo amine proton chemical exchange saturation transfer spin-and-gradient echo echo-planar imaging (CEST-SAGE-EPI). Magn Reson Med. 2018 Nov;80(5):1962-1978. doi: 10.1002/mrm.27204
- Herz K, Lindig T, Deshmane A, Schittenhelm J, Skardelly M, Bender B, Ernemann U, Scheffler K, Zaiss M. T1ρ-based dynamic glucose-enhanced (DGEρ) MRI at 3 T: method development and early clinical experience in the human brain. Magn Reson Med. 2019 Nov;82(5):1832-1847. doi: 10.1002/mrm.27857
- Yuan J, Chen S, King AD, et al. Amide proton transfer-weighted imaging of the head and neck at 3 T: a feasibility study on healthy human subjects and patients with head and neck cancer. NMR Biomed. 2014;27(10):1239-1247. doi:10.1002/nbm.3184
- Goerke, S, Soehngen, Y, Deshmane, A, et al. Relaxation-compensated APT and rNOE CEST-MRI of human brain tumors at 3 T. Magn Reson Med. 2019; 82: 622– 632. https://doi.org/10.1002/mrm.27751
Figures
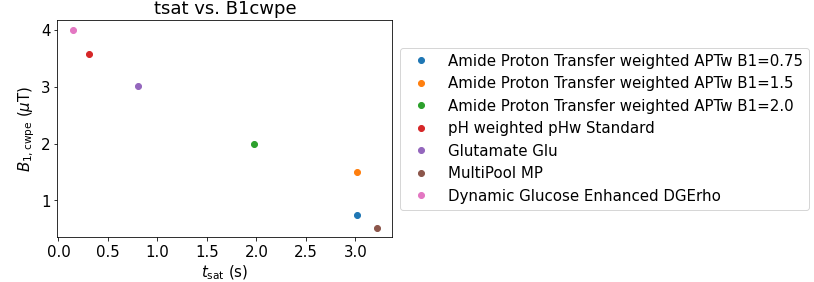
Figure 1: B1 field amplitude as continuous wave power equivalent B1cwpe versus saturation time tsat of the sequences contained in comprehenCEST.
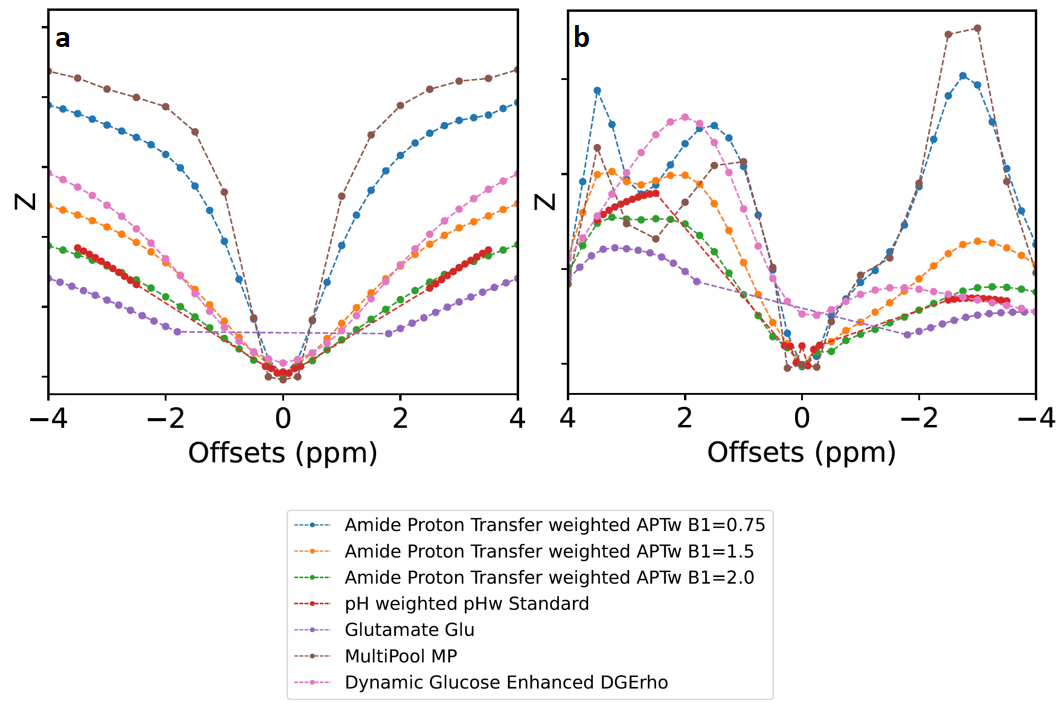
Figure 2a: Z spectra simulation results of all sequences contained in comprehenCEST. Figure 2b: Resulting CEST effects via subtraction of direct water saturation and magnetization transfer. The simulation was performed using pulseq-cest, an open-source Bloch-McConnel simulation and collection of multi-pool parameter sets (https://pulseq-cest.github.io). The simulation contained five pools: Amides at 3.5ppm, Amines at 3ppm, Guanidine at 2ppm, Hydroxyl at 1.3ppm and an average of 5 NOE pools at -2.75ppm (File: WM_3T_001_bmsim.yaml).
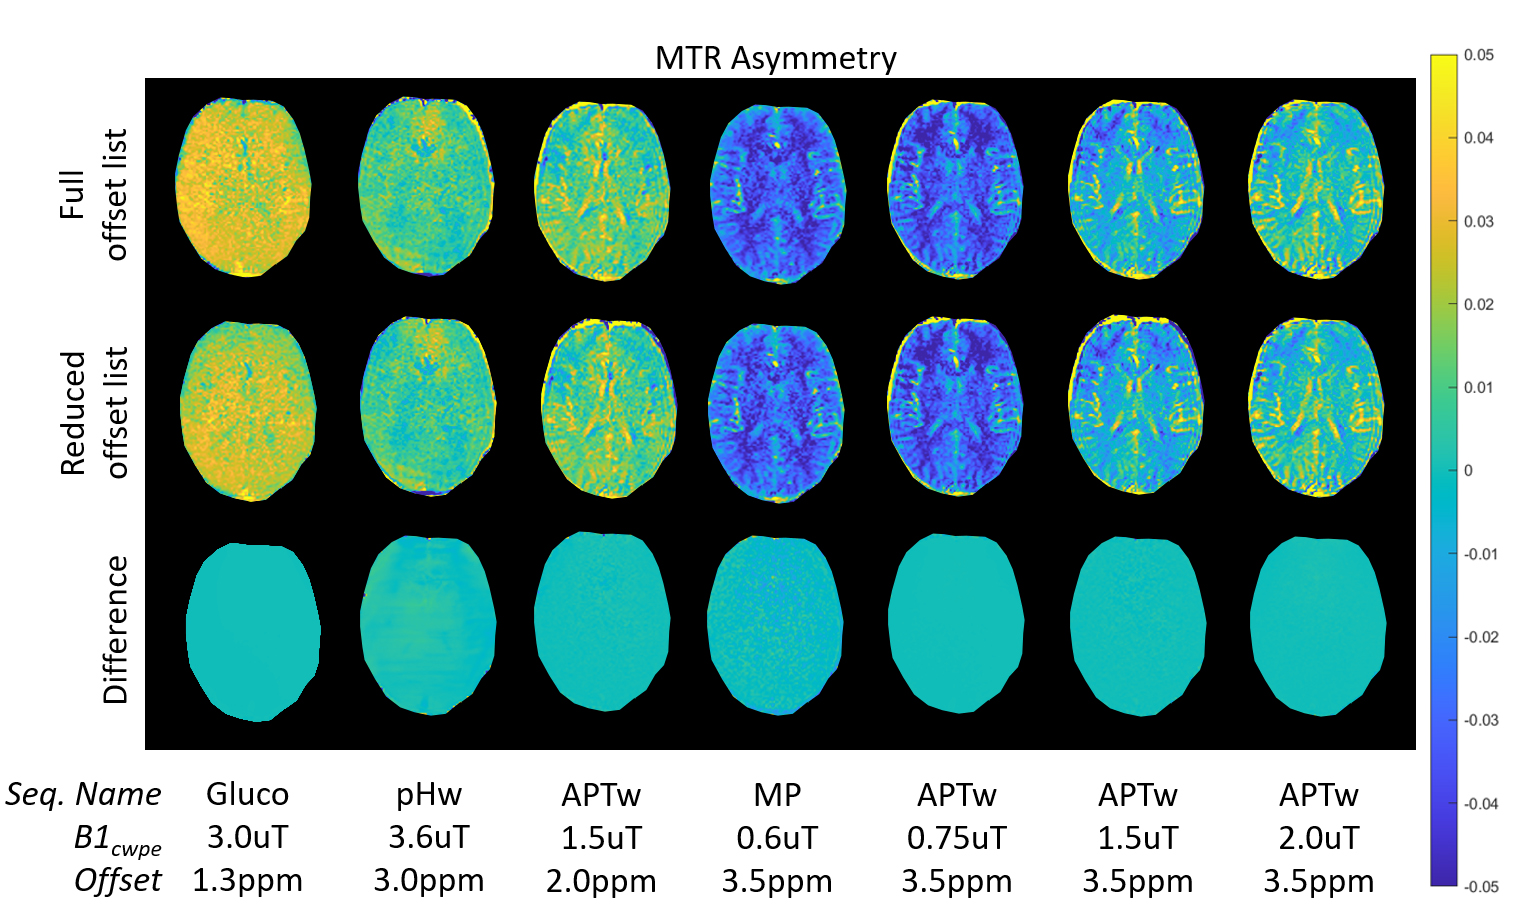
Figure 3: In-vivo measurement of the brain (PRISMA, 3T, 64 Rx, 1 Tx) in a healthy volunteer. The asymmetry of the magnetization transfer ratio MTRasym is shown at selected offsets for four of the seven protocols contained in comprehenCEST. The upper row displays data obtained with the full, original offset list. The second row shows the data after retrospective removal of redundant frequency offsets. Difference plots are drawn in the third row. In all cases, contrast is conserved while reducing the measurement time from 35 to 17 minutes.
DOI: https://doi.org/10.58530/2022/2075