2074
Modelling inhomogeneous magnetization transfer in myelin and intra-/extra-cellular water in normal and injured rat spinal cords1Physics and Astronomy, University of British Columbia, Vancouver, BC, Canada, 2UBC MRI Research Centre, University of British Columbia, Vancouver, BC, Canada, 3International Collaboration on Repair Discoveries, Vancouver, BC, Canada, 4Radiology, University of British Columbia, Vancouver, BC, Canada
Synopsis
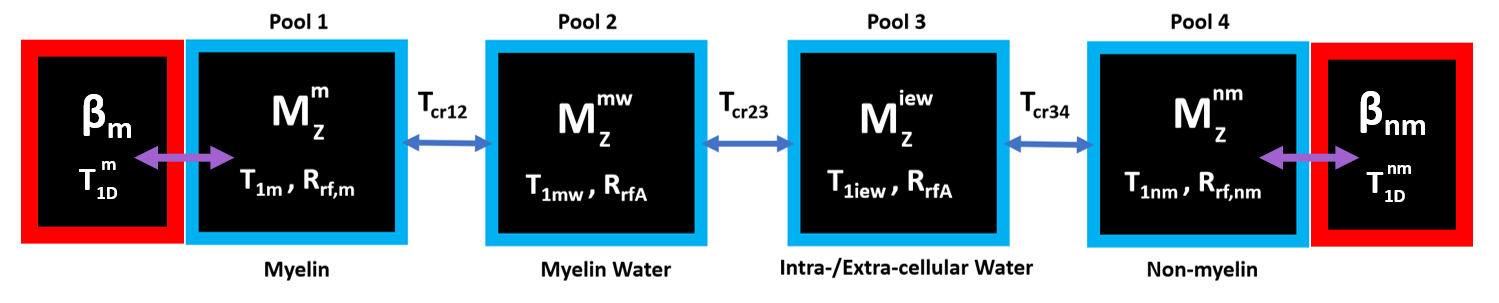
An MR imaging technique called inhomogeneous magnetization transfer (ihMT) could potentially be used for quantitative myelin imaging by using T1D filtering to filter out the short dipolar relaxation time (T1D) components. However, to show that ihMT with T1D filtering is myelin-specific, we need to confirm that myelin has the longest T1D in nerve tissue. Here, we combined ihMT and myelin water imaging (MWI) to separate the ihMT signal in myelin water from intra-/extra-cellular water, which we fitted using a four-pool model with dipolar order reservoirs. Our model allowed us to connect myelin with myelin water and measure myelin’s T1D.
Introduction
Inhomogeneous magnetization transfer(ihMT) aims to quantitatively image myelin but is known to exhibit nonzero ihMT signal in substances other than myelin1. However, if myelin has the longest dipolar relaxation time(T1D), we can improve myelin specificity by using T1D filtering to filter out the short T1D components2. To measure T1D of myelin in ex-vivo rat spinal cord, we combined ihMT with CPMG to measure the ihMT signal of myelin water(MW) and intra-/extra-cellular water(IEW), and modelled the signal by integrating the bi-component T1D model3 with the four-pool model4–6.Methods
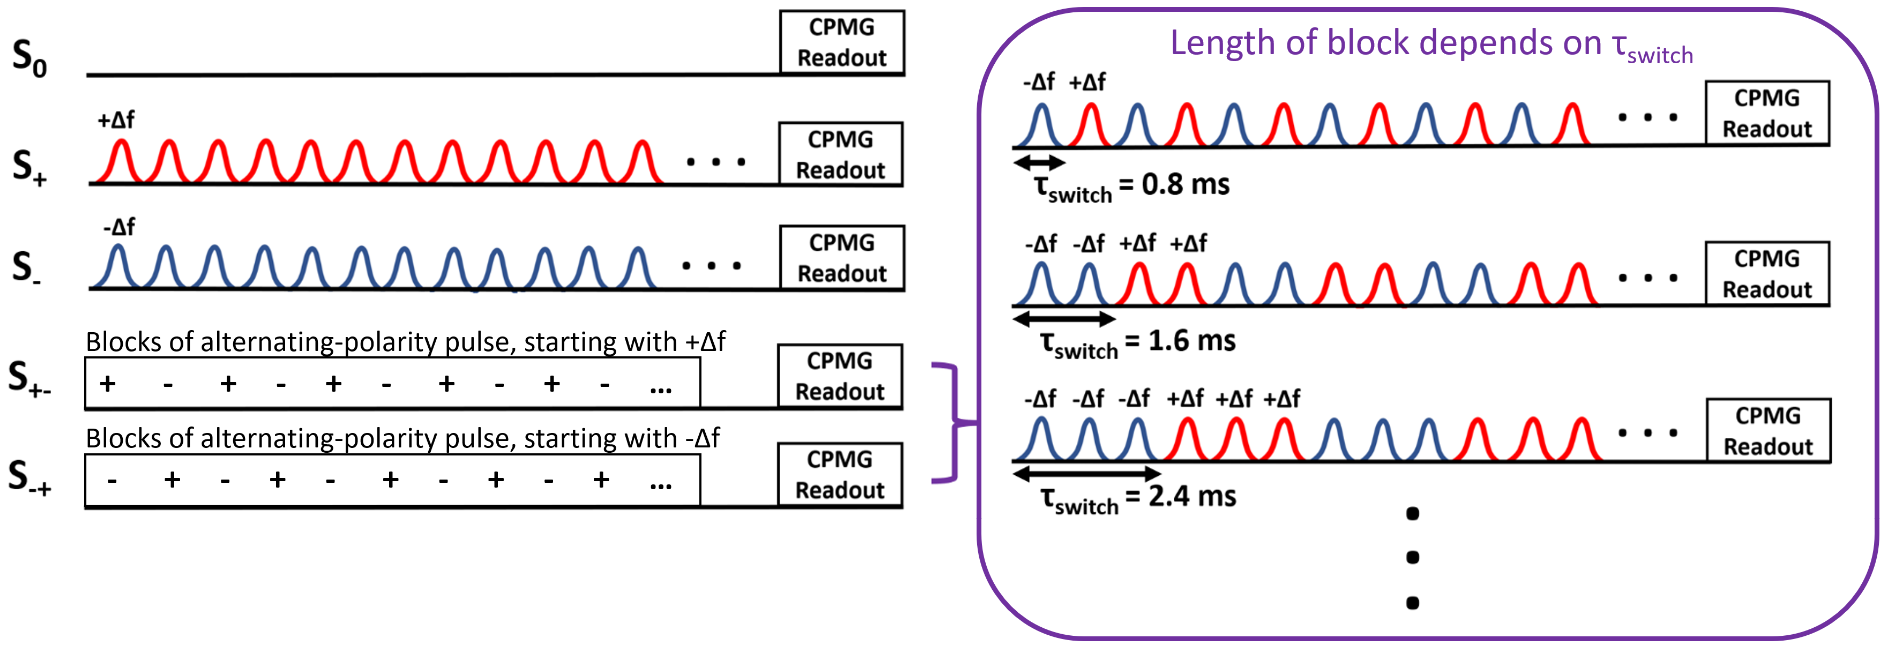
The MR data was collected using a solenoid coil on a 7T Bruker Biospec system(Bruker Biospin, Ettlingen, Germany).MR experiments: We imaged nine formalin-fixed rat spinal cords at 38 ± 1°C, with an ihMT prepulse module combined with a CPMG readout. Three healthy rats were sacrificed, and six rats were injured with a dorsal column transection at the C5 region. The injured rats were sacrificed 3-weeks post-injury(n=3) and 8-weeks post-injury(n=3), and imaged 5mm cranial to the injury site. We performed five scans with the saturation schemes: single negative offset(S-), single positive offset(S+), two alternating-frequency dual offset(S+- , S-+), and no saturation(S0). Scan parameters were Δf = +9655Hz and -10345Hz, B1,rms = 5.8μT, number of Hann-shaped pulses = 1440, pulse width = 1ms, interpulse spacing = 0.3ms, TR/TE = 2750/6.753ms, 48 echoes, echo spacing = TE, FOV = 1x1cm2 , matrix = 64x128, and slice thickness = 4mm, and 2 averages. We manipulated our T1D filter by varying τswitch at 11 different switch times: 0.8ms, 1.6ms, 2.4ms, 4ms, 4.8ms, 6.4ms, 8ms, 9.6ms, 12ms, 16ms, and 19.2ms(Fig. 1). An extra CPMG scan with identical scan parameters using 6 averages and no presaturation was collected at room temperature. A diffusion tensor imaging(DTI) scan was acquired at 38 ± 1°C using a multi-slice spin-echo sequence. The DTI scan parameters were TR = 1050ms, TE = 21.337ms, matrix = 64x128, FOV = 1x1cm2, slice thickness = 1mm, and 4 averages.
Data analysis: We used a Non-Local Means algorithm7 to denoise our raw images before performing non-negative least squares(NNLS)8, with 32 echoes to improve fitting, on the CPMG scan taken at room temperature. The resulting T2 distribution was used to obtain the T2 modal value and area, under each peak. The no saturation ihMT-CPMG scan was then fitted with a bi-exponential with 48 echoes, using the previous peak area and T2 modes as initial guesses to obtain the new amplitudes and T2 times for MW and IEW. To fit the pre-saturated ihMT-CPMG data(S+, S-, S+-, S-+), we fixed the T2 times in the bi-exponential model with the fitted T2 values from S0, and used the fitted S0 amplitudes as initial guesses to find the new amplitudes. The ihMT ratio(ihMTR = (S+ + S- - S+- – S-+)/(2*S0)) was calculated for MW and IEW by replacing S with the fitted MW and IEW amplitudes, and the conventional ihMTR was calculated from the 1st echo images. These three ihMTR(τswitch) decay curves were fitted using a four-pool model including dipolar order reservoirs(Fig. 2). Note, some model parameters were taken from previous MT measurements9. For each pixel in our ROI, we measured the T1D(myelin), T1D(non-myelin), fraction of the semisolid pool related to myelin(fD), and the cross-relaxation time between MW and IEW(Tcr). Myelin water fraction(MWF) was calculated by taking the ratio of the area under the MW peak(T2<25ms) to the total signal.
Results and Discussion
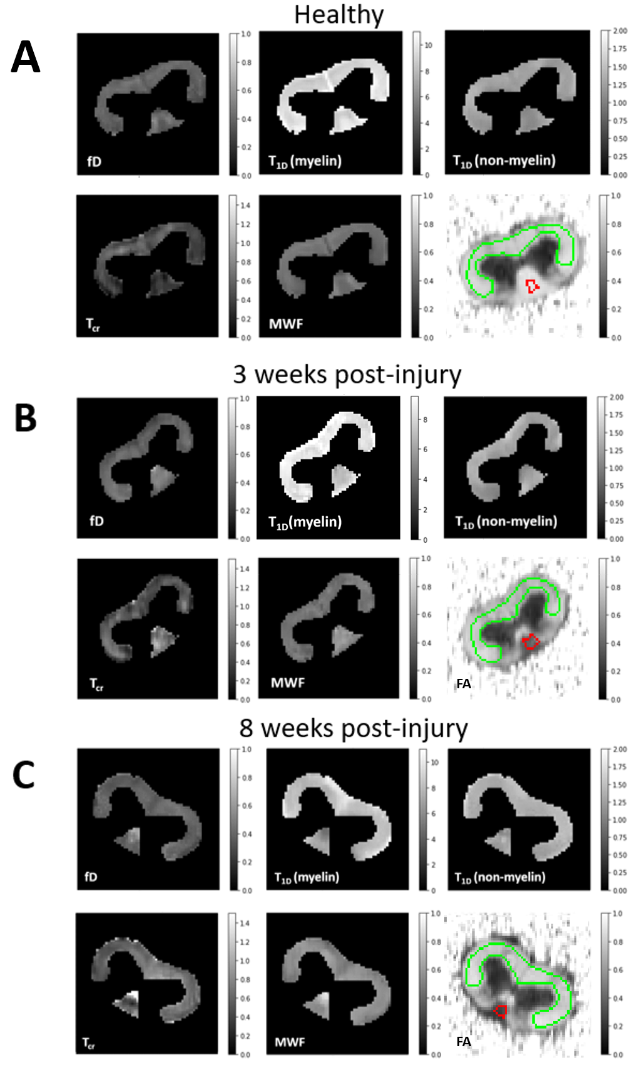
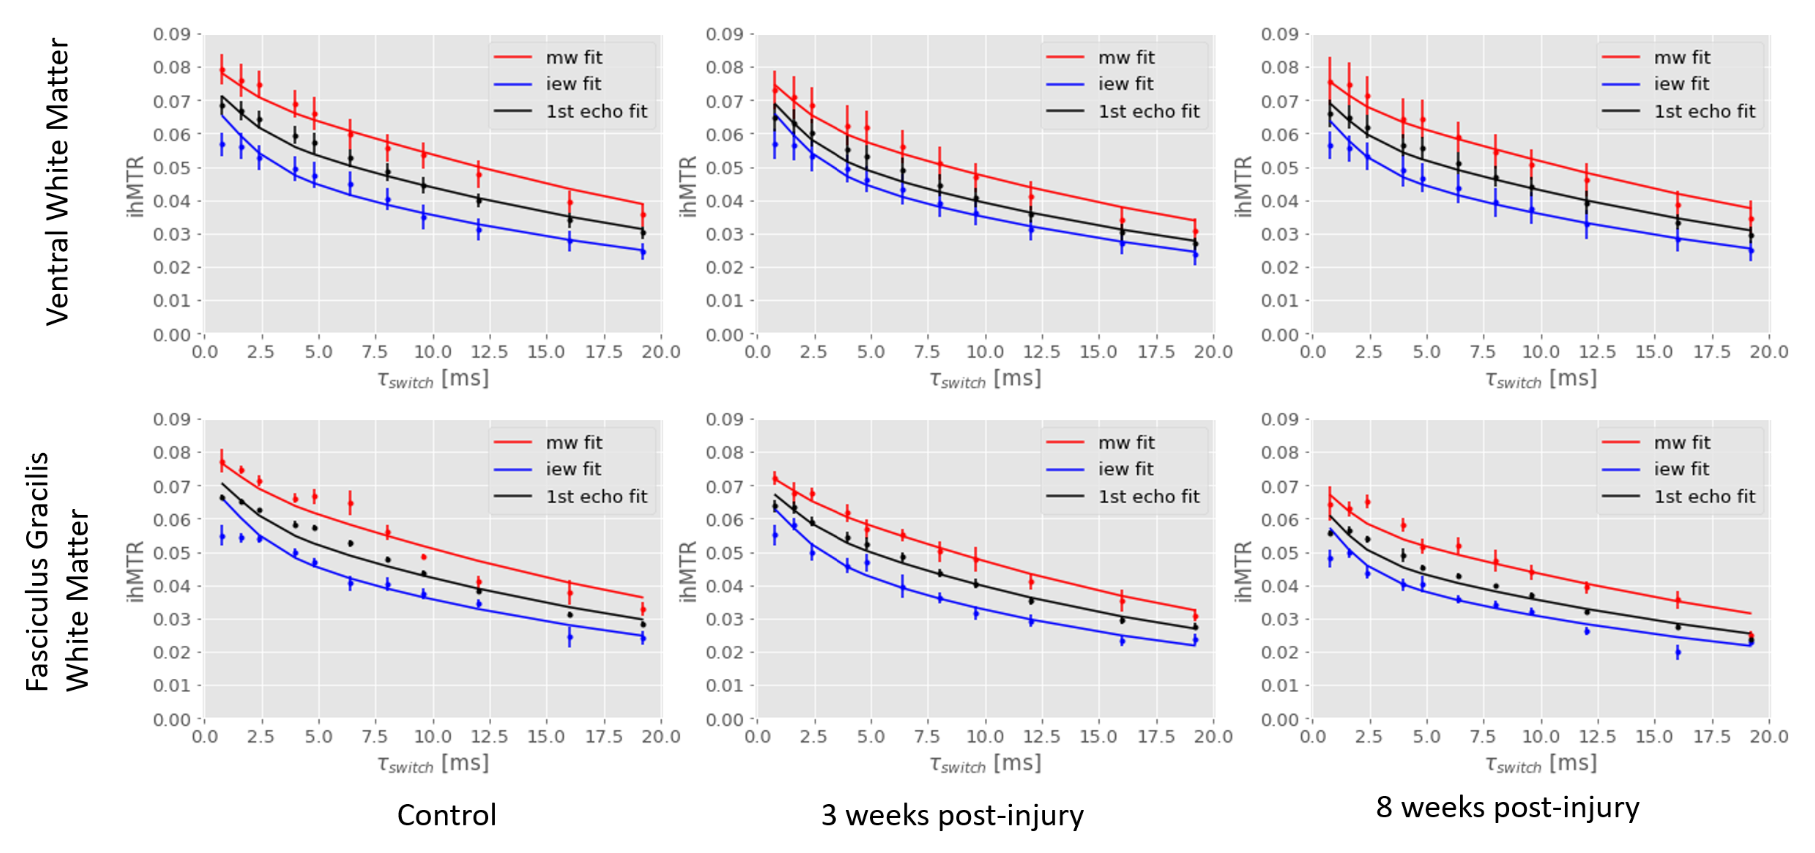
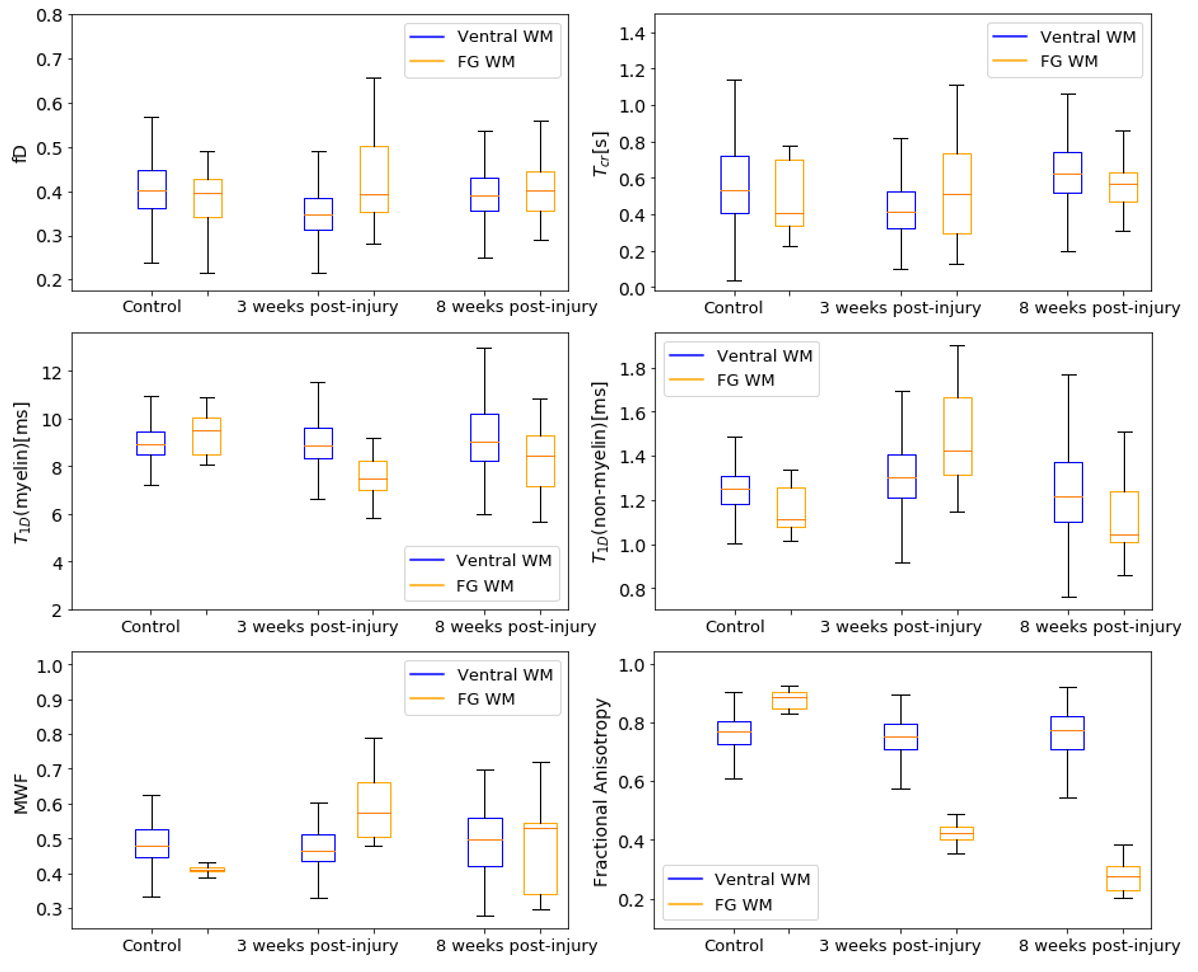
The ihMTR-MW/-IEW/-1st echo maps at each τswitch were simultaneously fitted using our four-pool model with dipolar order reservoirs to obtain the parameter maps seen in Fig. 3. To visualize how well our model fitted the ihMTR(τswitch) decay curves we fitted the mean ihMTRs from the ventral white matter (WM) and fasciculus gracilis(FG) ROIs, which appears to overestimate ihMTR-IEW at short τswitch times(Fig. 4).Fig. 5 compares our fitted parameters between the ventral WM and FG across the cord groups, and we see the fitted parameters for the ventral WM agrees for all groups. The most significantly different parameter was T1D(myelin) in the FG of the 3 weeks post-injury cords compared to the controls, which is when myelin debris is still present. Note, we expect the myelin debris to be cleared 8 weeks post-injury. This lower T1D(myelin) in the 3 weeks post-injury cord suggests a lower dipolar coupling strength from the myelin debris versus functional myelin.
Note, our MWF and fractional anistrotropy(FA) maps agreed with previous results of this injury model10, except for the no significant difference between the MWF in the 8 weeks post-injury versus healthy cord. We believe this is due to the partial volume effect since our images were acquired at a lower resolution.
Conclusion
Our study combined ihMT with CPMG to measure the ihMT signal in MW and IEW, and the overall ihMTR, which were fitted with our expanded four pool model to measure T1D. We could not fully model the ihMTR-IEW at short τswitch times, indicating our T1D(non-myelin) may not be accurate, and the model needs improvement. We saw a significant drop in T1D(myelin) in the 3 weeks post-injury cords compared to healthy controls, suggesting T1D(myelin) could potentially distinguish between functional myelin and myelin debris, although more studies are warranted to confirm this.Acknowledgements
No acknowledgement found.References
1. Manning, A. P., Chang, K. L., MacKay, A. L. & Michal, C. A. The physical mechanism of “inhomogeneous” magnetization transfer MRI. J. Magn. Reson. 274, 125–136 (2017).
2. Prevost, V. H. et al. Optimization of inhomogeneous magnetization transfer (ihMT) MRI contrast for preclinical studies using dipolar relaxation time (T1D) filtering. NMR Biomed. 30, (2017).
3. Carvalho, V. N. D. et al. MRI assessment of multiple dipolar relaxation time (T1D) components in biological tissues interpreted with a generalized inhomogeneous magnetization transfer (ihMT) model. J. Magn. Reson. 311, 106668 (2020).
4. Kalantari, S., Laule, C., Bjarnason, T. A., Vavasour, I. M. & Mackay, A. L. Insight into In Vivo Magnetization Exchange in Human White Matter Regions. Magn. Reson. Med. 66, 1142–1151 (2011). 5. Barta, R. et al. Modeling T1 and T2 relaxation in bovine white matter. J. Magn. Reson. 259, 56–67 (2015).
6. Bjarnason, T. A., Vavasour, I. M. & Mackay, A. L. Characterization of the NMR Behavior of White Matter in Bovine Brain. Magn. Reson. Med. 54, 1072–10811 (2005).
7. Coupe, P. et al. An Optimized Blockwise Nonlocal Means Denoising Filter for 3D Magnetic Resonance Images. IEEE Trans. Med. Imaging 27, 425–441 (2008).
8. Whittall, K. P. & MacKay, A. L. Quantitative interpretation of NMR relaxation data. J. Magn. Reson. 84, 134–152 (1989).
9. Gochberg, D. F. & Gore, J. C. Quantitative Magnetization Transfer Imaging via Selective Inversion Recovery With Short Repetition Times. Magn. Reson. Med. 57, 437–441 (2007).
10. Kozlowski, P. et al. Characterizing White Matter Damage in Rat Spinal Cord with Quantitative MRI and Histology. J. Neurotrauma 25, 653–676 (2008).
Figures